A peripheral circulating compartment of natural naive CD4+ Tregs (original) (raw)
Abstract
CD4+CD25+ Tregs play a central role in the maintenance of peripheral self tolerance by keeping autoreactive T cells in check. Whereas the thymic origin of CD4+CD25+ Tregs, as a distinct lineage, has been inferred, understanding of their developmental pathways has remained elusive. In both mice and humans, peripheral CD4+CD25+ Treg populations have been described as composed of antigen-experienced T cells that fail to significantly proliferate following TCR stimulation but suppress proliferation and effector functions of CD25– T cells. Here we show that analysis of CD25 expression in human circulating CD4+ T lymphocytes with respect to their in vivo differentiation stages identifies a distinct subset of CD25+CCR7+CD62L+CTLA-4+FOXP3+ cells contained in the CD45RA+/RO– naive fraction. The subset, which we have named natural naive Tregs (NnTregs), is prominent in young adults and decreases with age together with the total naive CD4+ population. NnTregs are anergic following stimulation in the absence of IL-2 and exert ex vivo cell-cell contact–mediated suppressor functions. In addition, they proliferate in response to stimulation with autologous APCs, which indicates a high enrichment in T cells bearing self-reactive TCRs. The definition of this subset has important implications for the analysis of human naturally occurring Tregs and for their targeting in therapeutic immune interventions.
Introduction
One essential prerequisite for the optimal functioning of our immune system is its ability to differentiate self from non-self. This is primarily achieved through negative selection of autoreactive T cells in the thymus (1). Because a certain percentage of these cells escape central tolerance, however, there exist different mechanisms of peripheral tolerance that keep autoreactive T cells under control. A population of CD4+ Tregs has been identified as a key player in the maintenance of self tolerance. In mice and humans, this population has been defined by the assessment of the expression of CD25, the IL-2 receptor α-chain. CD25, however, is also expressed by recently activated T cells and cannot therefore serve as an absolute marker for Tregs. A number of other molecules, including CTL-associated protein 4 (CTLA-4) and the forkhead box P3 (FOXP3) gene product, scurfin, have been shown as being expressed in vivo by Tregs but can also be expressed by some CD4+CD25– T cells following activation (2, 3).
Several distinct subsets of CD4+ T cells with regulatory activity have been described in both mice and humans. Their developmental pathways, however, and the extent to which these populations overlap, remain to date largely undefined (4). One subset is represented by naturally occurring CD4+ Tregs, generated in the thymus, which constitutively express CD25. It has been proposed that thymically generated CD4+CD25+ Tregs express high-affinity TCRs specific for self peptides and undergo a modified thymic selection process as compared with conventional CD4+ T cells (5). Other CD4+ Treg populations include Th3 cells secreting high levels of TGF-β1, which can be induced by oral antigen administration or stimulation of CD4+CD25– T cells in the presence of TGF-β1, and regulatory T class 1 (Tr1) cells secreting IFN-γ and IL-10, which can be induced following in vitro stimulation in the presence of exogenous IL-10 (6–8). These Treg subsets are most likely generated in the periphery, which enables the development of peripheral tolerance to self antigens not expressed at adequate levels in the thymus.
CD4+CD25+ T cells have been identified among thymocytes, cord blood cells, and circulating T cells. Depletion or functional alteration of this subset in normal animals results in the development of autoimmune diseases. In athymic nude mice, transfer of syngeneic splenic cells depleted in CD4+CD25+ T cells produces autoimmune disease that is preventable by the cotransfer of small numbers of CD4+CD25+ T cells (9). In addition to their role in the control of self tolerance and autoimmune diseases, Tregs are also involved in the regulation of T cell homeostasis (10) as well as in the modulation of immune responses to cancer, pathogens, and alloantigens (11–13). Because of their immunoregulatory/suppressive characteristics, Tregs represent an attractive population to target for tuning the immunological status of the host in the context of various pathologies and immune interventions.
In both animals and humans, circulating CD4+CD25+ Tregs have been thus far consistently defined as belonging to the memory T cell compartment, being anergic (i.e., naturally unresponsive to TCR-mediated signaling in the absence of exogenously added IL-2), having a relatively poor proliferative potential, and being prone to apoptosis (14–17). In humans, initial studies have targeted the entire CD4+CD25+ circulating T cell population representing, as in mice, 6–10% of total CD4+ T cells. More recently, however, it has been suggested that only a part of this cell population, which represents 1–2% of CD4+ T cells expressing the highest levels of CD25 (CD4+CD25high), exerts ex vivo suppressor functions (18). To gain insight into the physiology of human circulating CD4+ regulatory T lymphocytes, we analyzed their CD25 expression with respect to their in vivo differentiation stage. We report the identification and analysis of a distinct subset of CD4+CD25+CCR7+CD62L+CTLA-4+FOXP3+ T cells contained in the CD45RA+/RO– naive compartment. The implications of the phenotypic definition of this compartment for the analysis of naturally occurring CD4+CD25+ Tregs and for their use in therapeutic immune interventions are discussed.
Results
Subsets of naive CD4+CD25+ Tregs in human peripheral blood.
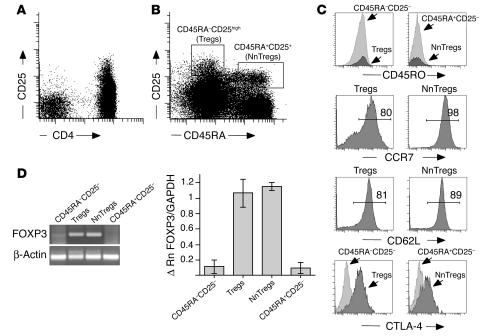
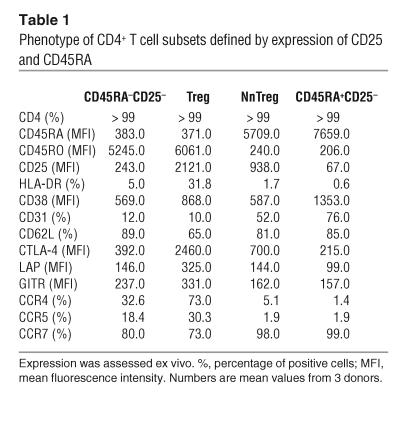
Human naive and memory T cells can be distinguished by the reciprocal expression of CD45RA or CD45RO isoforms (19). Staining of peripheral blood T cells with antibodies to CD45RA, CD45RO, and CD25 revealed 4 subsets of CD4+ T cells: 1 naive CD45RA+(RO–)CD25– subset, a clearly distinct CD45RA+(RO–)CD25+ population, and 2 memory subsets, 1 CD45RA–(RO+) population expressing intermediate levels of CD25, which we will define as CD45RA–CD25–, and the previously described CD45RA–(RO+)CD25high population corresponding to Tregs (Figure 1B; compare with Figure 1A). Both CD45RA+CD25– and CD25+ cells expressed high levels of CD62L and CCR7, which were also expressed by a large proportion of Tregs. CD45RA+CD25+ cells and Tregs expressed higher ex vivo levels of CTLA-4 as compared with their corresponding CD25– counterpart populations (Figure 1C; Table 1). To assess the ex vivo expression of FOXP3 in the 4 defined CD4+ subsets, highly purified naive and antigen-experienced CD4+CD25+ and CD25– T cell populations were obtained using a procedure that involved magnetic isolation of CD4+ T cells from circulating peripheral lymphocytes followed by separation of the 4 populations by FACS cell sorting. Semiquantitative PCR analysis of the sorted populations revealed that detectable ex vivo expression of FOXP3 was confined to the CD45RA+CD25+ cell and Treg subsets (Figure 1D). It is noteworthy that the ex vivo expression level of FOXP3 in the CD45RA+CD25+ population, as assessed by real-time PCR, was comparable to that found in Tregs.
Figure 1.
Expression of CD25 and CD45RA defines 4 distinct subsets of peripheral blood CD4+ T cells. Peripheral blood lymphocytes were stained with monoclonal antibodies to CD3, CD4, CD25, and CD45RA, which identified 4 major subsets. (A) Gated on lymphocytes. (B) Gated on CD4+ T cells. (C) CD4+ T cell subsets were further analyzed for the expression of CD45RO, CCR7, CD62L, and CTLA-4. Numbers indicate percentages of CCR7- or CD62L-expressing cells. (D) FOXP3 gene expression was assessed by conventional and by quantitative real-time PCR on the corresponding 4 sorted populations. For the PCR, an example from a representative donor is shown. Δ Rn is the difference between the Rn (emission intensity of the reporter dye/emission intensity of the passive reference) of the sample (PCR reaction with cDNA template) and the Rn of a control (PCR reaction without cDNA template or early cycles of a real-time reaction). Real-time PCR data are shown as the mean values obtained from 3 independent donors.
Table 1.
Phenotype of CD4+ T cell subsets defined by expression of CD25 and CD45RA
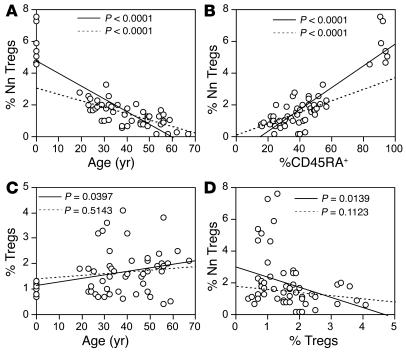
Together, these results define a subset of peripheral CD4+CD25+ T cells exhibiting a naive phenotype, which we named natural naive Tregs (NnTregs). To evaluate this newly defined T cell subset, we examined the percentage of NnTregs in relation to age. In cord blood, up to 7% of total CD4+ T cells displayed this phenotype (n = 7, mean = 5.8 ± 1.1). In adults, the population accounted for 0.2 to 3.3% of the total circulating CD4+ T cells in a panel of healthy individuals (n = 47, mean 1.4 ± 0.7). We found a significant inverse correlation between the percentage of NnTregs and the age of the donors (Figure 2A) and a significant direct correlation between the percentage of NnTregs and that of total CD4+ naive T cells (Figure 2B). In contrast, no significant correlation was found between age and proportion of Tregs (n = 47, mean 1.7 ± 0.9) (Figure 2C) or between relative proportions of the NnTreg and Treg subsets (Figure 2D).
Figure 2.
Variation in the frequency of circulating NnTregs and Tregs during aging. Dots correspond to individual samples tested. Linear regression was calculated either taking into account all samples (solid lines) or only adult blood samples (dashed lines). A significant inverse correlation was found between the frequency of NnTregs and age (A), and a significant positive correlation was found between the frequency of NnTregs and total naive CD4+ T cells (B). In contrast, no significant correlation was found between the frequency of Tregs and age (C) or between the frequency of NnTregs and Tregs (D).
Ex vivo phenotypic analysis and replicative history of NnTregs.
To investigate further the characteristics of NnTregs, we analyzed the ex vivo expression of a panel of molecular markers by this population in comparison with that of other subsets of CD4+ T cells (Table 1). In addition to the expression of CD45RA, CCR7, and CD62L and the lack of expression of CD45RO by the large majority of NnTregs, this population shared other features with CD4+ naive T cells, including exhibiting no significant expression of HLA-DR, which was expressed by a considerable fraction of Tregs. Chemokine receptors CCR4 and CCR5 were expressed by a large fraction of Tregs. However, only a minor fraction of NnTregs expressed CCR4, whereas no significant expression of CCR5 was detected. Interestingly, NnTregs expressed lower levels of CD45RA as compared with CD25– naive T cells. They expressed levels of CD38 (ADP-ribosyl cyclase/cyclic ADP-ribose hydrolase) that were lower than those of CD25– naive T cells and comparable to those of the antigen-experienced CD25– population. In addition, they included lower proportions of CD31-expressing (PECAM-1–expressing) cells as compared with other naive CD4+ T cells, but much higher proportions compared with both the antigen-experienced CD25– and Treg fractions. In addition to evaluating expression of CTLA-4, we addressed the ex vivo expression by NnTregs of 2 other molecules that have been reported as involved in Treg functions, TGF-β1 and glucocorticoid-induced TNF receptor (GITR). In mice, expression of membrane TGF-β1 is clearly detectable using monoclonal antibodies against active TGF-β1. In contrast, only marginal amounts of TGF-β1 can be detected at the surface of human cells (20). However, surface expression of latent TGF-β can be detected in sorted and activated human CD4+CD25high T cells by staining with an antibody specific for human TGF-β1 latency-associated peptide (LAP). Using this antibody, we detected ex vivo a level of TGF-β1 LAP expression in Tregs that was only moderately increased as compared with that in antigen-experienced CD25– T cells (Table 1). The increase was even smaller (at the limit of detection) for NnTregs as compared with naive CD25– T cells. Only a small increase in the level of GITR expression was detectable ex vivo for Tregs, as compared with that of antigen-experienced CD25– T cells, whereas no significant increase was detectable for NnTregs as compared with naive CD25– T cells.
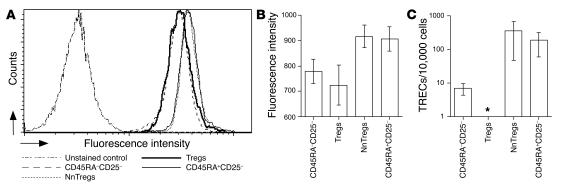
We next evaluated the replicative history of NnTregs by assessing their telomeres’ length and T cell receptor excision circle (TREC) content in comparison with that of the other populations defined by expression of CD45RA and CD25, following ex vivo sorting. The analysis revealed that NnTregs have longer telomeres than both antigen-experienced CD25– cells and Tregs, but that their telomeres are similar in length to those of other naive CD4+ T cells (Figure 3, A and B). The TREC content of NnTregs was also similar to that of naive CD25– T cells and higher than that of the antigen-experienced CD25– T cell fraction. In contrast, the TREC content of Tregs was lower than that of antigen-experienced CD25– T cells and below the detection limit of the assay (Figure 3C). These results are consistent with the concept that NnTregs are in an early differentiation stage comparable to that of CD45RA+CD25– naive CD4+ T cells.
Figure 3.
Replicative history of CD4+ T cell populations defined by the expression of CD45RA and CD25. (A) Ex vivo–sorted CD4+ T cell subsets were assessed for telomere length using telomere-specific peptide nucleic acid–fluorescent in situ hybridization (FISH) followed by flow cytometry analysis. Histograms shown are from 1 representative donor. (B) Telomere length data are shown as the mean values obtained for 3 independent donors. (C) Quantification of TREC content of ex vivo–sorted CD4+ T cell subsets. Genomic DNA of sorted subsets was isolated, and the number of TRECs was determined by quantitative real-time PCR. Data are shown as the mean values obtained for 3 independent donors. *Below detection limit.
Functional analysis of NnTregs.
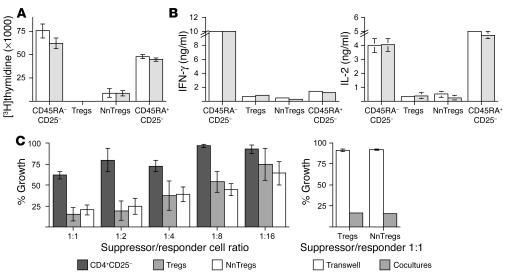
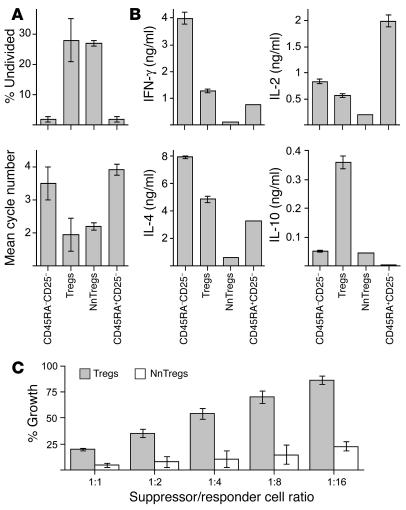
Naturally occurring CD4+CD25+ Treg populations have been previously shown to be composed of anergic cells, i.e., cells unable to significantly proliferate or produce cytokines following TCR-mediated stimulation. To assess NnTreg function in comparison with that of other subsets of CD4+ T cells defined by ex vivo expression of CD45RA and CD25, sorted populations from each subset were stimulated with anti-CD3/CD28 antibodies in the presence of irradiated autologous APCs. Both antigen-experienced and naive CD25– T cells showed a vigorous proliferative response. In contrast, no significant proliferation was observed for Tregs, and only a low level of proliferation, clearly inferior to that of naive CD25– T cells, was observed for NnTregs under these experimental conditions (Figure 4A). The 4 CD4+ T cell populations were also assessed with respect to their cytokine secretion profiles following stimulation with PMA/ionomycin. Antigen-experienced CD25– T cells produced both IL-2 and IFN-γ, whereas naive CD25– T cells produced IL-2 and very little IFN-γ (Figure 4B). In contrast, both Tregs and NnTregs produced only low levels of IL-2 and IFN-γ. No detectable levels of IL-4, IL-10, or TGF-β1 were produced by any of the populations under these test conditions (data not shown).
Figure 4.
Proliferation, cytokine production, and suppressor functions of NnTregs. (A) NnTregs and other CD4+ T cell subsets were isolated by FACS cell sorting and stimulated with plate-bound anti-CD3/CD28 antibodies in the presence of APCs. Cell proliferation was assessed on day 7 after stimulation. Results of duplicate cultures are shown for 2 independent donors. (B) T cell subsets were stimulated by PMA/ionomycin. The concentration of cytokines in the culture supernatants was assessed by ELISA 24 hours after stimulation. Results of duplicate cultures are shown for 2 independent donors. No detectable cytokines were produced by any of the populations in the absence of stimulation (data not shown). (C) Ex vivo–sorted NnTreg and Treg populations were cocultured with responders (CFSE-labeled CD4+CD25– T cells) in the presence of PHA at the indicated suppressor/responder cell ratio. As internal control, CFSE-responders were cocultured with unlabeled responders or with the indicated suppressor population in transwell plates. The growth of CSFE-labeled responders was assessed by flow cytometry at day 5 after stimulation. Results are shown as mean values from 3 independent donors.
To assess the suppressor capacity of NnTregs with respect to the previously defined Treg subset, ex vivo–sorted NnTreg and Treg populations were cocultured with responder CD25– T cells labeled with 5- and 6-carboxyfluorescein diacetate succinimidyl ester (CFSE), in the presence of phytohemagglutinin (PHA) and autologous APCs. On day 5 after stimulation, cell division was assessed by measurement of CFSE dilution (Figure 4C). A clear inhibition of responder T cell expansion was detected upon coculture with NnTregs, comparable to that obtained with Tregs. Consistent with previous reports on the mechanisms of suppression by naturally occurring Tregs, inhibition of responder T cell proliferation by both Tregs and NnTregs involved cell-cell contact mechanisms, as no suppression occurred when the experiment was similarly performed using transwell culture plates, in which responder and suppressor populations are separated by a permeable membrane that prevents cell-cell contact but allows the passage of soluble factors (Figure 4C).
Proliferative capacity of NnTregs and assessment of in vitro–stimulated populations.
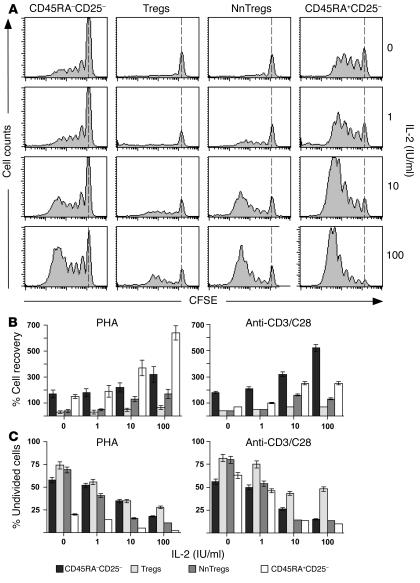
To further examine the relative proliferative capacity of NnTregs, sorted populations from each subset were labeled with CFSE and stimulated with PHA or with anti-CD3/CD28 antibodies and irradiated autologous APCs either in the absence or presence of recombinant IL-2 at different concentrations. On day 5 after stimulation, cell division was assessed by measurement of CFSE dilution (Figure 5A). Cell growth was also evaluated by assessing total recovery of living cells and percentages of undivided cells in the cultures (Figure 5, B and C). Growth of CD25– naive and antigen-experienced T cell populations varied depending on the mode of stimulation and was higher for naive cells in the case of stimulation with PHA and for antigen-experienced cells in the case of stimulation with anti-CD3/CD28 antibodies. In the absence of IL-2, only little proliferation was observed for both NnTregs and Tregs under both stimulation conditions. However, in the presence of IL-2 at intermediate and high doses (10 and 100 IU/ml, respectively), significantly increased growth was detected for NnTregs as compared with Tregs after stimulation with both PHA and anti-CD3/CD28 antibodies.
Figure 5.
Growth of CD4+ T cell subsets following stimulation with PHA or anti-CD3/CD28 antibodies in the absence or presence of IL-2 at different doses. Ex vivo–sorted CD4+ T cell subsets were labeled with CFSE and stimulated with PHA or with anti-CD3/CD28 antibodies, autologous CD4–CD8– APCs, and IL-2 at the indicated doses. (A) Example of data obtained for 1 donor following stimulation with PHA. Cell division was measured at day 5. The dotted lines indicate CFSE intensity of undivided cells. Percentage cell recovery (B) and percentage of undivided cells (C) are shown as mean values from 3 independent donors.
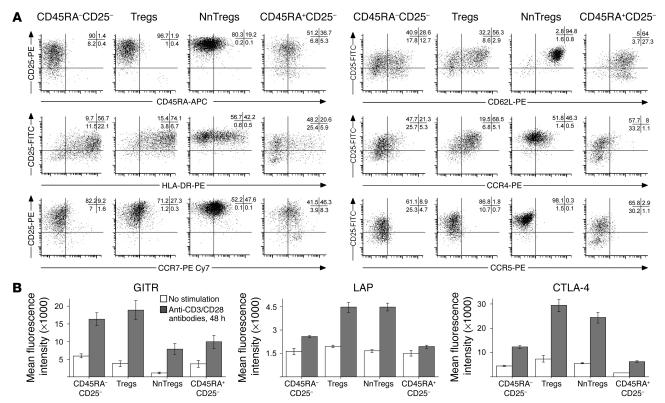
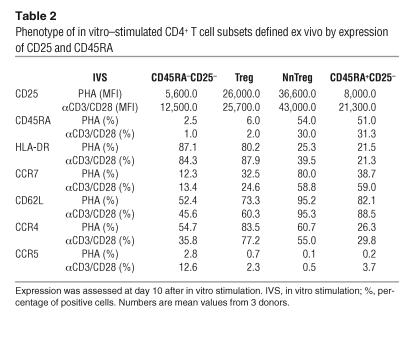
The phenotypic characteristics of in vitro–stimulated NnTregs as compared with cells in other CD4+ T cell subsets were assessed at day 10 after in vitro stimulation with PHA or anti-CD3/CD28 antibodies in the presence of IL-2 (100 IU/ml). Following in vitro stimulation, all populations showed significant expression of CD25 (Figure 6A and Table 2). CD25 expression levels, however, remained significantly higher for Tregs and NnTregs as compared with both naive and antigen-experienced CD25– T cell populations. In addition, in contrast to ex vivo relative expression levels, CD25 expression levels in stimulated populations were higher in NnTregs than in Tregs. The proportion of HLA-DR–expressing cells was increased in all subsets following stimulation but remained relatively low in NnTregs, close to that found in stimulated cells from the naive CD25– fraction and much lower than that found in both Tregs and antigen-experienced CD25– stimulated populations. Similarly to naive CD25– T cells, a relatively high proportion of NnTregs downregulated CD45RA, particularly after stimulation with anti-CD3/CD28 antibodies. However, a proportion of NnTregs maintained the expression of CCR7, particularly after stimulation with PHA. In addition, most NnTregs maintained expression of CD62L. Stimulated Treg populations contained a higher proportion of CCR4-expressing cells as compared with antigen-experienced CD25– T cell populations. In addition, and remarkably, a much higher proportion of NnTregs expressed CCR4 as compared with other naive CD4+ T cells. In contrast, expression of CCR5 was slightly decreased in NnTreg and Treg populations as compared with the corresponding naive and antigen-experienced CD25– T cell populations. Expression of CTLA-4, TGF-β1 LAP, and GITR was assessed in day 10 poststimulation cultures either in the resting state or 48 hours following restimulation with anti-CD3/CD28 antibodies (Figure 6B). Interestingly, in resting populations, expression of GITR was lower in both Tregs and NnTregs as compared with their counterpart CD25– populations, whereas that of LAP was moderately increased, as was that of CTLA-4. However, following restimulation, the expression of these molecules was upregulated in all populations and particularly in Tregs and NnTregs.
Figure 6.
Phenotype of CD4+ T cell subsets following in vitro expansion. Sorted CD4+ T cell populations were stimulated with PHA or with anti-CD3/CD28 antibodies in the presence of allogeneic irradiated feeder cells and IL-2 (100 IU/ml). Ten days after stimulation, aliquots of the different cultures were labeled with the indicated antibodies and assessed using a FACSAria cell sorter. Data analysis was performed using FACSDiva software. (A) Example of data obtained from 1 donor following stimulation with anti-CD3/CD28 antibodies. Data obtained from 3 donors are summarized in Table 2. (B) Expression of GITR, TGF-β1 LAP, and CTLA-4 was assessed 48 hours later in cultures that had undergone or not undergone restimulation with anti-CD3/CD28 antibodies. Numbers are the mean of fluorescence intensity values obtained from 3 donors.
Table 2.
Phenotype of in vitro–stimulated CD4+ T cell subsets defined ex vivo by expression of CD25 and CD45RA
We assessed the growing capacity of day 10 poststimulation cultures following further stimulation with anti-CD3/CD28 antibodies in the absence of IL-2. The results of these experiments, illustrated in Figure 7A, revealed that, consistent with their ex vivo anergic state, Tregs and NnTregs remained relatively refractory to TCR-mediated stimulation and proliferated significantly less as compared with T cell lines derived from the CD25– subsets. Following stimulation with PMA/ionomycin, lines derived from Tregs produced IFN-γ, although at lower levels than lines derived from antigen-experienced CD25– T cells. Lines derived from naive CD25– T cells produced low levels of IFN-γ, and NnTreg-derived lines did not produce any detectable IFN-γ (Figure 7B). As expected, lines derived from naive CD25– T cells produced higher levels of IL-2 as compared with lines derived from antigen-experienced CD25– T cells. Treg-derived lines produced lower amounts of IL-2 as compared with both naive and antigen-experienced CD25– derived lines, and NnTreg-derived lines produced very little IL-2. At variance with the data obtained ex vivo, production of both IL-4 and IL-10 by day 10 poststimulation cultures was clearly detectable. Both antigen-experienced CD25– T cells and, to a lesser extent, Treg-derived lines produced high levels of IL-4, whereas lines derived from naive CD25– T cells produced lower but significant levels of IL-4 and NnTreg-derived lines produced very little IL-4. Production of IL-10 was significantly higher for Treg-derived lines as compared with lines derived from antigen-experienced CD25– T cells, undetectable in lines derived from naive CD25– T cells, and relatively low for NnTreg-derived lines. Production of TGF-β1 was below the limit of detection for all populations under these test conditions. Assessment of suppressive capacity of day 10 poststimulation cultures revealed a higher suppressive activity for NnTregs as compared with Tregs (Figure 7C).
Figure 7.
Functional assessment of CD4+ T cell subsets following in vitro expansion. CD4+ T cell populations were stimulated with PHA or with anti-CD3/CD28 antibodies in the presence of allogeneic irradiated feeder cells and IL-2 (100 IU/ml). Cultures were assessed functionally 10 days after stimulation. (A) Aliquots of the cultures were labeled with CFSE and restimulated with anti-CD3/CD28 antibodies in the presence of APCs. Cell growth was evaluated at day 5 after stimulation. Percentage of undivided cells in the restimulated cultures along with the mean division cycles in the different populations are shown as mean values from 3 donors. (B) Cytokine production by in vitro–expanded populations was assessed 10 days after stimulation by measurement of their concentration in the culture supernatants 24 hours after stimulation with PMA/ionomycin. Results are shown as mean values from 3 donors. (C) Suppressor functions of CD4+CD25+ Treg populations expanded in vitro during 10 days in the presence of IL-2 were evaluated as detailed in Figure 4. Results are shown as mean values from 3 independent donors.
Reactivity of NnTregs and other CD4+ T cell subsets to autologous APCs.
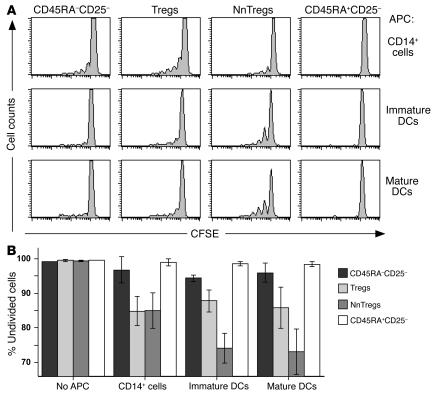
Information about the antigen specificity of naturally occurring Tregs is scarce. The current paradigm, mostly based on data obtained in TCR transgenic mice models, is that naturally occurring Tregs develop in the thymus due to TCR interactions with cognate self-peptide/MHC class II complexes within a restricted avidity range between positive and negative selection (21). Interestingly, a recent study by Romagnoli et al. (22) has demonstrated the presence, among murine Tregs, of precursors that can proliferate upon stimulation with autologous APCs. To gain initial insight into the antigen specificity of T cells in the NnTreg subset, we stimulated ex vivo–sorted and CFSE-labeled CD4+ T cells from the 4 previously defined subsets with autologous APCs, including monocytes and immature and mature DCs in the presence of IL-2. Cell growth was measured at day 7 after stimulation. As illustrated in Figure 8, no significant proliferation was observed in the absence of APCs for any subset. However, a small proportion of cells in the antigen-experienced CD25– T cell compartment and an increased proportion of cells among Tregs proliferated upon coculture with autologous monocytes. Similar results were obtained for these populations upon stimulation with both immature and mature DCs. No significant proliferation was detectable in the case of CD25– naive T cells upon culture with any of the APC populations. In sharp contrast, a high proportion of NnTregs proliferated in response to stimulation with autologous APCs, particularly in the case of both immature and mature DCs. Together these data demonstrate that, in the presence of IL-2, NnTreg populations react and proliferate in response to autologous APCs, indicating that this newly identified subset of circulating naive Tregs is highly enriched in T cells bearing self-reactive TCRs.
Figure 8.
Reactivity of NnTregs and other CD4+ T cell subsets to autologous APCs. Ex vivo–sorted CD4+ T cell subsets were labeled with CFSE and stimulated with the indicated autologous APCs and IL-2 (100 IU/ml). Cell division was measured at day 7. (A) Example of data obtained from 1 donor. (B) Percentages of undivided cells are shown as mean values from 3 donors.
Discussion
We report here the identification of a novel subset of Tregs in adult peripheral blood. The newly described population, which we defined as NnTregs, exhibits most naive T cell characteristics, including a relatively high proliferative potential. NnTregs are clearly identified as composed by naive cells based on their phenotypic characteristics (CD45RA+/RO–, CD62L+, CCR7+) as well as their telomere length and TREC content similar to those of naive CD25– T cells. However, NnTregs are distinguishable from other naive CD4+ T cells based on their expression of CTLA-4 and FOXP3, which are also expressed by antigen-experienced Tregs, but not by other subsets of circulating CD4+ T cells ex vivo. CTLA-4 is an inhibitory receptor expressed by T lymphocytes that acts largely as a negative regulator of T cell responses. Mice deficient in CTLA-4 develop a lymphoproliferative disorder characterized by multiorgan lymphocytic infiltration (23). Antibody-mediated blockade of CTLA-4 in vivo upregulates the strength of the immune response (24, 25) and can reverse Treg-mediated suppression (26, 27). The FOXP3 gene encodes scurfin, a repressor of transcription that regulates T cell activation (28). FOXP3 is considered the master control gene for the development and function of natural Tregs. Mice carrying an X-linked mutation of FOXP3 (scurfy) display multiorgan autoimmune disease similar to that of CTLA-4–deficient mice and lack Tregs (29, 30). Naturally occurring CD4+ Tregs acquire CD25 expression in the thymus and are the only lymphocyte subpopulation that expresses CTLA-4 and FOXP3 constitutively. At least a fraction of CD4+CD25– T cells, however, can acquire CTLA-4 and FOXP3 expression following TCR stimulation (2). Therefore, expression of these molecules alone, at least in the antigen-experienced T cell fraction, does not allow the distinction of Tregs from conventional activated CD4+ T cells. Ex vivo expression of CTLA-4 and FOXP3 by a subset of naive lymphocytes (the identified NnTregs) in the blood of adults at levels similar to those expressed in Tregs strongly indicates that these cells derive from CD4+CD25-expressing thymocytes. In humans, about 10% of CD4+CD8– thymocytes express CD25. Most of these are CD45RA+/RO– and CD62L+ cells (31). Similarly, CD25+ T cells are found in human cord blood in proportions that inversely correlate with gestational stage (from 10% of total CD4+ T cells in pre-term to 7% in full-term cord blood) (32). CD4+CD45RA+/RO– T cells account for the majority (> 90%) of the total CD4+CD25+ T cells in full-term cord blood. Taking this into account, it is somewhat surprising that CD4+CD25+ T cells in adult peripheral blood have been consistently defined as belonging to the memory T cell compartment, having a relatively poor proliferative potential, and being prone to apoptosis (14–17). The most likely explanation for this discrepancy is that, prior to this study, the analysis of human circulating CD4+ Tregs has mostly focused on the expression levels of CD25. Based on data indicating that the suppressor activity was enriched in the CD4+ T cell fraction expressing the highest levels of CD25 (CD4+CD25high, contained in the CD45RA–/RO+ antigen-experienced population) (18), most studies have exclusively concentrated on this population.
We consistently identified NnTregs among circulating lymphocytes of adults. Their proportion, however, was significantly lower than that found in both thymus and cord blood and, on average, similar to that of circulating Tregs. The subset is prominent in young adults and decreases with age, concomitantly with the general decrease of the total naive CD4+ T cell fraction. Although the percentage of NnTregs in children could not be assessed in this study, one would expect, under physiological conditions, a rather constant decrease with age, from the proportion found in full-term cord blood to those found in young adults. No significant correlation between the proportion of Tregs and the age of the donors was found.
NnTregs expressed ex vivo CD25 levels that were, on average, 15-fold higher than those of other naive CD4+ T cells. Similar to these, they did not express HLA-DR, which was expressed by a significant fraction of Tregs. Together these findings support the concept that NnTregs represent a pure population of naive naturally occurring Tregs whereas Tregs are most likely composed of a mixture of NnTreg-derived antigen-experienced Tregs, activated CD4+ T cells, and, possibly, other regulatory subsets derived from the CD4+CD25– population (33).
Homing receptors, chemokines, and chemokine receptors play a major role in determining the migratory pathways of different subsets of T cells and their interactions with other cells. CD62L and CCR7 are expressed by naive cells and some of the memory T cells and mediate lymphocyte homing to secondary lymphoid organs (34). Previous studies, in agreement with our data, have shown that these molecules are also expressed by a large fraction of Tregs. In a mouse model of diabetes, only CD62L/CCR7-expressing Tregs migrated to pancreatic lymph nodes following adoptive transfer and delayed the onset of the disease (35). Expression of chemokine receptors has also been reported in Tregs and could play an important role in determining both their trafficking properties and their interactions with APCs (36, 37). Regarding expression of these molecules, NnTregs showed an ex vivo expression pattern similar to that of other naive CD4+ T cells and distinct from both CD25– and CD25+ antigen-experienced CD4+ T cells. Interestingly, expression of CCR4 was found in a detectable fraction (about 5%) of NnTregs ex vivo as well as in a large proportion of in vitro–expanded NnTregs (up to 60%). Mature dendritic cells migrating to lymph nodes secrete macrophage-derived chemokine (MDC/CCL22), attracting recently activated T cells, which upregulate expression of CCR4 (38). Thus, expression of CCR4 in NnTregs speaks in favor of an increased capacity of those cells to interact with self APCs.
The naive phenotype of NnTregs prompted us to assess their functional characteristics and proliferative potential in comparison with those of the previously defined Tregs. The results of this analysis demonstrated that cells in this population, similar to the previously defined antigen-experienced Tregs, are anergic and endowed with ex vivo suppressor functions. These results are consistent with previous findings that both CD4+CD25+ thymocytes and cord blood cells exert suppressor activity (39, 40). As previously documented for Tregs, NnTregs exert their suppressor activity through a mechanism that requires cell-cell contact. The exact molecular mechanisms mediating the suppressor functions of naturally occurring Tregs, particularly in vivo, have not been completely elucidated yet (41). Although evidence of the involvement of several molecules, including CTLA-4, GITR, TGF-β1, and others, have been previously obtained, recent studies have shown that, at least in the case of human Tregs, blocking monoclonal antibodies directed against these molecules have minimal impact on suppression in vitro (39). The results of these and other studies point toward a complex multifactorial mechanism of action of Tregs involving in vivo colocalization with effector cells and suppressor-mediated short-range effects on effectors and probably on APCs.
Upon TCR-mediated stimulation in the presence of exogenous IL-2, NnTregs displayed an increased proliferative potential, as compared with Tregs, that facilitates their in vitro expansion. The resulting populations strongly upregulated CD25, partially downregulated CD45RA and, to a lower extent, CCR7, but maintained high levels of expression of CD62L, suggesting that they may have the potential of homing to secondary lymphoid organs, following transfer into a recipient. As an initial attempt to investigate the antigen specificity of cells in this newly defined subset, we assessed their reactivity to autologous APCs in the presence of IL-2. In contrast to naive CD4+CD25– T cells, under these conditions, NnTregs vigorously proliferated, particularly upon stimulation with DCs. These data are consistent with the concept that NnTreg populations are composed of T cells bearing self-reactive TCRs and pave the way to the identification of the TCRs’ ligands using NnTreg-derived monoclonal populations.
In summary, our results indicate that NnTregs are derived from CD4+CD25+ T cells selected in the thymus and are the precursors of the naturally occurring antigen-experienced Treg subset contained in the Treg fraction. The phenotypic definition of the NnTreg T cell compartment allows direct isolation, cloning, and functional characterization of naturally occurring Tregs from virtually any individual. This should further our understanding of the T cell specificities contained in this population with respect to other T cell subsets. In addition, and importantly, because of the relatively high proliferative potential of NnTregs, their phenotypic definition will considerably accelerate the development of immunotherapeutic approaches for the treatment of autoimmune diseases or the prevention of posttransplant alloreactions by the adoptive transfer of NnTregs.
Methods
Samples, isolation of mononuclear cells, phenotypic analysis, and cell sorting.
Peripheral blood samples were obtained from the New York Blood Center or from adult healthy donors. Cord blood samples were obtained from Transfusion Medicine at the Columbia University Medical Center. Human products were handled according to the Bloodborne Pathogens Standard enacted by the Occupational Safety and Health Administration. Samples from healthy donors were obtained after informed consent and approval by the Columbia University Institutional Review Board. Mononuclear cells were isolated by density gradient sedimentation using a Ficoll-Hypaque gradient (Amersham Biosciences). For phenotypic analysis and cell sorting, cells were stained with fluorescent-conjugated monoclonoal antibodies specific for surface markers and analyzed by flow cytometry using a FACSAria cell sorter (BD). Data analysis was performed using FACSDiva software version 4.0.1.2 (BD). For the cell sorting experiments, CD4+ T cells were enriched by magnetic cell sorting using the MiniMACS Separator (Miltenyi Biotec) and stained with anti-CD4 (BD), anti-CD8, anti-CD45RA (CALTAG Laboratories), and anti-CD25 (Beckman Coulter). After gating on the CD4+CD8– lymphocytes, cells were separated into 4 subsets on the basis of CD45RA and CD25 expression. Reanalysis of sorted populations routinely showed more than 97% purity. For phenotypical analysis, the following antibodies were used: anti–HLA-DR, anti-CD38, anti-CD31, anti-CD62L, anti-CCR4, anti-CCR5, anti-CCR7 (BD), anti–CTLA-4 (Beckman Coulter), anti–TGF-β1 LAP, and anti-GITR (R&D Systems).
Analysis of FOXP3 expression.
RNA was prepared from ex vivo–sorted T cell subsets (1 × 10⁵ cells) using RNeasy Mini Kit (QIAGEN). cDNA synthesis was performed using Promega Reverse Transcription System A3500 (Promega), and cDNA integrity was tested by amplification of β-actin in a 35-cycle PCR reaction. Semiquantitative FOXP3 mRNA expression was assessed using the following primers: forward primer, 5′-TCACCTACGCCACGGTCAT-3′; and reverse primer, 5′-CACAAAGCACTTGTGCAG-3′. Quantitative real-time PCR was performed with a TaqMan assay on an ABI 7000 system (Applied Biosystems) using Assays-on-Demand Gene Expression probes for FoxP3 (Hs00203958; Applied Biosystems). As a control for input cDNA, we used GAPDH, TaqMan probe, and primers. The probe sequence was as follows: FAM-5′-AAGGTGAAGGTCGGAGTCAACGGATTTG-3′-TAMRA. Primer sequences for GAPDH were as follows: 5′-CCACATCGCTCAGACACCAT-3′; and 5′- CCAGGCGCCCAATACG-3′ (Applied Biosystems).
Assessment of telomere length and quantification of TRECs.
Sorted CD4+ T cell populations were treated using the Telomere PNA Kit (DakoCytomation) according to the manufacturer’s instructions. The number of TRECs was determined by quantitative real-time PCR using the ABI PRISM 7700 system (Applied Biosystems) as described previously (42). Absolute quantitation of TREC numbers was obtained using 10-fold serial dilutions ranging from 1 × 10⁷ to 1 × 101 copies of signal-joint internal standard, kindly provided by Daniel Douek (National Institute of Allergy and Infectious Diseases, Bethesda, Maryland, USA). For TREC analysis, primer and probe sequences were as follows: 5′ primer, CACATCCCTTTCAACCATGCT; 3′ primer, GCCAGCTGCAGGGTTTAGG; and probe, FAM-ACACCTCTGGTTTTTGTAAAGGTGCCCACT-TAMRA. As a control for input DNA, we used the Assays-on-Demand Gene probes for 18S rRNA (Hs99999901_s1; Applied Biosystems).
Assessment of cell growth, cytokine production, and suppression.
To assess the growth potential of T cells in the 4 defined subsets, sorted T cell subsets were labeled with CFSE (5 μM; Invitrogen Corp.) and stimulated with PHA (Sigma-Aldrich; 1 μg/ml) or with anti-CD3 (OKT3; 0.1 μg/ml) and anti-CD28 (CD28.2, 1 μg/ml) (eBiosciences) together with the indicated concentration of IL-2 in the presence of autologous irradiated CD4–CD8– APCs. Cell growth was assessed at day 5 after stimulation. The mean cycles number was calculated as the sum of nfn for n = 0 to _n_max, where n is the cycle number and fn is the fraction of cells which have undergone n divisions. Cytokine production by purified CD4+ T cell subsets was assessed after stimulation with PMA (100 ng/ml; Sigma-Aldrich) and ionomycin (1 μg/ml). The concentration of cytokines in the culture supernatant was measured by ELISA (BioSource International) after 24 hours. The ability of Tregs to suppress the growth of responder CD4+CD25– T cells was assessed by coculture of CFSE-labeled responders (2 × 10⁴ cells/well) with suppressors (NnTregs or Tregs, at the indicated suppressor to responder cell ratio [Figures 4C and 7C]), in 96-well U-bottom plates in the presence of 2 × 10⁴ cells/well irradiated autologous CD4–CD8– APCs and PHA (1 μg/ml; Sigma-Aldrich). The growth (percentage of undivided cells subtracted from 100) in the wells with suppressor cells (experimental group) was compared with that in the wells without suppressors (control group). The percentage of growth was determined at day 5 after stimulation as follows: (growth of experimental group/growth of control) × 100.
Acknowledgments
We thank H. Kaplan (Transfusion Medicine at Columbia University Medical Center) for providing cord blood samples. M. Ayyoub and D. Valmori are supported by the Ludwig Institute for Cancer Research and the Cancer Research Institute.
Footnotes
Nonstandard abbreviations used: CFSE, 5- and 6-carboxyfluorescein diacetate succinimidyl ester; CTLA-4, CTL-associated protein 4; FOXP3, forkhead box P3; GITR, glucocorticoid-induced TNF receptor; LAP, latency-associated peptide; NnTreg, natural naive Treg; PHA, phytohemagglutinin; TREC, T cell receptor excision circle.
Conflict of interest: The authors have declared that no conflict of interest exists.
References
- 1.Jameson SC, Bevan MJ. T-cell selection. Curr. Opin. Immunol. 1998;10:214–219. doi: 10.1016/s0952-7915(98)80251-3. [DOI] [PubMed] [Google Scholar]
- 2.Walker MR, et al. Induction of FoxP3 and acquisition of T regulatory activity by stimulated human CD4+CD25– T cells. J. Clin. Invest. 2003;112:1437–1443. doi:10.1172/JCI200319441. doi: 10.1172/JCI19441. [DOI] [PMC free article] [PubMed] [Google Scholar]
- 3.Piccirillo CA, Thornton AM. Cornerstone of peripheral tolerance: naturally occurring CD4+CD25+ regulatory T cells [review] Trends Immunol. 2004;25:374–380. doi: 10.1016/j.it.2004.04.009. [DOI] [PubMed] [Google Scholar]
- 4.Annacker O, Pimenta-Araujo R, Burlen-Defranoux O, Bandeira A. On the ontogeny and physiology of regulatory T cells. Immunol. Rev. 2001;182:5–17. doi: 10.1034/j.1600-065x.2001.1820101.x. [DOI] [PubMed] [Google Scholar]
- 5.Jordan MS, et al. Thymic selection of CD4+CD25+ regulatory T cells induced by an agonist self-peptide. Nat. Immunol. 2001;2:301–306. doi: 10.1038/86302. [DOI] [PubMed] [Google Scholar]
- 6.Bach JF. Regulatory T cells under scrutiny. Nat. Rev. Immunol. 2003;3:189–198. doi: 10.1038/nri1026. [DOI] [PubMed] [Google Scholar]
- 7.Roncarolo MG, Levings MK. The role of different subsets of T regulatory cells in controlling autoimmunity. Curr. Opin. Immunol. 2000;12:676–683. doi: 10.1016/s0952-7915(00)00162-x. [DOI] [PubMed] [Google Scholar]
- 8.Weiner HL. The mucosal milieu creates tolerogenic dendritic cells and T(R)1 and T(H)3 regulatory cells. Nat. Immunol. 2001;2:671–672. doi: 10.1038/90604. [DOI] [PubMed] [Google Scholar]
- 9.Sakaguchi S, Sakaguchi N, Asano M, Itoh M, Toda M. Immunologic self-tolerance maintained by activated T cells expressing IL-2 receptor alpha-chains (CD25). Breakdown of a single mechanism of self-tolerance causes various autoimmune diseases. J. Immunol. 1995;155:1151–1164. [PubMed] [Google Scholar]
- 10.Murakami M, Sakamoto A, Bender J, Kappler J, Marrack P. CD25+CD4+ T cells contribute to the control of memory CD8+ T cells. Proc. Natl. Acad. Sci. U. S. A. 2002;99:8832–8837. doi: 10.1073/pnas.132254399. [DOI] [PMC free article] [PubMed] [Google Scholar]
- 11.Cohen JL, Trenado A, Vasey D, Klatzmann D, Salomon BL. CD4(+)CD25(+) immunoregulatory T cells: new therapeutics for graft-versus-host disease. J. Exp. Med. 2002;196:401–406. doi: 10.1084/jem.20020090. [DOI] [PMC free article] [PubMed] [Google Scholar]
- 12.Belkaid Y, Piccirillo CA, Mendez S, Shevach EM, Sacks DL. CD4+CD25+ regulatory T cells control Leishmania major persistence and immunity. Nature. 2002;420:502–507. doi: 10.1038/nature01152. [DOI] [PubMed] [Google Scholar]
- 13.Onizuka S, et al. Tumor rejection by in vivo administration of anti-CD25 (interleukin-2 receptor alpha) monoclonal antibody. Cancer Res. 1999;59:3128–3133. [PubMed] [Google Scholar]
- 14.Annacker O, et al. CD25+ CD4+ T cells regulate the expansion of peripheral CD4 T cells through the production of IL-10. J. Immunol. 2001;166:3008–3018. doi: 10.4049/jimmunol.166.5.3008. [DOI] [PubMed] [Google Scholar]
- 15.Taams LS, et al. Human anergic/suppressive CD4(+)CD25(+) T cells: a highly differentiated and apoptosis-prone population. Eur. J. Immunol. 2001;31:1122–1131. doi: 10.1002/1521-4141(200104)31:4<1122::aid-immu1122>3.0.co;2-p. [DOI] [PubMed] [Google Scholar]
- 16.Thornton AM, Shevach EM. CD4+CD25+ immunoregulatory T cells suppress polyclonal T cell activation in vitro by inhibiting interleukin 2 production. J. Exp. Med. 1998;188:287–296. doi: 10.1084/jem.188.2.287. [DOI] [PMC free article] [PubMed] [Google Scholar]
- 17.Thornton AM, Shevach EM. Suppressor effector function of CD4+CD25+ immunoregulatory T cells is antigen nonspecific. J. Immunol. 2000;164:183–190. doi: 10.4049/jimmunol.164.1.183. [DOI] [PubMed] [Google Scholar]
- 18.Baecher-Allan C, Brown JA, Freeman GJ, Hafler DA. CD4+CD25high regulatory cells in human peripheral blood. J. Immunol. 2001;167:1245–1253. doi: 10.4049/jimmunol.167.3.1245. [DOI] [PubMed] [Google Scholar]
- 19.Michie CA, McLean AR, Alcock C, Beverley PCL. Lifespan of human lymphocyte subsets defined by CD45 isoforms. Nature. 1992;360:264–265. doi: 10.1038/360264a0. [DOI] [PubMed] [Google Scholar]
- 20.Nakamura K, et al. TGF-beta 1 plays an important role in the mechanism of CD4+CD25+ regulatory T cell activity in both humans and mice. J. Immunol. 2004;172:834–842. doi: 10.4049/jimmunol.172.2.834. [DOI] [PubMed] [Google Scholar]
- 21.Schwartz RH. Natural regulatory T cells and self-tolerance. Nat. Immunol. 2005;6:327–330. doi: 10.1038/ni1184. [DOI] [PubMed] [Google Scholar]
- 22.Romagnoli P, Hudrisier D, van Meerwijk JP. Preferential recognition of self antigens despite normal thymic deletion of CD4(+)CD25(+) regulatory T cells. J. Immunol. 2002;168:1644–1648. doi: 10.4049/jimmunol.168.4.1644. [DOI] [PubMed] [Google Scholar]
- 23.Tivol EA, et al. Loss of CTLA-4 leads to massive lymphoproliferation and fatal multiorgan tissue destruction, revealing a critical negative regulatory role of CTLA-4. Immunity. 1995;3:541–547. doi: 10.1016/1074-7613(95)90125-6. [DOI] [PubMed] [Google Scholar]
- 24.Leach DR, Krummel MF, Allison JP. Enhancement of antitumor immunity by CTLA-4 blockade. Science. 1996;271:1734–1736. doi: 10.1126/science.271.5256.1734. [DOI] [PubMed] [Google Scholar]
- 25.Kirman J, et al. CTLA-4 blockade enhances the immune response induced by mycobacterial infection but does not lead to increased protection. Infect. Immun. 1999;67:3786–3792. doi: 10.1128/iai.67.8.3786-3792.1999. [DOI] [PMC free article] [PubMed] [Google Scholar]
- 26.Takahashi T, et al. Immunologic self-tolerance maintained by CD25(+)CD4(+) regulatory T cells constitutively expressing cytotoxic T lymphocyte-associated antigen 4. J. Exp. Med. 2000;192:303–310. doi: 10.1084/jem.192.2.303. [DOI] [PMC free article] [PubMed] [Google Scholar]
- 27.Read S, Malmstrom V, Powrie F. Cytotoxic T lymphocyte-associated antigen 4 plays an essential role in the function of CD25(+)CD4(+) regulatory cells that control intestinal inflammation. J. Exp. Med. 2000;192:295–302. doi: 10.1084/jem.192.2.295. [DOI] [PMC free article] [PubMed] [Google Scholar]
- 28.Schubert LA, Jeffery E, Zhang Y, Ramsdell F, Ziegler SF. Scurfin (FOXP3) acts as a repressor of transcription and regulates T cell activation. J. Biol. Chem. 2001;276:37672–37679. doi: 10.1074/jbc.M104521200. [DOI] [PubMed] [Google Scholar]
- 29.Fontenot JD, Gavin MA, Rudensky AY. Foxp3 programs the development and function of CD4+CD25+ regulatory T cells. Nat. Immunol. 2003;4:330–336. doi: 10.1038/ni904. [DOI] [PubMed] [Google Scholar]
- 30.Khattri R, Cox T, Yasayko SA, Ramsdell F. An essential role for Scurfin in CD4+CD25+ T regulatory cells. Nat. Immunol. 2003;4:337–342. doi: 10.1038/ni909. [DOI] [PubMed] [Google Scholar]
- 31.Wing K, Ekmark A, Karlsson H, Rudin A, Suri-Payer E. Characterization of human CD25+ CD4+ T cells in thymus, cord and adult blood. Immunology. 2002;106:190–199. doi: 10.1046/j.1365-2567.2002.01412.x. [DOI] [PMC free article] [PubMed] [Google Scholar]
- 32.Takahata Y, et al. CD25+CD4+ T cells in human cord blood: an immunoregulatory subset with naive phenotype and specific expression of forkhead box p3 (Foxp3) gene. Exp. Hematol. 2004;32:622–629. doi: 10.1016/j.exphem.2004.03.012. [DOI] [PubMed] [Google Scholar]
- 33.Zheng SG, Wang JH, Gray JD, Soucier H, Horwitz DA. Natural and induced CD4+CD25+ cells educate CD4+CD25- cells to develop suppressive activity: the role of IL-2, TGF-beta, and IL-10. J. Immunol. 2004;172:5213–5221. doi: 10.4049/jimmunol.172.9.5213. [DOI] [PubMed] [Google Scholar]
- 34.Sallusto F, Lenig D, Forster R, Lipp M, Lanzavecchia A. Two subsets of memory T lymphocytes with distinct homing potentials and effector functions. Nature. 1999;401:708–712. doi: 10.1038/44385. [DOI] [PubMed] [Google Scholar]
- 35.Szanya V, Ermann J, Taylor C, Holness C, Fathman CG. The subpopulation of CD4+CD25+ splenocytes that delays adoptive transfer of diabetes expresses L-selectin and high levels of CCR7. J. Immunol. 2002;169:2461–2465. doi: 10.4049/jimmunol.169.5.2461. [DOI] [PubMed] [Google Scholar]
- 36.Iellem A, et al. Unique chemotactic response profile and specific expression of chemokine receptors CCR4 and CCR8 by CD4(+)CD25(+) regulatory T cells. J. Exp. Med. 2001;194:847–853. doi: 10.1084/jem.194.6.847. [DOI] [PMC free article] [PubMed] [Google Scholar]
- 37.D’Ambrosio D, Sinigaglia F, Adorini L. Special attractions for suppressor T cells. Trends Immunol. 2003;24:122–126. doi: 10.1016/s1471-4906(03)00027-9. [DOI] [PubMed] [Google Scholar]
- 38.Cyster JG. Leukocyte migration: scent of the T zone [review] Curr. Biol. 2000;10:R30–R33. doi: 10.1016/s0960-9822(99)00253-5. [DOI] [PubMed] [Google Scholar]
- 39.Godfrey WR, et al. Cord blood CD4(+)CD25(+)-derived T regulatory cell lines express FoxP3 protein and manifest potent suppressor function. Blood. 2005;105:750–758. doi: 10.1182/blood-2004-06-2467. [DOI] [PubMed] [Google Scholar]
- 40.Stephens LA, Mottet C, Mason D, Powrie F. Human CD4(+)CD25(+) thymocytes and peripheral T cells have immune suppressive activity in vitro. Eur. J. Immunol. 2001;31:1247–1254. doi: 10.1002/1521-4141(200104)31:4<1247::aid-immu1247>3.0.co;2-m. [DOI] [PubMed] [Google Scholar]
- 41.von Boehmer H. Mechanisms of suppression by suppressor T cells. Nat. Immunol. 2005;6:338–344. doi: 10.1038/ni1180. [DOI] [PubMed] [Google Scholar]
- 42.Douek DC, et al. Changes in thymic function with age and during the treatment of HIV infection. Nature. 1998;396:690–695. doi: 10.1038/25374. [DOI] [PubMed] [Google Scholar]
