Genetical Genomics Analysis of a Yeast Segregant Population for Transcription Network Inference (original) (raw)
Abstract
Genetic analysis of gene expression in a segregating population, which is expression profiled and genotyped at DNA markers throughout the genome, can reveal regulatory networks of polymorphic genes. We propose an analysis strategy with several steps: (1) genome-wide QTL analysis of all expression profiles to identify eQTL confidence regions, followed by fine mapping of identified eQTL; (2) identification of regulatory candidate genes in each eQTL region; (3) correlation analysis of the expression profiles of the candidates in any eQTL region with the gene affected by the eQTL to reduce the number of candidates; (4) drawing directional links from retained regulatory candidate genes to genes affected by the eQTL and joining links to form networks; and (5) statistical validation and refinement of the inferred network structure. Here, we apply an initial implementation of this strategy to a segregating yeast population. In 65, 7, and 28% of the identified eQTL regions, a single candidate regulatory gene, no gene, or more than one gene was retained in step 3, respectively. Overall, 768 putative regulatory links were retained, 331 of which are the strongest candidate links, as they were retained in the expression correlation analysis and were located within or near an eQTL subregion identified by a multimarker analysis separating multiple linked QTL. One or several biological processes were statistically significantly overrepresented in independent network structures or in highly interconnected subnetworks. Most of the transcription factors found in the inferred network had a putative regulatory link to only one other gene or exhibited _cis_-regulation.
THE identification of individual genes and gene networks underlying complex traits is a fundamental aim of genetics. Quantitative trait locus (QTL) mapping is a method that identifies genomic regions associated with a phenotype of interest (Korstanje and Paigen 2002). Large-scale gene expression data acquired from microarray experiments (Schena et al. 1995; Lockhart et al. 1996) provide information about regulatory relationships between genes. Most approaches to transcription network inference rely on expression profiling alone, and these microarray experiments are either based on external environmental perturbations (Causton et al. 2001) or single-gene perturbations in the otherwise same, homogeneous genetic background (Ideker et al. 2001). Recently, a strategy to infer genetic networks from multifactorial genetic perturbations was proposed and named “genetical genomics” (Jansen and Nap 2001). This method combines QTL mapping and expression profiling via joint analysis of genotype and expression data in a segregating population. The expression profile of each gene is treated as a quantitative trait (QT), which is potentially affected by multiple QTL [so-called expression QTL (eQTL)].
QTL analysis of gene expression profiles identifies genomic regions, which are likely to contain at least one causal gene with regulatory effect on the gene, whose expression profile is affected by the eQTL. If the causal gene underlying a QTL affecting the expression profile of another gene is identified, then a directed link from the causal gene to the expression profiled gene could be established to indicate a regulatory relationship. By joining all identified links, genetic networks are constructed. This task is difficult, however, because QTL regions are generally large (up to several centimorgans), and hence each region may contain several to many putative causal genes. Functional validation of many candidate causal genes is not feasible, and hence computational methods are needed to reduce the number of candidate genes in each QTL region. This reduction can be achieved in two steps, first by reducing the lengths of the initial QTL regions by using existing fine-mapping techniques (e.g., multiple-QTL mapping, linkage disequilibrium mapping, and additional genotyping of loci and individuals in regions of interest) and second by applying correlation analysis, as proposed here, to the expression profiles of the candidate genes in an eQTL region and the gene affected by this eQTL. A substantial reduction in the number of causal genes will then allow us to propose a finite set of candidate genetic networks immediately or to perform a small and feasible number of validation studies prior to network inference.
Our proposed correlation analysis of the expression profiles of the candidate genes in an eQTL region and the gene affected by the QTL rests on the assumption that genes belonging to the same pathway or network tend to have strong correlations between their expression values. This assumption has been used extensively in cluster analysis (Eisen et al. 1998) and construction of coexpression gene networks (Stuart et al. 2003). Correlation analysis of all expression-profiled genes in a microarray experiment (e.g., Stuart et al. 2003), without QTL analysis, may produce many spurious associations or may miss many associations under strict control of type I error or false discovery rates. However, after QTL analysis has identified eQTL regions for the expression profiles, significant expression correlation of candidate gene(s) in a QTL region with the gene affected by the QTL should tend to indicate real functional relationships. We note that correlation among gene expression profiles does not reflect all of the functional relationships among genes. A genetic variant in the protein-coding region of a gene may not affect this gene's expression, but the variant may change the expression levels of other genes. As with other current approaches, we can only partially reconstruct a regulatory network.
We applied our approach to data from a yeast study (Brem et al. 2002), which is the first, large-scale experiment on genetic dissection of genome-wide expression profiling. The authors performed QTL mapping by nonparametric marker analysis of expression profiles in 40 haplotypes from a cross between a laboratory strain and a wild strain of yeast. The expression profiles of 570 genes were found to be affected by at least one significant QTL (the authors retained only the single, most significant eQTL for each profile). For 32% of the 570 genes with an identified eQTL region, their own genome location was within the QTL region, indicating _cis_-regulation. Moreover, eight _trans_-acting loci were found to affect the expression of groups of genes with 7 to 94 members representing genes of related function (Brem et al. 2002).
This experiment (Brem et al. 2002) was very successful in identifying QTL regions for gene expression profiles; however, the authors did not attempt to reconstruct genetic networks via identification of candidate causal genes within QTL regions. An extended study of the yeast experiment identified two genes responsible for the _trans_-acting loci via positional cloning and functional analysis (Yvert et al. 2003). Here, we reanalyzed the data from the first yeast study (Brem et al. 2002). We performed QTL mapping, but in contrast with the previous analysis (Brem et al. 2002) we allowed for multiple QTL affecting the expression profile of a single gene. We computed confidence intervals for the identified eQTL, determined a set of genes physically located within each eQTL confidence region using the sequenced yeast genome map, and reduced the number of candidate causal genes in each eQTL region by correlation analysis of expression. Directional links were established from the remaining candidate causal gene(s) in each eQTL region to the gene affected by the QTL, and these links were joined for gene network inference.
METHODS
Single-marker analysis of gene expression profiles:
We used the gene expression and genotype data from the 40 Saccharomyces cerevisiae haplotypes (Brem et al. 2002). The data set contains 6215 gene expression values and genotypes at 3312 markers for each haplotype. In the previous analysis of this data set (Brem et al. 2002), a significant QTL was identified for 570 gene expression profiles using nonparametric, single-marker analysis based on the Wilcoxon-Mann-Whitney test and a significance threshold of P < 5 × 10⁻⁵. Only the most significant marker across the entire yeast genome was determined for each of the 570 gene expression profiles. It is certainly possible that there are multiple significant QTL for some of the gene expression profiles. We used the same nonparametric analysis for an initial genome scan and the same _P_-value threshold to detect QTL, but we retained the most significant QTL per chromosome. For the list of all 6215 × 3312 _P_-values, we estimated _Q_-values as described by Storey and Tibshirani (2003), and the highest _Q_-value in the set of _Q_-values corresponding to all tests with the _P_-value below the 5 × 10⁻⁵ threshold was our estimate of the maximum, long-run false discovery rate (FDR). However, the _Q_-value method relies on an assumption of “weak dependence,” which is likely to be violated here, as we are testing not only many expression profiles, but also many genome positions. A related criterion, the proportion of false positives (PFP) (Fernando et al. 2004), does not depend on either the number of tests or the correlation structure among tests. To estimate the PFP, it is necessary to estimate the proportion of true null hypotheses, and several methods are currently available (see Fernando et al. 2004). Here we use the estimate of the proportion of true null hypotheses that is obtained with the resampling method in the _Q_-value algorithm. The estimate of PFP is calculated as PFP(α) = α × N × π/R(α), where α is the comparisonwise type I error rate, N is the total number of tests, π is the estimated proportion of true null hypotheses, and R(α) is the total number of rejected null hypotheses at level α.
Identification of QTL confidence intervals and lists of candidate genes:
A confidence interval (C.I.) was computed for each retained, significant eQTL via a bootstrap resampling method (Visscher et al. 1996). Bootstrap samples were created by sampling, with replacement, the set of expression values together with the set of marker genotypes of any of the 40 haplotypes. Marker analysis was performed on each of 1000 bootstrap data sets. For each chromosome with a significant QTL affecting a given expression profile in the original data set, the QTL position with the highest test statistic was retained for each of the 1000 bootstrap samples. The 95% C.I. of the QTL position was then determined by taking the largest and smallest value of the bottom and top 2.5%, respectively, of the ordered 1000 QTL positions.
This bootstrap procedure tends to be conservative and produce relatively large C.I.s, especially when the QTL effect is small (Dupuis and Siegmund 1999). Selective bootstrap resampling has been advocated to reduce the length of the confidence interval (Lebreton et al. 1998). Because it is not clear what selection criterion should be used, we applied two selection strategies, which retained only those bootstrap samples whose most highly significant QTL on a given chromosome achieved a _P_-value ≤0.001 and 0.00005, respectively.
For each identified eQTL region, a list of genes physically located in the C.I. was formed using the yeast physical genome map (Goffeau et al. 1996). One or several of these genes may have causal, regulatory effects on the expression level of the gene affected by the QTL. Below we describe two strategies to reduce the number of causal candidate genes in the gene list of each eQTL.
Multimarker analysis of gene expression profiles:
Unnecessarily large QTL confidence intervals can also result from the presence of multiple QTL in the same chromosome affecting the same expression profile. We therefore reanalyzed the identified eQTL regions with a simple method capable of resolving multiple linked QTL as described previously (Thaller and Hoeschele 2000). We performed sliding three-marker regression, where a marker (i) is fit together with its flanking markers (i − 1, i + 1). Significant effect on expression is tested only for the intermediate marker, whose partial regression coefficient has a nonzero expected value if and only if at least one QTL is located between markers i − 1 and i or between i + 1 and i (Zeng 1993). Markers i − 1 and i + 1 were chosen such that they did not perfectly cosegregate with the marker they flanked. This analysis is performed consecutively for each marker in the QTL region of interest. If there is a single QTL in the confidence interval, only the two markers flanking the QTL have a nonzero expected partial correlation value in their respective three-marker analyses. Therefore, a single pair of consecutive markers with a nonzero, significant partial regression coefficient in a QTL region would indicate a single QTL, while more than one such pair of markers would indicate several QTL. Pairs of markers with large, significant partial regression coefficients, separated by nonsignificant markers, would indicate several QTL separated by at least one empty marker interval in between.
In this study, for each QTL confidence region previously identified, we determined the pair of consecutive markers with the largest _t_-statistics associated with their partial regression coefficients. We also determined all pairs of consecutive markers with significant (at the 0.05 level) partial regression coefficients and with pairs separated by nonsignificant markers in each QTL region. We then determined which of the candidate causal genes in any QTL region were located within the subregions flanked by the significant marker pairs. If a candidate gene was found to be located in a subregion, then this gene was identified as a strong causal candidate.
Identification of candidate genes via expression correlation tests:
For each gene included in the gene list of any eQTL confidence interval, the Spearman correlation coefficient (appendix A) between the expression profile of this gene and the profile of the gene affected by the eQTL was computed. The value of each correlation coefficient was tested for significant departure from zero via a _t_-test (appendix B). The _P_-value threshold was Bonferroni adjusted as 0.05/n, where n is the number of genes in each confidence interval. The gene with the most significant correlation coefficient was identified (say gene G1) and first-order partial correlation coefficients (appendix C) were computed between each of the other genes and the gene affected by the eQTL, conditional on G1. The _P_-value threshold for the first-order partial correlations was Bonferroni adjusted as 0.05/(n − 1), where n − 1 is the number of first-order partial correlation coefficients tested. If at least one of these correlations was significant, then the most significant gene was retained (say gene G2) and the process was continued by computing second-order partial correlations conditional on G1 and G2, etc. In this way, a single candidate regulatory gene (G1) was retained for each eQTL, or in some cases several causal candidate genes (G1, G2, …) were retained.
Construction of the network:
For any eQTL confidence interval, where the list of candidate genes was reduced to one or few members as described above, a directional link was drawn from each of these retained candidate genes to the gene whose expression profile was affected by the QTL. The genetic network was constructed by combining all links. The network structure was displayed using the network drawing software Cytoscape (Shannon et al. 2003), where a node represents a gene, and a directional arrow represents a putative regulatory relationship. Positive Spearman correlation values were plotted in red and negative correlations in blue. If the candidate gene was located within a 1-kb region of a subinterval (identified by sliding three-marker regression as described), the link was plotted darker than those links where the candidate gene did not colocalize with a subinterval. Selected yeast gene ontology (GO) (Ashburner et al. 2000) terms were color plotted on the nodes. The GO biological process terms were mostly manually picked with the help of “GO term finder” (http://genome-www4.stanford.edu/cgi-bin/SGD/GO/goTermFinder), with the aim of finding common GO terms within subnetworks and different GO terms across subnetworks. Some genes were involved in more than one selected GO term. In that case, a randomly selected GO term was color plotted. Genes with an unknown biological process term were plotted gray. Gene transcription factors (as defined in yeast gene ontology) were identified in the inferred network and plotted as squared nodes.
RESULTS
In addition to the previously identified detected 570 QTL (Brem et al. 2002), an additional 11 QTL were detected at the P < 5 × 10⁻⁵ level using single-marker analysis based on the Wilcoxon-Mann-Whitney test and by retaining the most significant QTL per chromosome rather than in the entire genome. Using the _Q_-value algorithm of Storey and Tibshirani (2003), we obtained an estimate of the overall proportion of true null hypotheses among all 6215 × 3312 tests, which was equal to 0.92. In the set of all tests with P < 5 × 10⁻⁵, the largest _Q_-value was 0.1171, which is the estimate of the maximum, long-run FDR. We then estimated the PFP (Fernando et al. 2004) at the P < 5 × 10⁻⁵ level. The estimated proportion of true null hypotheses, obtained with the resampling method of the _Q_-value algorithm, was 0.92. We used this number, together with the total number of tests equal to 6215 × 3312, and with the total number of rejected null hypotheses at level P < 5 × 10⁻⁵ equal to 8072, in the estimation equation for the PFP. The resulting estimate of the PFP was 0.1173, which is very similar to the _Q_-value-based FDR estimate. FDR, positive FDR, and PFP (Storey and Tibshirani 2003; Fernando et al. 2004) are expected to give very similar results under weak dependence. However, we believe that further research that investigates this assumption and assesses, probably by using simulated data, the accuracy of various FDR and PFP estimates is required for the case, where the set of test statistics represents both genome-wide marker typing and expression profiling. On the basis of our current estimates of PFP and FDR, we expect that at most 68 of the 581 detected QTL are false positive findings.
The genomic locations of DNA markers were plotted against the genome locations of those genes whose expression profiles they significantly affect (Figure 1). A diagonal (off-diagonal) point represents a DNA marker with a genome location very close to (different from) the location of a gene, whose expression profile is significantly affected by this marker. Hence, a diagonal point represents a putative _cis_-regulation, while an off-diagonal point is a putative _trans_-regulation. The dense distribution of diagonal points across the yeast genome indicates a large proportion of _cis_-regulations. As indicated in the previous study (Brem et al. 2002), groups of expression-profiled genes shared common QTL regions. Within a group, the expression-profiled genes did not exhibit any significant colocation on the yeast genome, which means that these genes with common QTL do not represent merely jointly regulated genes in the same chromosomal region.
Figure 1.—

Plot of the genome location of an expression-profiled gene (_y-_axis) vs. the genome location of a DNA marker significantly affecting the expression profile (_x_-axis). The _x_- and _y_-axes represent the entire yeast genome consisting of 16 chromosomes of unequal length. A diagonal point represents a DNA marker with genome location very close to the location of the gene, whose expression profile is significantly affected by this marker. An off-diagonal point indicates an expression-profiled gene, whose genomic location is different from the location of a marker significantly affecting the expression.
The length of the QTL confidence intervals, obtained by bootstrapping (without selection), varied with a minimum distance of 66 bp, a maximum distance of 1,319,588 bp, and a median distance of 93,476 bp. The number of genes within an interval ranged from zero to 717, with a median of 49. The number of genes in a C.I. was highly correlated (coefficient of 0.98) with the length of the interval. The average confidence intervals for the two selective bootstrapping methods were smaller than the average C.I. from the original bootstrap analysis; however, the lists of candidate regulatory genes retained in the intervals after the correlation test were very similar across all three bootstrapping methods (results not shown).
The number of candidate genes in each eQTL interval was reduced by evaluating the significance of simple and partial Spearman correlations between the expression profile of each candidate gene and the expression profile of the gene affected by the eQTL and sequentially retaining the most significant candidate gene at each stage, as described in methods. In ∼65% of the eQTL regions, a single gene was retained as the candidate gene (Figure 2), because no other gene had a significant partial correlation conditional on the first retained gene. In one extreme case, the sequential partial correlation tests led to the retention of six genes. In 7% of the eQTL regions, no significantly correlated candidate gene was identified. Overall, 768 putative regulatory links or candidate genes were retained. Among all eQTL regions that reduced to a single candidate gene, 45% represented _cis_-regulation, while 55% represented _trans_-regulation. Among all _trans_-eQTL regions, ∼50% were reduced to one candidate gene by the correlation test. These findings indicate that our correlation-based method is effective in reducing the set of candidate genes for both cis- and _trans_-eQTL.
Figure 2.—

The number of genes retained in each eQTL confidence interval from expression correlation analysis ranged from 0 to 6. In 65% of the eQTL regions, a single gene was retained. In another 7% of the regions, no gene was retained due to lack of significant expression (partial) in correlation tests. In the remaining regions, more than one gene was retained.
Due to concerns that the single-marker, nonparametric QTL analysis could have produced biased and unnecessarily wide confidence intervals due to the presence of multiple QTL in the same region, we performed sliding three-marker regression in each of the previously identified eQTL regions, as described in methods. This method is able to identify multiple QTL in the same QTL region, with each QTL being indicated by an adjacent pair of significant markers and with significant marker pairs separated by nonsignificant markers. A total of 848 significant marker intervals were identified across all previously defined 581 eQTL regions. The lengths of the 848 marker intervals were much shorter than the previously identified eQTL confidence intervals, with a minimum distance of 1 bp, a maximum distance of 84,219 bp, and a median distance of 6286 bp. Of the 768 retained, causal candidate genes based on the original QTL C.I.s and the expression correlation analysis, 282 were found to be located in one of the 848 marker intervals. Another 49 genes were found to be located within a 1-kb region outside the marker intervals. The regulatory links associated with these 331 genes are the strongest candidate links identified in this study. The gene pairs representing the 331 links, their Spearman correlation values, their marker intervals (for 282 links), or distances between causal gene and nearby marker interval (for 49 genes) are detailed in supplementary material I (http://www.genetics.org/supplemental/).
Gene regulatory networks were constructed by joining the directional links from the 768 retained candidate genes in QTL regions to the genes affected by the corresponding eQTL. Several network motif structures similar to previously defined structures (Lee et al. 2002; Milo et al. 2002; Shen-Orr et al. 2002) were found (Figure 3):
- _cis_-regulation: A gene's expression profile is affected by an eQTL and this gene is located in the eQTL region. A circle link is plotted at the gene's node.
- _trans_-regulation: The expression profile of BRE4 is affected by an eQTL, gene GLE1 is located in this eQTL region, and the expression profiles of these two genes are significantly negatively correlated. These two genes are involved in transporter activity.
- The feedback loop motif represents the case where either gene is physically located in the eQTL region of the other gene. The two gene products (MST27 and MST28) in the feedback loop motif were also previously shown to interact on the basis of a yeast protein interaction experiment (Uetz et al. 2000).
- The feedforward loop motif represents the case where one gene regulates another, and these two genes jointly regulate a third gene. This case shows that regulation of one gene through another can be both direct and indirect through other genes.
- The single-input motif represents the case where the expression profiles of multiple or many genes are influenced by the same eQTL region, and the same gene was retained as the candidate regulatory gene in this interval. Hence this motif depicts a set of functionally related genes coordinately regulated by a single input. Most genes in the single-input motif of Figure 3 are involved in development, in particular in response to pheromone functions.
- The multiple-input motif represents the case where a set of genes is regulated jointly by the combined effect of another set of genes. In the multiple-input motif of Figure 3, YLR247C, MAP1, and NEJ1 each regulate a set of genes, but these three sets overlap. For example, genes HMX1, ERG13, CYB5, PET10, and YJL048C are jointly regulated by MAP1 and NEJ1. The multiple-input effects should be independent and complementary, because they were inferred from significant partial correlation. We note that many genes in such a motif are involved in lipid metabolisms.
Figure 3.—

Different network motifs from single self-_cis_-regulation to multiple input modules are presented. Directional links were drawn from retained candidate genes in an eQTL region to the gene whose expression profile was affected by the eQTL. A link from one gene back to itself indicates _cis_-regulation, while a link from one gene to another gene represents putative _trans_-regulation. Red links depict positive correlations and blue links negative correlations.
The entire set of reconstructed networks included 721 genes and 768 interactions (Figure 4). These structures ranged from simple self-regulation, pairwise regulation, and interactions among a few genes to highly connected networks. Our largest network was constructed by linking several densely connected subnetworks with a few connections. The biological processes involving genes in the highly interconnected subnetworks were obtained from the gene ontology database (Ashburner et al. 2000) (supplementary material II; http://www.genetics.org/supplemental/). Overall, one or several biological processes were statistically significantly overrepresented in independent network structures or in highly interconnected subnetworks (Figure 4, Table 1). Genes involved in “protein synthesis” (Figure 4, red nodes) were found to be highly interconnected among themselves. Some of the genes involved in “aerobic respiration,” “transporter activity,” and “oxidation of organic compounds” are embedded in the protein synthesis network. Other groups of genes involved in “lipid metabolism,” “development,” and “cytokinesis during cell separation” were also closely linked within each group and loosely connected to the “protein biosynthesis” network. These findings show coordinated regulation of different biological processes. Other processes overrepresented in the network included “amine metabolism” and “pyrimidine biosynthesis.”
Figure 4.—

Entire network topology. The nodes represent genes and directional links indicate significant expression correlation between a candidate gene in an eQTL region and the gene affected by the eQTL. Different gene ontology biological processes are noted in colors as indicated by the inset. The directional link types and colors representing different regulations are also explained in the inset. Transcription factors are plotted as square nodes. Six putative regulators affecting the expression of groups of genes are plotted as large oval nodes and are indicated in the graph. A pdf figure with gene names on the nodes, which can be expanded to view the connection details, is provided in supplementary material III (http://www.genetics.org/supplemental/).
TABLE 1.
Overrepresented biological processes in subnetworks
| Groupa | Biological processb | Proportion ingroupc (%) | Proportion ingenomed (%) | Enrichment _P_-valuee |
|---|---|---|---|---|
| 1 | Protein biosynthesis | 55/123 (44.7) | 773/7276 (10.6) | 6.05_E_-22 |
| 2 | Steroid metabolism | 13/54 (24.0) | 34/7276 (0.4) | 4.69_E_-19 |
| 3 | Amino acid biosynthesis | 10/24 (41.6) | 102/7276 (1.4) | 4.80_E_-13 |
| 4 | Development | 10/19 (52.6) | 479/7276 (6.5) | 8.11_E_-08 |
| 5 | Pyrimidine base biosynthesis | 3/12 (25) | 13/7276 (0.1) | 1.23_E_-6 |
| 6 | Response to pheromone during conjugation with cellular fusion | 4/16 (25) | 48/7276 (0.6) | 3.23_E_-6 |
| 7 | Cytokinesis | 5/23 (21.7) | 78/7276 (1.0) | 4.05_E_-6 |
| 8 | Sulfur metabolism | 3/13 (23.0) | 51/7276 (0.7) | 9.34_E_-5 |
| 9 | Fermentation | 2/14 (14.2) | 16/7276 (0.2) | 4.3_E_-4 |
Because the segregating population in this genetical genomics study was a cross between two strains of yeast, the bioprocesses represented in the networks should be those pathways whose gene constituents carry different genetic variants resulting in phenotypic differences between the two strains. Most of the processes represented in the inferred network are metabolism pathways, which should represent the main genetic difference between the two yeast strains. The role of transcription factors was also investigated. Twenty-six transcription factors were found in the inferred network (Figure 4, green nodes). They did not appear in the center of the interconnected network displayed in Figure 4. Instead, most of these transcription factors had a putative regulatory link to only one other gene or exhibited _cis_-regulation. This result is in agreement with the finding that transcription factors showed no enrichment in _trans_-variations (Yvert et al. 2003).
In the previous study (Brem et al. 2002), groups of genes were found to link to eight _trans_-acting loci. From the biological function descriptions, seven genes were proposed as the possible _trans-_acting regulators for six groups of expression-profiled genes (Brem et al. 2002). In our inferred set of networks, most of the profiled genes in the eight groups were included. Six of the seven putative regulators (MATALPHA1, MATALPHA2, LEU2, AMN1, HAP1, and URA3) were identified in the network to regulate the corresponding groups of genes.
DISCUSSION
In this investigation, we reanalyzed a segregating population resulting from a cross between two yeast strains, with gene expression and DNA marker data recorded for all individuals and the entire yeast genome. The goal of this study was to investigate an initial genetical genomics analysis for genetic network reconstruction. We believe that it is necessary to investigate genetical genomics experiments and computational analyses based on artificial data simulated under nonlinear kinetic models of gene regulatory networks with alternative network topologies (Mendes et al. 2003). The results of this study [and of a repeat analysis of a larger yeast data set to become available in the near future (Jansen 2003)] should allow us to draw some inferences on the parameters of the identified network structure, which can then be incorporated in the simulation [e.g., the genomic distribution of genes within highly connected subnetworks, i.e., a quantification of whether genes within highly connected subnetworks are more likely than genes in different (sub)networks to be colocated in the genome]. Such an approach would allow us to investigate critical components of a genetical genomics experiment and analysis, such as: (1) the sample size required for a segregating population so that an acceptable false discovery rate is achieved while sufficient power is maintained for the identification of causal links in the network; (2) the optimization of a QTL analysis producing confidence intervals of minimal length with desired coverage probabilities, incorporating multiple QTL with epistatic interactions, jointly analyzing multiple correlated expression profiles as well as phenotypes of interest for which the population segregates, and performing joint linkage and linkage disequilibrium mapping to reduce the size of confidence intervals in suitable segregating populations; and (3) the investigation of statistical methods for further validation and refinement of the inferred network structures.
In this study, simple and partial Spearman rank correlations between the expression profiles of the candidate genes in each eQTL region and the gene affected by the eQTL were used to determine a short list of candidate regulatory genes for each eQTL interval. Spearman correlations are suitable for quantifying the strength of monotonic relationships and may be more robust in the presence of nonlinear regulatory relationships between genes, when compared with the Pearson correlation coefficient (an issue also deserving further investigation based on artificial data). In ∼65% of the eQTL regions, a single correlated candidate gene was retained; however, in 7% of the eQTL regions, no significantly correlated candidate gene was identified. In part, this finding may have resulted from lack of power or from the fact that some regulatory mechanisms do not exhibit expression correlations. For example, a protein-coding polymorphism may affect the binding activity of a transcription factor to its downstream genes. This polymorphism may not change the transcription factor's transcript level, but would affect the expression of downstream genes. In this case, a gene would be found to be affected by an eQTL representing the genomic location of the transcription factor, but the expression correlation of the transcription factor with the profiled gene may be low, and hence no candidate gene would be identified in the QTL region. To determine the candidate gene underlying such QTL regions, further functional analyses are needed. For 28% of all the eQTL regions, where more than one candidate gene was retained on the basis of the expression correlation analysis, additional functional information and analyses are needed to confirm that indeed several genes are responsible for the regulatory effect of the eQTL region. In total, we identified regulatory links associated with 331 causal candidate genes, which were retained in the expression correlation analysis and are located within or near an eQTL subregion identified by the sliding three-marker regression analysis, and these are the strongest candidate links identified in this study.
Genetic network inference by genetical genomics or joint analysis of gene expression and DNA marker genotype data in a segregating population, representing a multigene, natural perturbation experiment, is complementary to and has many advantages over single-factor, extreme perturbation (e.g., gene knockout) experiments (Jansen 2003) or environmental perturbations, which can produce only undirected correlation graphs. An anonymous reviewer pointed out that the network inferred by genetic dissection of gene expression is defined in a genetic sense and may differ from the molecular sense of DNA-binding transcription factor type regulation. In addition, genetic links may be direct in the classical sense but indirect in the signal transduction network sense; _i.e., trans_-eQTL may result from indirect effects related to phenotypic changes.
_Trans_-acting variants can also be investigated by first clustering gene expression profiles and subsequently mapping eQTL for clusters of genes (Yvert et al. 2003). This approach is useful for finding common eQTL regions for clusters of genes, in particular for genes with common function, but it may miss specific eQTL for individual genes. Alternatively, a cluster of genes can be analyzed as a set of correlated traits via multiple-trait QTL mapping. This analysis would identify eQTL regions affecting the cluster of genes as well as eQTL regions influencing individual genes. For the former, tests of pleiotropy vs. close linkage could be performed. Another study on genetic dissection of gene expression in mice indicates that gene expression can be used to identify distinct disease subtypes and that these subtypes are under the control of different loci (Schadt et al. 2003). Further developments should incorporate metabolomics and proteomics data. Genetic epistasis of gene expression can also be considered with large sample sizes.
Acknowledgments
We thank Leonid Kruglyak for sharing the genotype data at his lab's website, http://www.fhcrc.org/labs/kruglyak/Data/, and for providing the raw data of the spotted microarray experiments at the National Center for Biotechnology Information/Gene Expression Omnibus website, http://www.ncbi.nlm.nih.gov/geo. This work was supported by National Science Foundation cooperative agreement DBI-0211863.
APPENDIX A
For simple and partial Spearman correlations, and for significance tests on correlations, see, for example, Sokal and Rohlf (1995) and Shipley (2000).
Rank-based Spearman correlation is
where n is the number of observations, R(xi) is the rank of xi in the group of x, and R(yi) is the rank of yi in the group of y; _r_s is the calculated Spearman correlation.
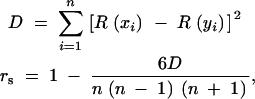
APPENDIX B
Student's _t_-test statistic for simple and partial correlations is
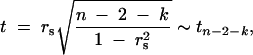
where _r_s is the simple or partial correlation coefficient, n is the number of observations used in computing the correlation value, and k is the number of variables conditioned on in a partial correlation. In our case, n = 40, and k = 0, 1, 2, etc.
APPENDIX C
The partial correlation between variables x and y conditional on a single variable z is a function of simple correlations, or
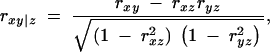
where rxy, rxz, and ryx are simple (Spearman) correlations between x and y, x and z, and y and z, respectively.
Formulas for higher-order partial correlations are straightforward extensions of the above first-order formula. For example, the second-order partial correlation between x and y conditional on both _z_1 and _z_2 is a function of first-order coefficients, or
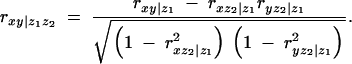
Higher-order partial correlations can be obtained recursively by continuing this process.
References
- Ashburner, M., C. A. Ball, J. A. Blake, D. Botstein, H. Butler et al., 2000. Gene ontology: tool for the unification of biology. The Gene Ontology Consortium. Nat. Genet. 25**:** 25–29. [DOI] [PMC free article] [PubMed] [Google Scholar]
- Brem, R. B., G. Yvert, R. Clinton and L. Kruglyak, 2002. Genetic dissection of transcriptional regulation in budding yeast. Science 296**:** 752–755. [DOI] [PubMed] [Google Scholar]
- Causton, H. C., B. Ren, S. S. Koh, C. T. Harbison, E. Kanin et al., 2001. Remodeling of yeast genome expression in response to environmental changes. Mol. Biol. Cell 12**:** 323–337. [DOI] [PMC free article] [PubMed] [Google Scholar]
- Dupuis, J., and D. Siegmund, 1999. Statistical methods for mapping quantitative trait loci from a dense set of markers. Genetics 151**:** 373–386. [DOI] [PMC free article] [PubMed] [Google Scholar]
- Eisen, M. B., P. T. Spellman, P. O. Brown and D. Botstein, 1998. Cluster analysis and display of genome-wide expression patterns. Proc. Natl. Acad. Sci. USA 95**:** 14863–14868. [DOI] [PMC free article] [PubMed] [Google Scholar]
- Fernando, R. L., D. Nettleton, B. R. Southey, J. C. M. Dekkers, M. F. Rothschild et al., 2004. Controlling the proportion of false positives in multiple dependent tests. Genetics 166**:** 611–619. [DOI] [PMC free article] [PubMed] [Google Scholar]
- Goffeau, A., B. G. Barrell, H. Bussey, R. W. Davis, B. Dujon et al., 1996. Life with 6000 genes. Science 274**:** 546, 563–547. [DOI] [PubMed] [Google Scholar]
- Ideker, T., V. Thorsson, J. A. Ranish, R. Christmas, J. Buhler et al., 2001. Integrated genomic and proteomic analyses of a systematically perturbed metabolic network. Science 292**:** 929–934. [DOI] [PubMed] [Google Scholar]
- Jansen, R. C., 2003. Studying complex biological systems using multifactorial perturbation. Nat. Rev. Genet. 4**:** 145–151. [DOI] [PubMed] [Google Scholar]
- Jansen, R. C., and J. P. Nap, 2001. Genetical genomics: the added value from segregation. Trends Genet. 17**:** 388–391. [DOI] [PubMed] [Google Scholar]
- Korstanje, R., and B. Paigen, 2002. From QTL to gene: the harvest begins. Nat. Genet. 31**:** 235–236. [DOI] [PubMed] [Google Scholar]
- Lebreton, C. M., P. M. Visscher, J. Dupuis and D. Siegmund, 1998. Empirical nonparametric bootstrap strategies in quantitative trait loci mapping: conditioning on the genetic model. Genetics 148**:** 525–535. [DOI] [PMC free article] [PubMed] [Google Scholar]
- Lee, T. I., N. J. Rinaldi, F. Robert, D. T. Odom, Z. Bar-Joseph et al., 2002. Transcriptional regulatory networks in Saccharomyces cerevisiae. Science 298**:** 799–804. [DOI] [PubMed] [Google Scholar]
- Lockhart, D. J., H. Dong, M. C. Byrne, M. T. Follettie, M. V. Gallo et al., 1996. Expression monitoring by hybridization to high-density oligonucleotide arrays. Nat. Biotechnol. 14**:** 1675–1680. [DOI] [PubMed] [Google Scholar]
- Mendes, P., W. Sha and K. Ye, 2003. Artificial gene networks for objective comparison of analysis algorithms. Bioinformatics 19**:** II122–II129. [DOI] [PubMed] [Google Scholar]
- Milo, R., S. Shen-Orr, S. Itzkovitz, N. Kashtan, D. Chklovskii et al., 2002. Network motifs: simple building blocks of complex networks. Science 298**:** 824–827. [DOI] [PubMed] [Google Scholar]
- Schadt, E. E., S. A. Monks, T. A. Drake, A. J. Lusis, N. Che et al., 2003. Genetics of gene expression surveyed in maize, mouse and man. Nature 422**:** 297–302. [DOI] [PubMed] [Google Scholar]
- Schena, M., D. Shalon, R. W. Davis and P. O. Brown, 1995. Quantitative monitoring of gene expression patterns with a complementary DNA microarray. Science 270**:** 467–470. [DOI] [PubMed] [Google Scholar]
- Shannon, P., A. Markiel, O. Ozier, N. S. Baliga, J. T. Wang et al., 2003. Cytoscape: a software environment for integrated models of biomolecular interaction networks. Genome Res. 13**:** 2498–2504. [DOI] [PMC free article] [PubMed] [Google Scholar]
- Shen-Orr, S., R. Milo, S. Mangan and U. Alon, 2002. Network motifs in the transcriptional regulation network of Escherichia coli. Nat. Genet. 31**:** 64–68. [DOI] [PubMed] [Google Scholar]
- Shipley, B., 2000 Cause and Correlation in Biology. Cambridge University Press, Cambridge, UK.
- Sokal, R. R., and F. J. Rohlf, 1995 Biometry. W. H. Freeman, New York.
- Storey, J. D., and R. Tibshirani, 2003. Statistical significance for genomewide studies. Proc. Natl. Acad. Sci. USA 100**:** 9440–9445. [DOI] [PMC free article] [PubMed] [Google Scholar]
- Stuart, J. M., E. Segal, D. Koller and S. K. Kim, 2003. A gene-coexpression network for global discovery of conserved genetic modules. Science 302**:** 249–255. [DOI] [PubMed] [Google Scholar]
- Thaller, G., and I. Hoeschele, 2000. Fine-mapping of quantitative trait loci in half-sib families using current recombinations. Genet. Res. 76**:** 87–104. [DOI] [PubMed] [Google Scholar]
- Uetz, P., L. Giot, G. Cagney, T. A. Mansfield, R. S. Judson et al., 2000. A comprehensive analysis of protein-protein interactions in Saccharomyces cerevisiae. Nature 403**:** 623–627. [DOI] [PubMed] [Google Scholar]
- Visscher, P. M., R. Thompson and C. S. Haley, 1996. Confidence intervals in QTL mapping by bootstrapping. Genetics 143**:** 1013–1020. [DOI] [PMC free article] [PubMed] [Google Scholar]
- Yvert, G., R. B. Brem, J. Whittle, J. M. Akey, E. Foss et al., 2003. Trans-acting regulatory variation in Saccharomyces cerevisiae and the role of transcription factors. Nat. Genet. 35**:** 57–64. [DOI] [PubMed] [Google Scholar]
- Zeng, Z-B., 1993. Theoretical basis for separation of multiple linked gene effects in mapping quantitative trait loci. Proc. Natl. Acad. Sci. USA 90**:** 10972–10976. [DOI] [PMC free article] [PubMed] [Google Scholar]