Telomere Length Assessment in Human Archival Tissues: Combined Telomere Fluorescence in Situ Hybridization and Immunostaining (original) (raw)
Abstract
A method was developed to assess human telomere lengths at the individual cell level in tissue sections from standard formalin-fixed paraffin-embedded tissues. We coupled this method with immunofluorescence to allow the simultaneous identification of specific cell types. Validation of this in situ quantification method showed excellent agreement with the commonly used telomere repeat fragment-Southern blot method. The assay requires very few cells (∼10 to 15). Thus, small tissue samples, including clinical biopsies, can be easily accommodated. In addition, the cells under study need not be actively cycling and there is no requirement for tissue disaggregation or cell culture. This method provides a more accurate assessment of telomere lengths than Southern blotting because confounding contributions from undesired cell types within tissue samples are avoided. Using this technique, we were able to perform the first comparison of relative telomere lengths in matched tumor versus normal epithelial cells within archival human prostate tissues.
Human telomeres play critical roles, both in the maintenance of chromosomal stability, as well as in limiting the ultimate replicative capacity of cells. Telomere shortening has been suggested to be an important biological factor in aging, cell senescence, cell replication, cell immortality, and transformation to cancer. 1-5 It is therefore important in pathology to have a method for quantitative assessment of telomere lengths applicable to individual human cells in archival material.
Telomeres are essential structures composed of specialized terminal DNA sequence repeats complexed with telomere-binding proteins located at the ends of every human chromosome. 6 Telomeric DNA tracts that, in humans are typically composed of 1000 to 2000 tandem repeats of the hexanucleotide sequence TTAGGG, are dynamic entities. Telomeres are subject to shortening during cell division because of their incomplete replication during DNA synthesis (the end replication problem). 7-10 In addition, telomere shortening may also result from unrepaired single-strand breaks caused by oxidative damage. 11-13 Conversely, telomeres may increase in length, either through action of the enzyme telomerase, 14,15 or, at times, via amplification or genetic recombination events. 16-20
Telomere maintenance is a critical factor in allowing continuous cell proliferation. 21-24 This is underscored by the fact that at least 85% of human cancers, and a majority of established cell lines, possess active telomerase, whereas activity is rarely detected in normal differentiated human somatic cells. 25-27 Also, forced expression of telomerase in cells destined to undergo senescence results in their immortalization. 21-24
Recently, Lansdorp and colleagues 28-30 developed a fluorescence in situ hybridization (FISH)-based method for quantitative telomere length measurement applicable to metaphase chromosome spreads. This technique has since been applied to interphase hematopoietic cells, cells in culture, and flow cytometry. 31-36 This method has also been applied to mouse skin samples. 37,38 However, the telomeres of inbred mouse strains are typically an order of magnitude longer than their human counterparts and no validation or detailed method has been presented for the quantification of telomeres in paraffin-embedded tissue samples.
Inspired by the Maude Abbott lecture delivered by the late Roger C. Haggitt, M.D., at the 2000 Annual Meeting of the United States and Canadian Academy of Pathology in New Orleans, we adapted the Lansdorp method 28-30 and validated it for human formalin-fixed paraffin-embedded archival material. We also present the novel coupling of this technique with simultaneous localization of bound antibodies (immunofluorescence) allowing us to assess telomere lengths in specific cells of interest within tissue sections.
Materials and Methods
Cell Culture
The established human prostate cancer cell line LNCaP (clone FGC, androgen-sensitive/nodal metastasis origin) was obtained from the American Type Culture Collection (ATCC) (catalog no. CRL-1740; ATCC, Rockville, MD). Androgen-independent sublines of the LNCaP.FGC human prostate cell line, as well as the parental androgen-sensitive control line from which they were derived, were generously provided by Dr. Joel Nelson (Department of Urology, University of Pittsburgh School of Medicine, Pittsburgh, PA). Cells were grown in 25-cm 2 or 75-cm 2 plastic tissue-culture flasks (Falcon/Becton and Dickenson Co., Franklin Lakes, NJ.) in a humidified incubator (37°C, 84% humidity, 5% CO2/ambient air atmosphere) either in RPMI-1640 medium with phenol red supplemented with 10% fetal bovine serum (Life Technologies, Inc., Rockville, MD), or in hormone-depleted medium consisting of RPMI-1640 without phenol red supplemented with 10% charcoal-stripped serum (HyClone Laboratories Inc., Logan, UT). Cells were passaged weekly at ∼75% confluence using 0.25% trypsin/0.02% ethylenediaminetetraacetic acid (Life Technologies, Inc.) for detachment, followed by inactivation with serum-containing media (normal or charcoal-stripped as appropriate) and seeding of new flasks using a split ratio of 1:10. All lines were tested using a polymerase chain reaction-based mycoplasma detection kit obtained from the ATCC (catalog no. 90-1001K) and found to be free of mycoplasma contamination. Additional cell lines used in this study were also obtained from the ATCC. Media and passaging procedures followed the accompanying ATCC recommendations.
Cell Block Preparation
Cell cultures were grown as described to 50 to 75% confluence, detached, and fixed in 10% (v/v) phosphate-buffered formalin (J.T. Baker, Phillipsburg, NJ) for 15 hours at 25°C. Fixed cells were pelleted by centrifugation at 500 × g for 10 minutes, washed once in 1× phosphate-buffered saline (PBS), and pelleted again. The cell pellets were resuspended in an equal volume of 0.8% agarose at 42°C. The agarose/cell mixture was then transferred to a 0.6-ml microfuge tube and allowed to solidify. Agarose/cell plugs were then embedded into the same paraffin block, thus producing a single block containing all of the LNCaP sublines possessing different telomere lengths.
Tissue Samples
Human tissues were obtained from the department of surgical pathology at The Johns Hopkins University School of Medicine. Two tissue microarrays were constructed for in situ hybridization/immunostaining. The first consisted of an assortment of normal human tissues obtained from excess tissues from surgical specimens from adults. The second consisted of matched samples of prostate carcinoma and normal prostate epithelium from radical prostatectomy specimens (n = 20 cases). Normal tissues were fixed in 10% neutral-buffered formalin and subjected to standard processing and paraffin embedding. Radical prostatectomy specimens were obtained fresh from the operating room. Specimens were immediately inked, processed by vigorous injection of formalin, and followed by microwave treatment. 39 Prostates were then sectioned and tissues were further fixed for 1 to 4 hours and then subjected to standard tissue processing and paraffin embedding. For prostate specimens, patient ages varied between 50 and 70 years (median, 60.2 years). For tissue microarray construction, representative areas containing morphologically defined lesions or normal tissues were circled on the glass slides and used as a template. Arrays were constructed using a manual Tissue Puncher/Arrayer (Beecher Instruments, Silver Spring, MD) as previously described. 40 For the normal tissue array, a total of 114 tissue cores (0.6-mm diameter) were arrayed in a single block using a spectrum of different human tissues. For the prostate tissue microarray, a total of 200 samples (0.6 mm in diameter cores) from 20 patients were arrayed into a single block using five samples each of tumor and normal tissue from each patient. The tissue microarray blocks were sectioned at 4 μm and stained by telomere-FISH (TEL-FISH) and/or immunofluorescence.
TEL-FISH and Telomere/Immunostaining-FISH (TELI-FISH)
Deparaffinized slides were hydrated through a graded ethanol series, placed in deionized water, followed by deionized water plus 0.1% Tween-20 detergent. Slides were then placed in citrate buffer (catalog no. H-3300; Vector Laboratories, Burlingame, CA), paired to form capillary gaps and steamed for 14 minutes (Black and Decker Handy Steamer Plus; Black and Decker Corp., Towson, MD), removed, and allowed to cool at room temperature for 5 minutes. Slides were then placed in PBS with Tween (PBST) (catalog no. P-3563; Sigma Chemical Co., St. Louis, MO) for 5 minutes. Slides were then placed in a protease solution consisting of 0.5 mg/ml of protease (Protease Type VIII, catalog no. P-5380; Sigma) in PBST for 1 minute at room temperature. Slides were thoroughly rinsed with deionized water, followed by 95% ethanol for 5 minutes, and then air-dried. Twenty-five μl of a Cy3-labeled telomere-specific peptide nucleic acid (PNA) [0.3-μg/ml PNA in 70% formamide, 10 mmol/L Tris, pH 7.5, 0.5% B/M Blocking reagent (catalog no. 1814-320; Boehringer-Mannheim, Indianapolis, IN)] was applied to the sample, which was then coverslipped, and denaturation was performed by incubation for 4 minutes at 83°C. Slides were then moved to a dark, closed container for hybridization at room temperature for 2 hours. Coverslips were then carefully removed and the slides were washed twice in PNA wash solution [70% formamide, 10 mmol/L Tris, pH 7.5, 0.1% albumin (from 30% albumin solution, catalog no. A-7284; Sigma)], followed by 3 × 5-minute washes in TBS. At this point slides were either counterstained with 4′-6-diamidino-2-phenylindole (DAPI) (250 ng/ml in deionized water, Sigma Chemical Co.) for 1 minute at room temperature, mounted with Prolong anti-fade mounting medium (catalog no. P-7481; Molecular Probes Inc., Eugene, OR), and imaged, or were processed for indirect immunofluorescence as follows. Slides were rinsed in PBST followed by application of primary antibody (anti-cytokeratin antibody 34βE12, catalog no. 30904; Enzo Diagnostics, Farmingdale, NY) and incubated overnight at 4°C. Slides were then rinsed in PBST followed by application of fluorescent secondary antibody labeled with Alexa Fluor 488 (Molecular Probes) diluted 1:1000 in Dulbecco’s PBS, and incubated at room temperature for 30 minutes. Slides were then rinsed in PBST, and thoroughly rinsed in deionized water. Slides were drained and stained with DAPI. Slides were then rinsed well in deionized water, drained, mounted with Prolong anti-fade mounting medium (catalog no. P-7481, Molecular Probes Inc.), coverslipped, and imaged or stored at 4°C until used. Other primary antibodies used included: rabbit polyclonal anti-prostatic acid phosphatase (1:20,000; DAKO Corp., Carpinteria, CA), mouse monoclonal anti-p63 cocktail (cocktail of clones 4A4 and 63P02; Lab Vision, Fremont CA), and rabbit polyclonal anti-glutathione _S-_transferase pi (1:2000, DAKO). The PNA probe complementary to the mammalian telomere repeat sequence was obtained from Applied Biosystems (Framingham, MA), and has the sequence (N-terminus to C-terminus) CCCTAACCCTAACCCTAA with an N-terminal covalently linked Cy3 fluorescent dye. The analogous specificity control PNA, complementary to the Caenorhabditis elegans telomere sequence, was a generous gift from Dr. Carol Greider (Department of Molecular Biology and Genetics, The Johns Hopkins University School of Medicine, Baltimore, MD).
Telomere Length Measurements by Southern Blotting
Telomere length measurements by the telomere repeat fragment (TRF) Southern technique followed previously published methods. 41 Proteinase K, phenol, and DNA molecular weight markers were obtained from Life Technologies, Inc. Restriction enzymes _Msp_I (catalog no. 106S) and _Rsa_I (catalog no. 167S) were obtained from New England Biolabs, Beverly, MA. Unless otherwise stated, chemicals routinely used in the preparation of buffers, and so forth were purchased from Sigma Chemical Co. In brief, high-molecular weight genomic DNA was prepared from cell pellets and 1 μg of each purified DNA stock was then subjected to agarose gel electrophoresis to check for evidence of degradation or shearing. In all samples >99% of ethidium bromide-staining material was 23 kbp or greater in length. One to two μg of this DNA was then digested to completion with 1 U each of _Rsa_I and _Msp_I as per the manufacturer’s instructions. DNA fragments and appropriate molecular weight standards were then separated by electrophoresis, blotted, and probed with a 24-mer oligonucleotide probe complementary to the telomeric repeat sequence (TTAGG)4 (Bio-Synthesis Inc., Lewisville, TX) using standard methods.
Phosphorimage exposures of telomere-probed Southern blots were analyzed with the program Image Quant (Molecular Dynamics, Sunnyvale, CA). The digitized signal data were then transferred to Microsoft Excel (Redmond, WA), and were the basis for calculating mean TRF length using the formula: L = (ODi)/(ODi/Li), where ODi = integrated signal intensity at position i, and Li = length of DNA fragment in position i. Mean fragment lengths were calculated throughout a range of 2 to 20 kbp. To correct for discrepancies in DNA loading and to confirm complete digestion, membranes were stripped and rehybridized with the microsatellite oligonucleotide probe (CAC)5.
Microscopy
Slides were imaged with a Zeiss Axioskop epifluorescence microscope equipped with short-arc mercury lamp illumination (Carl Zeiss Inc., Thornwood, NY) and a ×100/1.4 NA oil immersion Neofluar lens. Fluorescence excitation/emission filters were as follows: Cy3 excitation, 546 nm/10 nm BP; emission, 578 nm LP (Carl Zeiss Inc.); DAPI excitation, 330 nm; emission, 400 nm via an XF02 fluorescence set (Omega Optical, Brattleboro, VT); Alexa Fluor 488 excitation, 475 nm; emission, 535 nm via a combination of 475RDF40 and 535RDF45 filters (Omega Optical). Fluorescent images were captured with a cooled charge-coupled device camera (Micro MAX digital camera; Princeton Instruments, Trenton, NJ). Integration times typically ranged from 500 ms to 800 ms for Cy3 signal capture, 50 ms to 100 ms for DAPI counterstain, and 100 ms to 200 ms for Alexa Fluor 488-conjugated antibodies. At the beginning of an imaging session, optimum exposure times were determined, and all exposure times were held constant thereafter, such that all cells within a comparison set experienced identical exposure times. In all cases, telomeric signals were within the linear response range of the charge-coupled device camera, which was confirmed by use of fluorescent microbead intensity standards (InSpeck microscope image intensity calibration fluorescent microspheres, catalog no. I-7223; Molecular Probes, Inc.). Assessment of decreases in signal intensity from multiple telomeric spots within the same field after sequential, timed exposures indicated that the extent of signal loss because of photobleaching of the hybridized Cy3 telomeric probe was linear, and <4% per 1000 ms.
Image Analysis
Quantitation of the digitized fluorescent telomere signals was accomplished by use of a semiautomated algorithm written with the image analysis software package IPLabs (Scanalytics, Inc., Fairfax, VA). For a given ×1000 image, cells that contained detectable telomere signals that were in sharp focus were chosen for analysis. Image processing was performed as follows. For a given nucleus, the raw Cy3 telomere image was filtered with a Laplacian of Gaussian filter after background subtraction. This corrected image was then segmented on gray-value thresholding for contouring of telomeric spots that were then binarized; creating a mask that was applied to the original telomere fluorescence data. Telomeric signals identified by the segment mask, having sizes greater than the threshold for background noise, and that were contained within the area inscribed by the nuclear DAPI signal, were then measured, and the data for each telomeric spot within that particular nucleus was tabulated. The total DAPI fluorescence signal for each nucleus was also quantified. Tabulated data were then exported to Microsoft Excel (Microsoft Corp.) and STATA 6.0 for Microsoft Windows (Stata Corp., College Station, TX) or SAS (SAS Institute, SAS Institute, Cary, NC) for further data handling and statistical analysis, respectively.
For human prostate tissue samples, cancer cells were differentiated from normal cells by first identifying them on hematoxylin- and eosin-stained adjacent sections. Using the fluorescence microscope, cancer tissues were distinguished on the actual TELI-FISH slide by their epithelial appearance and lack of a basal epithelial layer, as assessed by staining with basal cell-specific anti-cytokeratin antibody 34βE12 using a separate color for localization (Signet Laboratories, Dedham, MA). Normal appearing glands that contained an intact basal cell layer within the same tissue section served as internal positive controls for 34βE12 staining.
Data Analysis
For each nucleus, the individual Cy3 telomere signals were summed and this total was divided by the total DAPI fluorescence signal for that nucleus, thus correcting for potentially confounding differences in nuclear cutting planes and ploidy. For the LNCaP panel, as well as additional validation sets, this procedure was performed using data from a minimum of 10 nuclei per cell line/subline. These ratios were multiplied by 10,000 and plotted against the mean TRF values determined separately by Southern analysis on these same cell populations. Pair wise comparisons (Wilcoxon rank sum) between the ratios for these cell lines were conducted and plotted using STATA 6.0.
For patient samples (Table 1) ▶ , comparisons of the mean ratio of telomeric signal to DAPI between tumor and normal tissue were done using the _t_-test (SAS).
Table 1.
Telomere Length Comparison by TELI-FISH: Matched Normal Prostate Epithelium versus Prostate Cancer
| Case | Gleason score | Stage | Normal mean | SD | n | Tumor mean | SD | n | Delta (normal-tumor) | P value |
|---|---|---|---|---|---|---|---|---|---|---|
| 1 | 6 | T2N0Mx | 672 | 439 | 13 | 180 | 101 | 10 | 492 | .0019* |
| 2 | 6 | T2N0Mx | 216 | 98 | 13 | 104 | 45 | 14 | 112 | .0016* |
| 3 | 7 | T2N0Mx | 443 | 234 | 10 | 185 | 93 | 9 | 259 | .0073* |
| 4 | 7 | T3aN0Mx | 278 | 78 | 6 | 160 | 70 | 12 | 118 | .0046* |
| 5 | 7 | T2N0Mx | 415 | 121 | 13 | 238 | 103 | 12 | 176 | .0007* |
| 6 | 6 | T2N0Mx | 372 | 83 | 18 | 243 | 109 | 16 | 129 | .0005* |
| 7 | 6 | T2N0Mx | 258 | 165 | 13 | 109 | 34 | 23 | 149 | .0002* |
| 8 | 7 | T2N0Mx | 363 | 148 | 10 | 58 | 30 | 10 | 305 | <.0001* |
| 9 | 7 | T2N0Mx | 141 | 49 | 12 | 40 | 34 | 13 | 101 | <.0001* |
| 10 | 6 | T2N0Mx | 388 | 107 | 16 | 178 | 69 | 17 | 210 | <.0001* |
| 11 | 7 | T3aN0Mx | 167 | 92 | 13 | 124 | 70 | 10 | 43 | .232 |
| 12 | 7 | T2N0Mx | 188 | 142 | 11 | 115 | 71 | 12 | 73 | .14 |
| 13 | 6 | T2N0Mx | 356 | 267 | 9 | 175 | 219 | 9 | 182 | .14 |
| 14 | 6 | T3aN0Mx | 318 | 166 | 8 | 288 | 301 | 6 | 31 | .81 |
| 15 | 7 | T2N0Mx | 70 | 48 | 11 | 67 | 26 | 11 | 4 | .83 |
| 16 | 6 | T2N0Mx | 170 | 102 | 12 | 321 | 176 | 15 | −151 | .0143* |
| 17 | 6 | T2N0Mx | 137 | 56 | 9 | 408 | 201 | 17 | −270 | <.0001* |
Results
Validation of in Situ Telomere Length Measurement
To develop a set of positive controls for telomere length assessment in tissue sections, we subjected a series of LNCaP prostate cancer cell sublines to androgen withdrawal for varying lengths of time, resulting in four sublines, each containing a different mean telomere repeat length. 42 To simulate standard pathology slides, cell pellets from each cell subline were fixed with formalin and processed into paraffin. A paraffin block containing all four sublines was sectioned and stained by TEL-FISH. Representative images of the hybridization reaction localizing the fluorescent telomeric PNA probe in these cells are shown in Figure 1 ▶ . The four sublines were qualitatively scored, at the microscope, for relative telomere length by four separate observers in a blinded manner, and each observer correctly determined the rank order [the probability of correctly ordering the cell lines in this manner by chance is (1 in 4) 4 = 0.000003]. Control hybridizations using a PNA probe complementary to the C. elegans telomere sequence (TTAGGC) failed to produce any discrete nuclear signals, thus, confirming the specificity of the hybridization reactions using the PNA probe complementary to the mammalian sequence (data not shown).
Figure 1.
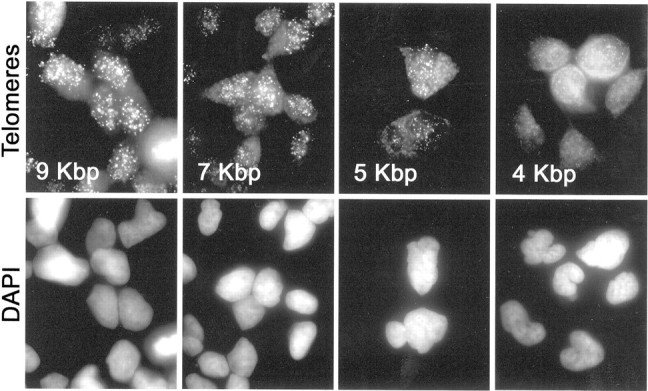
PNA signals from LNCaP subline panel containing different telomere lengths. Four LNCaP sublines possessing different telomere lengths were fixed in formalin and embedded in a single paraffin block. Sections were stained for telomeres as described in Materials and Methods. Top: Cy3-PNA telomere probe fluorescence (oil objective; original magnification, ×1000). Bottom: DAPI fluorescence. Average telomere lengths (in kbp) calculated from TRF-Southern data are indicated.
Telomeric signals were quantified from digital fluorescence microscopy images. The resulting sums of telomeric pixel intensities for each of 10 to 12 nuclei per LNCaP subline were recorded. To control for differing amounts of DNA in the sectioned nuclei, each telomere fluorescence sum for a given nucleus was divided by the sum of pixels of the DAPI signal within that nucleus. Data from the full set of measured nuclei from each subline is presented in Figure 2A ▶ . Pairwise comparisons (Wilcoxon rank sum) showed that all sublines differed significantly from one another (all P values <0.01). Linear least squared fitting of the data showed that the measurements of telomere lengths by TEL-FISH were positively correlated (r = 0.997) with data obtained by the standard Southern blot technique (TRF analysis) performed on these same cell populations (Figure 2C ▶ , large circles). The linear trend line intersects the x axis at a TRF length of ∼2 kbp. This value is in good agreement with published estimates of the amount of subtelomeric DNA present in telomeric restriction fragments. 10,43-46 Because these subtelomeric sequences are not composed of the canonical telomere repeat, the PNA probe does not hybridize to them and, therefore, they do not interfere with telomere length analysis by TEL-FISH. In a separate series using five different cell lines, including two of nonprostatic origin, a positive correlation was again obtained (r = 0.946) with a nearly identical x intercept. The combined results of these assays, representing nine different lines/sublines in total, are plotted together in Figure 2C ▶ .
Figure 2.

TEL-FISH quantitation results. A: Box and whisker plot of relative telomere signals from four LNCaP sublines each possessing distinctly different telomere lengths (n = 10 to 12 cells measured per subline). The boxed region encloses the 25th through 75th percentiles, with the horizontal line indicating the median. Whiskers include the 5th to 95th percentiles, open circles represent outliers. B: TRF-Southern blot of LNCaP sublines (numbered 1 to 4). Genomic DNA was digested with _Rsa_I and _Msp_I, blotted, and probed with a radiolabeled telomere-specific oligonucleotide primer. Molecular weight markers (M) are labeled in Kbp. C: Relative mean telomere fluorescence signals for each LNCaP subline (large circles) plus additional cell lines (diamonds) plotted against mean telomere length calculated from TRF-Southern data collected on the same cells. Cell lines (all human-derived) included the prostate cancer (LNCaP, PC-3, and DU145)-, leukemia (HL-60)-, and colon cancer (HCT116)-derived lines. The trend line indicates linear regression results.
Performance of TEL-FISH in Human and Rodent Tissue Sections
Telomeres were readily visualized in various human formalin-fixed paraffin-embedded tissues (Figure 3 ▶ ; a to c). An optimized protocol for staining multiple human tissues in a single tissue microarray was developed using a wide range of tissue types, as well as tissue microarrays containing matched normal and cancerous human prostate samples. We found that steam heating followed by a brief protease digestion step gave bright telomere signals in both the epithelium and stroma from the following tissues that were tested: testis, urinary bladder, prostate, kidney, ovary, endometrium, fallopian tube, uterine cervix, breast, lung, skin, tonsil, lymph node, laryngeal epithelium, thymus, spleen, pancreas, gall bladder, thyroid, peripheral nerve, colon, ileum, stomach, esophagus, liver, skeletal muscle, and smooth muscle. Although cytoplasmic background autofluorescence was generally minimal, at times the liver and skeletal muscle showed significant levels of this background signal. However, even in those tissues, this did not hamper the interpretation of telomere signals because the nuclei showed very little autofluorescence.
Figure 3.
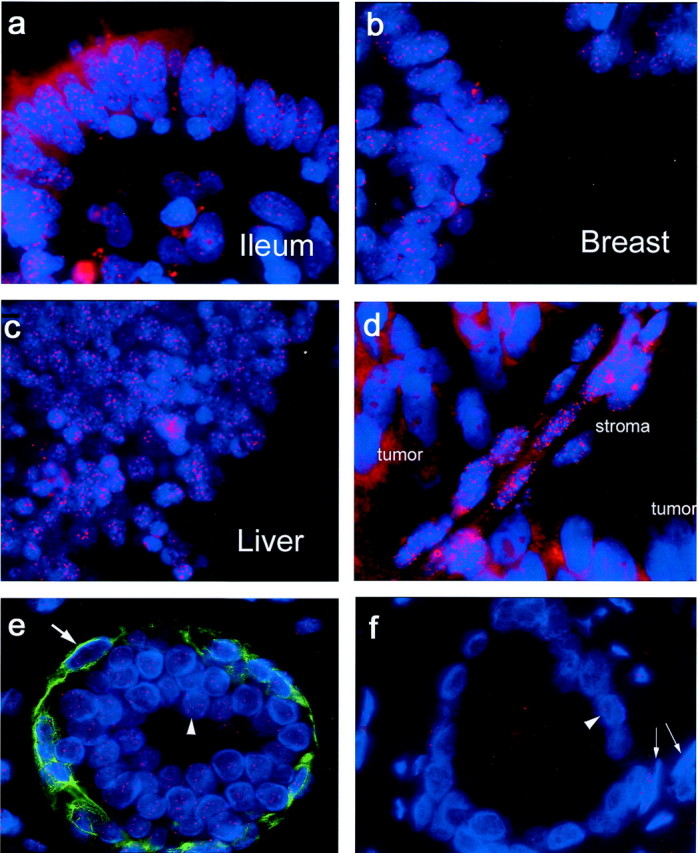
TEL-FISH on normal human tissues (human multitissue array), human prostate xenograft tumor, and matched normal:tumor prostate tissue from the same gland. a–c: Telomeres are visualized by hybridization of fluorescently labeled (Cy3) peptide nucleic acid probe and are seen as bright red spots in these sections from standard formalin-fixed, paraffin-embedded normal human tissues (blue, DAPI; oil; original magnifications, ×100). d: PC-82 human prostate tumor xenograft growing in a nude mouse. e and f: Representative image of normal and tumor human prostate acini using a combination of TEL-FISH and immunofluorescence. Basal cells in the normal tissue are clearly distinguished by their basal cell-specific cytokeratin positivity. Red, telomere-specific Cy3-labeled PNA probe; green, 34βE12 anti-cytokeratin antibody; blue, DAPI. Oil; original magnifications, ×1000. e: Large arrow, a normal basal cell; arrowhead, normal secretory epithelial cell. f: Arrowhead, tumor cell; arrows, normal stromal cells. Tumor telomeres are notably less intense than in the adjacent host stroma.
Because all mammals share the same telomere DNA sequence, this method should be applicable to nonhuman mammalian tissues. We therefore stained various mouse, rat, and dog tissues that were formalin-fixed and paraffin-embedded. All species’ tissues showed bright telomeric signals using formalin-fixed paraffin-embedded samples (data not shown). As expected, rodent tissues exhibited extremely bright signals, as it is known that many inbred rodent strains contain very long telomeres 31,47-49 (Figure 3d ▶ ; compare telomere signals in the host stroma and vasculature to those in the resident human prostate cancer xenograft).
Combined TEL-FISH and Immunofluorescence (TELI-FISH)
Using the TRF-Southern method, telomeres have previously been shown to be shorter in human prostate cancer versus matched adjacent normal tissues. 41,50,51 However, these previous studies used a complex mixture of cell types including stromal, endothelial, and inflammatory cells whose telomeres were averaged using the Southern blotting method. Thus, the telomere length estimates in such complex mixtures are not necessarily reflective solely of epithelial cells in either the tumor or the normal sample. 50 Because prostate cancer is derived from epithelial cells, it is of interest to compare telomere lengths in prostate cancer cells to non-neoplastic prostate epithelial cells in situ. Although the fluorescent telomeric signals in formalin-fixed sections are easily discernable, fluorescence microscopy limits one’s ability to distinguish specific cell and tissue types. To help facilitate the delineation of normal prostate epithelium from adenocarcinoma, we wished to combine telomere length assessment in situ with immunofluorescence. We therefore combined the TEL-FISH assay with immunofluorescence (TELI-FISH). Figure 3, e and f ▶ , shows representative images of normal and cancerous human prostate glands, respectively, from a tissue microarray stained for basal cell-specific cytokeratins (green, antibody 34βE12), DNA (blue, DAPI), and telomeres (red, Cy3-labeled anti-telomeric PNA). As can be seen, basal cells are easily identifiable in the normal gland, in the green channel, while strong telomere signals are detected in the red channel; in this specimen tumor cells show little or no telomeric signal whereas the normal epithelial cells show bright telomere signals. Also, bright telomere signals were identified in the prostatic stroma. The performance of other antibodies, including those specific for prostatic acid phosphatase, glutathione _S_-transferase pi, and p63, was also assessed. To minimize loss of antigen, we omitted the protease digestion step of the protocol. We saw no loss of telomeric signals because of omission of this step, and all antibodies performed as expected in combination with the PNA probe (data not shown). An additional 16 prostate cancer cases were evaluated by the TELI-FISH procedure using a tissue microarray consisting of matched tumor and normal tissues from prostate cancer patients. Of the 17 total cases examined, 10 had statistically significantly shorter telomeres in the tumor than in the adjacent normal tissue (Table 1 ▶ , P < 0.01). Tumor telomeres were also shorter in three additional cases, however these differences were not statistically significant (Table 1) ▶ . In two other cases, the normal and tumor telomere lengths were essentially identical, whereas in the remaining two cases; the tumor telomeres were statistically significantly longer than those in the corresponding normal epithelium (Table 1) ▶ .
Discussion
Given the potential roles that telomere dynamics may be playing in human biology, there has been keen interest in measuring telomere lengths in human tissues. The current gold-standard method is based on Southern blotting and has been widely used. 44,52-56 This technique involves isolation of high-molecular-weight genomic DNA from relatively large unfixed tissue samples (∼5 × 10 5 cells minimum), which is then digested with one or more frequent cutting restriction endonucleases that do not recognize the telomere repeat sequence. The resulting telomeric restriction fragments (TRFs) are then sized by electrophoretic separation, followed by Southern blotting and probing with a telomere-specific probe. On visualization, one sees a smeared distribution pattern of TRFs because, in part, of the dynamic nature of telomeric DNA that produces both intercellular and intracellular heterogeneity in telomere lengths. In addition, variation exists in the amount of subtelomeric sequences (composed in part of telomere-related sequences) that remain undigested, inflating the length estimate of true telomeric repeats by ∼2 to 4 kbp. 10,43-46 Other drawbacks of this technique include the fact that information on the distribution of telomere lengths at the level of single cells is not obtainable, nor is one able to identify specific cell subtypes within the tissue under study—a notable problem in most tissue samples, where cellular heterogeneity is the rule, and different proportions of cell subtypes having different telomere lengths may easily skew the results. 50 In addition, there is no universally agreed on standard for the reporting of telomere length estimates from TRF analysis, with the distribution mean, median, and peak intensity all having been used.
Telomere quantitation by slot-blot represents a variation of the above Southern technique that allow for the use of far fewer cells (∼1000 cells) as well as omission of the DNA isolation step. 57,58 Unfortunately, information on the telomere size distribution is lost in this approach because the measurement produces a single value representing the total amount of telomeric DNA present in the sample.
FISH technology, using telomere-specific oligonucleotide probes, has also been used to quantitate telomeres, overcoming several of the disadvantages inherent in Southern-based techniques. Initially, this was performed semiquantitatively; by comparing the percent detectability of telomeric signals in interphase cells. 54 A fully quantitative method (Q-FISH), using metaphase chromosome spreads, was later developed by Lansdorp and colleagues 28-32,59,60 that was, in turn, applied by DePauw and colleagues, 33 to interphase hematopoietic cells. 28,29-31,32,33,59,60 Notable advantages of this approach include the following: 1) the use of a superior peptide nucleic acid (PNA) hybridization probe, 61 2) the need for far fewer cells (<30), and 3) information is obtained on the telomere lengths of specific individual chromosomes. Unfortunately, one is restricted primarily to the use of cells proliferating in vitro, from which metaphase spreads can be made (eg, hematopoietic cells and cells growing in culture). Also, as with the Southern-based approaches, information regarding specific cell phenotypes is typically unobtainable. Similar methods using PRINS (primed in situ nucleic acid synthesis) in place of FISH have also been developed. 62-65
One group has reported the application of the Q-FISH technique to mouse skin sections. However, no detailed protocol was presented and, as previously mentioned, inbred mice can have very long telomeres making them relatively easy to detect. 37,38
FISH has also been combined with flow cytometry for the detection of repetitive DNA sequences 66,67 and this methodology has been adapted to the quantitation of telomeres in interphase cells (flow-FISH). 34-36 Advantages of this method include its high-throughput nature and ability to examine nondividing cells. Flow-FISH has become the method of choice for measuring telomeres in inbred mouse strains that possess extremely long telomeres. 47,68-70 However, this method is primarily restricted to the use of sizeable numbers of hematopoietic cells, cultured cells, or nucleated blood cells. In addition, the FISH denaturation conditions tend to preclude the detection of secondary signals, such as cell surface antigens, although enrichment strategies using flow-sorting before FISH may be an option. 71
Although all of the methods outlined above have particular strengths, we desired a new quantitative method that would be applicable to standard formalin-fixed human tissue specimens to exploit the vast array of archival human pathological material available. To this end, we developed a combined FISH/immunofluorescence method (TELI-FISH) applicable to standard formalin-fixed, paraffin-embedded human tissue specimens. We validated this technique using a series of human cancer-cell culture lines possessing known telomere lengths, and applied it to a human prostate tissue microarray containing matched normal/tumor pairs. For the first time, we were able to directly compare telomere lengths in prostate cancer cells to those in matched normal appearing epithelial cells. The data were in general agreement with previous studies using complex cell mixtures. 41,50,51
Internal standards could potentially be incorporated into the experimental protocol, allowing for the measurement of absolute, as opposed to relative, telomere lengths. If tissue microarrays are being used, then a panel of cell lines having known telomere lengths could be included on the array, allowing the generation of a standard curve. This would also allow comparisons to be made between different experiments and different laboratories.
Our method of direct assessment of telomere lengths in fixed tissue samples should be useful for testing hypotheses implicating telomere shortening in age-related pathologies, tumorigenesis, cancer progression, and may eventually provide useful diagnostic or prognostic information. TEL-FISH could also be useful for predicting the potential efficacy of telomerase inhibition therapies in cancer using diagnostic biopsy specimens because tumors with very long telomeres, or having large intratumoral cell-cell telomere length heterogeneity, may be resistant to such therapies.
Acknowledgments
We thank Dr. Joel Nelson for his generous gift of androgen-deprived LNCaP sublines; Dr. Donald S. Coffey and Dr. Shawn Lupold for helpful comments and critical reading of the manuscript; Don Vindivich for his expert technical assistance; Mathew Putzi, Helen Fedor, and Marcella Southerland for diligent efforts in tissue microarray production; Manisha Chaudhari for help with image analysis; and Dr. John Isaacs for samples of the human prostate PC-82 xenograft. We also owe a great debt to the late Dr. R. C. Haggitt 72 who pioneered the in situ analysis of telomeres in human archival tissues. His presence in the field of pathology will be sorely missed.
Footnotes
Address reprint requests to Angelo M. De Marzo, M.D., Ph.D., Department of Pathology, Division of Genitourinary Pathology, Bunting/Blaustein Cancer Research Building, Room 153, 1650 Orleans St., Baltimore, MD 21231-1000. E-mail: ademarz@jhmi.edu.
Supported by the Public Health Service (National Institutes of Health/National Cancer Institute grants K08CA78588, CA84997, DK07552, National Cancer Institute SPORE grant no. P50CA58236) and the Charlotte Geyer Foundation (to A.M.D.).
References
- 1.de Lange T: Telomeres and senescence: ending the debate. Science 1998, 279:334-335 [DOI] [PubMed] [Google Scholar]
- 2.DePinho RA: The age of cancer. Nature 2000, 408:248-254 [DOI] [PubMed] [Google Scholar]
- 3.Greider CW: Telomeres and senescence: the history, the experiment, the future. Curr Biol 1998, 8:R178-R181 [DOI] [PubMed] [Google Scholar]
- 4.Harley CB, Villeponteau B: Telomeres and telomerase in aging and cancer. Curr Opin Genet Dev 1995, 5:249-255 [DOI] [PubMed] [Google Scholar]
- 5.Shay JW: Aging and cancer: are telomeres and telomerase the connection? Mol Med Today 1995, 1:378-384 [DOI] [PubMed] [Google Scholar]
- 6.Blackburn EH: Structure and function of telomeres. Nature 1991, 350:569-572 [DOI] [PubMed] [Google Scholar]
- 7.Olovnikov AM: Principle of marginotomy in template synthesis of polynucleotides. Dokl Akad Nauk SSSR 1971, 201:1496-1499 [PubMed] [Google Scholar]
- 8.Olovnikov AM: A theory of marginotomy: the incomplete copying of template margin in enzymatic synthesis of polynucleotides and biological significance of the phenomenon. J Theor Biol 1973, 41:181-190 [DOI] [PubMed] [Google Scholar]
- 9.Watson JD: Origin of concatemeric T7 DNA. Nat New Biol 1972, 239:197-201 [DOI] [PubMed] [Google Scholar]
- 10.Levy MZ, Allsopp RC, Futcher AB, Greider CW, Harley CB: Telomere end-replication problem and cell aging. J Mol Biol 1992, 225:951-960 [DOI] [PubMed] [Google Scholar]
- 11.Kruk PA, Rampino NJ, Bohr VA: DNA damage and repair in telomeres: relation to aging. Proc Natl Acad Sci USA 1995, 92:258-262 [DOI] [PMC free article] [PubMed] [Google Scholar]
- 12.von Zglinicki T, Saretzki G, Docke W, Lotze C: Mild hyperoxia shortens telomeres and inhibits proliferation of fibroblasts: a model for senescence? Exp Cell Res 1995, 220:186-193 [DOI] [PubMed] [Google Scholar]
- 13.von Zglinicki T, Pilger R, Sitte N: Accumulation of single-strand breaks is the major cause of telomere shortening in human fibroblasts. Free Radic Biol Med 2000, 28:64-74 [DOI] [PubMed] [Google Scholar]
- 14.Greider CW, Blackburn EH: A Telomeric sequence in the RNA of Tetrahymena telomerase required for telomere repeat synthesis. Nature 1989, 337:331-336 [DOI] [PubMed] [Google Scholar]
- 15.Greider CW, Blackburn EH: Identification of a specific telomere terminal transferase activity in Tetrahymena extracts. Cell 1985, 43:405-413 [DOI] [PubMed] [Google Scholar]
- 16.Lundblad V, Blackburn EH: An alternative pathway for yeast telomere maintenance rescues est1-senescence. Cell 1993, 73:347-360 [DOI] [PubMed] [Google Scholar]
- 17.Bryan TM, Englezou A, Gupta J, Bacchetti S, Reddel RR: Telomere elongation in immortal human cells without detectable telomerase activity. EMBO J 1995, 14:4240-4248 [DOI] [PMC free article] [PubMed] [Google Scholar]
- 18.Bryan TM, Englezou A, Dalla-Pozza L, Dunham MA, Reddel RR: Evidence for an alternative mechanism for maintaining telomere length in human tumors and tumor-derived cell lines. Nat Med 1997, 3:1271-1274 [DOI] [PubMed] [Google Scholar]
- 19.Bryan TM, Marusic L, Bacchetti S, Namba M, Reddel RR: The telomere lengthening mechanism in telomerase-negative immortal human cells does not involve the telomerase RNA subunit. Hum Mol Genet 1997, 6:921-926 [DOI] [PubMed] [Google Scholar]
- 20.Reddel RR, Bryan TM, Colgin LM, Perrem KT, Yeager TR: Alternative lengthening of telomeres in human cells. Radiat Res 2001, 155:194-200 [DOI] [PubMed] [Google Scholar]
- 21.Steinert S, Shay JW, Wright WE: Transient expression of human telomerase extends the life span of normal human fibroblasts. Biochem Biophys Res Commun 2000, 273:1095-1098 [DOI] [PubMed] [Google Scholar]
- 22.Bodnar AG, Ouellette M, Frolkis M, Holt SE, Chiu CP, Morin GB, Harley CB, Shay JW, Lichtsteiner S, Wright WE: Extension of life-span by introduction of telomerase into normal human cells. Science 1998, 279:349-352 [DOI] [PubMed] [Google Scholar]
- 23.Vaziri H, Benchimol S: Reconstitution of telomerase activity in normal human cells leads to elongation of telomeres and extended replicative life span. Curr Biol 1998, 8:279-282 [DOI] [PubMed] [Google Scholar]
- 24.Kiyono T, Foster SA, Koop JI, McDougall JK, Galloway DA, Klingelhutz AJ: Both Rb/p16INK4a inactivation and telomerase activity are required to immortalize human epithelial cells. Nature 1998, 396:84-88 [DOI] [PubMed] [Google Scholar]
- 25.Kim NW, Piatyszek MA, Prowse KR, Harley CB, West MD, Ho PL, Coviello GM, Wright WE, Weinrich SL, Shay JW: Specific association of human telomerase activity with immortal cells and cancer. Science 1994, 266:2011-2015 [DOI] [PubMed] [Google Scholar]
- 26.Shay JW, Bacchetti S: A survey of telomerase activity in human cancer. Eur J Cancer 1997, 33:787-791 [DOI] [PubMed] [Google Scholar]
- 27.Meeker AK, Coffey DS: Telomerase: a promising marker of biological immortality of germ, stem, and cancer cells. A review. Biochemistry 1997, 62:1323-1331 [PubMed] [Google Scholar]
- 28.Lansdorp PM, Verwoerd NP, van de Rijke FM, Dragowska V, Little MT, Dirks RW, Raap AK, Tanke HJ: Heterogeneity in telomere length of human chromosomes. Hum Mol Genet 1996, 5:685-691 [DOI] [PubMed] [Google Scholar]
- 29.Martens UM, Zijlmans JM, Poon SS, Dragowska W, Yui J, Chavez EA, Ward RK, Lansdorp PM: Short telomeres on human chromosome 17p. Nat Genet 1998, 18:76-80 [DOI] [PubMed] [Google Scholar]
- 30.Poon SS, Martens UM, Ward RK, Lansdorp PM: Telomere length measurements using digital fluorescence microscopy. Cytometry 1999, 36:267-278 [DOI] [PubMed] [Google Scholar]
- 31.Zijlmans JM, Martens UM, Poon SS, Raap AK, Tanke HJ, Ward RK, Lansdorp PM: Telomeres in the mouse have large inter-chromosomal variations in the number of T2AG3 repeats. Proc Natl Acad Sci USA 1997, 94:7423-7428 [DOI] [PMC free article] [PubMed] [Google Scholar]
- 32.Slijepcevic P, Hande MP, Bouffler SD, Lansdorp P, Bryant PE: Telomere length, chromatin structure and chromosome fusigenic potential. Chromosoma 1997, 106:413-421 [DOI] [PubMed] [Google Scholar]
- 33.de Pauw ES, Verwoerd NP, Duinkerken N, Willemze R, Raap AK, Fibbe WE, Tanke HJ: Assessment of telomere length in hematopoietic interphase cells using in situ hybridization and digital fluorescence microscopy. Cytometry 1998, 32:163-169 [DOI] [PubMed] [Google Scholar]
- 34.Rufer N, Dragowska W, Thornbury G, Roosnek E, Lansdorp PM: Telomere length dynamics in human lymphocyte subpopulations measured by flow cytometry. Nature Biotechnol 1998, 16:743-747 [DOI] [PubMed] [Google Scholar]
- 35.Rufer N, Brummendorf TH, Kolvraa S, Bischoff C, Christensen K, Wadsworth L, Schulzer M, Lansdorp PM: Telomere fluorescence measurements in granulocytes and T lymphocyte subsets point to a high turnover of hematopoietic stem cells and memory T cells in early childhood. J Exp Med 1999, 190:157-167 [DOI] [PMC free article] [PubMed] [Google Scholar]
- 36.Hultdin M, Gronlund E, Norrback K, Eriksson-Lindstrom E, Just T, Roos G: Telomere analysis by fluorescence in situ hybridization and flow cytometry. Nucleic Acids Res 1998, 26:3651-3656 [DOI] [PMC free article] [PubMed] [Google Scholar]
- 37.Gonzalez-Suarez E, Samper E, Flores JM, Blasco MA: Telomerase-deficient mice with short telomeres are resistant to skin tumorigenesis. Nat Genet 2000, 26:114-117 [DOI] [PubMed] [Google Scholar]
- 38.Gonzalez-Suarez E, Samper E, Ramirez A, Flores JM, Martin-Caballero J, Jorcano JL, Blasco MA: Increased epidermal tumors and increased skin wound healing in transgenic mice overexpressing the catalytic subunit of telomerase, mTERT, in basal keratinocytes. EMBO J 2001, 20:2619-2630 [DOI] [PMC free article] [PubMed] [Google Scholar]
- 39.Ruijter ET, Miller GJ, Aalders TW, van de Kaa CA, Schalken JA, Debruyne FM, Boon ME: Rapid microwave-stimulated fixation of entire prostatectomy specimens. Biomed-II MPC Study Group. J Pathol 1997, 183:369-375 [DOI] [PubMed] [Google Scholar]
- 40.Kononen J, Bubendorf L, Kallioniemi A, Barlund M, Schraml P, Leighton S, Torhorst J, Mihatsch MJ, Sauter G, Kallioniemi OP: Tissue microarrays for high-throughput molecular profiling of tumor specimens. Nat Med 1998, 4:844-847 [DOI] [PubMed] [Google Scholar]
- 41.Sommerfeld HJ, Meeker AK, Piatyszek MA, Bova GS, Shay JW, Coffey DS: Telomerase activity: a prevalent marker of malignant human prostate tissue. Cancer Res 1996, 56:218-222 [PubMed] [Google Scholar]
- 42.Meeker AK: Telomere Dynamics and Androgen Regulation of Telomerase Enzymatic Activity in Normal and Pathological States of the Prostate. Department of Pharmacology. 2001, :p 265 Johns Hopkins University School of Medicine, Baltimore [Google Scholar]
- 43.Counter C, Avilion A, LeFeuvre C, Stewart N, Greider C, Harley C, Bacchetti S: Telomere shortening associated with chromosome instability is arrested in immortal cells which express telomerase activity. EMBO J 1992, 11:1921-1929 [DOI] [PMC free article] [PubMed] [Google Scholar]
- 44.Allshire RC, Dempster M, Hastie ND: Human telomeres contain at least three types of G-rich repeat distributed non-randomly. Nucleic Acids Res 1989, 17:4611-4627 [DOI] [PMC free article] [PubMed] [Google Scholar]
- 45.Murnane JP, Sabatier L, Marder BA, Morgan WF: Telomere dynamics in an immortal human cell line. EMBO J 1994, 13:4953-4962 [DOI] [PMC free article] [PubMed] [Google Scholar]
- 46.Brown WR, MacKinnon PJ, Villasante A, Spurr N, Buckle VJ, Dobson MJ: Structure and polymorphism of human telomere-associated DNA. Cell 1990, 63:119-132 [DOI] [PubMed] [Google Scholar]
- 47.Starling JA, Maule J, Hastie ND, Allshire RC: Extensive telomere repeat arrays in mouse are hypervariable. Nucleic Acids Res 1990, 18:6881-6888 [DOI] [PMC free article] [PubMed] [Google Scholar]
- 48.Slijepcevic P, Hande MP: Chinese hamster telomeres are comparable in size to mouse telomeres. Cytogenet Cell Genet 1999, 85:196-199 [DOI] [PubMed] [Google Scholar]
- 49.Wright WE, Shay JW: Telomere dynamics in cancer progression and prevention: fundamental differences in human and mouse telomere biology. Nat Med 2000, 6:849-851 [DOI] [PubMed] [Google Scholar]
- 50.Engelhardt M, Albanell J, Drullinsky P, Han W, Guillem J, Scher HI, Reuter V, Moore MA: Relative contribution of normal and neoplastic cells determines telomerase activity and telomere length in primary cancers of the prostate, colon, and sarcoma. Clin Cancer Res 1997, 3:1849-57 [PubMed] [Google Scholar]
- 51.Koeneman KS, Pan CX, Jin JK, Pyle JM, Flanigan RC, Shankey TV, Diaz MO: Telomerase activity, telomere length, and DNA ploidy in prostatic intraepithelial neoplasia (PIN). J Urol 1998, 160:1533-1539 [PubMed] [Google Scholar]
- 52.Hastie N, Dempster M, Dunlop M, Thompson A, Green D, Alshire R: Telomere reduction in human colorectal carcinoma and with ageing. Nature 1990, 346:866-868 [DOI] [PubMed] [Google Scholar]
- 53.Allsopp RC, Chang E, Kashefi-Aazam M, Rogaev EI, Piatyszek MA, Shay JW, Harley CB: Telomere shortening is associated with cell division in vitro and in vivo. Exp Cell Res 1995, 220:194-200 [DOI] [PubMed] [Google Scholar]
- 54.Henderson S, Allsopp R, Spector D, Wang SS, Harley C: In situ analysis of changes in telomere size during replicative aging and cell transformation. J Cell Biol 1996, 134:1-12 [DOI] [PMC free article] [PubMed] [Google Scholar]
- 55.Harley CB, Futcher AB, Greider CW: Telomeres shorten during ageing of human fibroblasts. Nature 1990, 345:458-460 [DOI] [PubMed] [Google Scholar]
- 56.de Lange T, Shiue L, Myers RM, Cox DR, Naylor SL, Killery AM, Varmus HE: Structure and variability of human chromosome ends. Mol Cell Biol 1990, 10:518-527 [DOI] [PMC free article] [PubMed] [Google Scholar]
- 57.Bryant JE, Hutchings KG, Moyzis RK, Griffith JK: Measurement of telomeric DNA content in human tissues. Biotechniques 1997, 23:476-482 [DOI] [PubMed] [Google Scholar]
- 58.Norwood D, Dimitrov DS: Sensitive method for measuring telomere lengths by quantifying telomeric DNA content of whole cells. Biotechniques 1998, 25:1040-1045 [DOI] [PubMed] [Google Scholar]
- 59.Wan TS, Martens UM, Poon SS, Tsao SW, Chan LC, Lansdorp PM: Absence or low number of telomere repeats at junctions of dicentric chromosomes. Genes Chromosom Cancer 1999, 24:83-86 [DOI] [PubMed] [Google Scholar]
- 60.Hande MP, Samper E, Lansdorp P, Blasco MA: Telomere length dynamics and chromosomal instability in cells derived from telomerase null mice. J Cell Biol 1999, 144:589-601 [DOI] [PMC free article] [PubMed] [Google Scholar]
- 61.Buchardt O, Egholm M, Berg RH, Nielsen PE: Peptide nucleic acids and their potential applications in biotechnology. Trends Biotechnol 1993, 11:384-386 [DOI] [PubMed] [Google Scholar]
- 62.Therkelsen AJ, Nielsen A, Koch J, Hindkjaer J, Kolvraa S: Staining of human telomeres with primed in situ labeling (PRINS). Cytogenet Cell Genet 1995, 68:115-118 [DOI] [PubMed] [Google Scholar]
- 63.Krejci K, Koch J: An in situ study of variant telomeric repeats in human chromosomes. Genomics 1999, 58:202-206 [DOI] [PubMed] [Google Scholar]
- 64.Krejci K, Koch J: Improved detection and comparative sizing of human chromosomal telomeres in situ. Chromosoma 1998, 107:198-203 [DOI] [PubMed] [Google Scholar]
- 65.Serakinci N, Koch J: Detection and sizing of telomeric repeat DNA in situ. Nature Biotechnol 1999, 17:200-201 [DOI] [PubMed] [Google Scholar]
- 66.van Dekken H, Arkesteijn GJ, Visser JW, Bauman JG: Flow cytometric quantification of human chromosome specific repetitive DNA sequences by single and bicolor fluorescent in situ hybridization to lymphocyte interphase nuclei. Cytometry 1990, 11:153-164 [DOI] [PubMed] [Google Scholar]
- 67.Arkesteijn GJ, Erpelinck SL, Martens AC, Hagenbeek A: Chromosome specific DNA hybridization in suspension for flow cytometric detection of chimerism in bone marrow transplantation and leukemia. Cytometry 1995, 19:353-360 [DOI] [PubMed] [Google Scholar]
- 68.Kipling D, Cooke HJ: Hypervariable ultra-long telomeres in mice. Nature 1990, 347:400-402 [DOI] [PubMed] [Google Scholar]
- 69.Rudolph KL, Chang S, Lee HW, Blasco M, Gottlieb GJ, Greider C, DePinho RA: Longevity, stress response, and cancer in aging telomerase-deficient mice. Cell 1999, 96:701-712 [DOI] [PubMed] [Google Scholar]
- 70.Goytisolo FA, Samper E, Martin-Caballero J, Finnon P, Herrera E, Flores JM, Bouffler SD, Blasco MA: Short telomeres result in organismal hypersensitivity to ionizing radiation in mammals. J Exp Med 2000, 192:1625-1636 [DOI] [PMC free article] [PubMed] [Google Scholar]
- 71.Lauzon W, Sanchez Dardon J, Cameron DW, Badley AD: Flow cytometric measurement of telomere length. Cytometry 2000, 42:159–164 [DOI] [PubMed]
- 72.Bronner MP: Rodger C. Haggitt: a biography. Hum Pathol 2000, 31:1185–1187 [DOI] [PubMed]