Imaging the Single Cell Dynamics of CD4+ T Cell Activation by Dendritic Cells in Lymph Nodes (original) (raw)
Abstract
The adaptive immune response is initiated in secondary lymphoid organs by contact between antigen-bearing dendritic cells (DCs) and antigen-specific CD4+ T cells. However, there is scant information regarding the single cell dynamics of this process in vivo. Using two-photon microscopy, we imaged the real-time behavior of naive CD4+ T cells and in vivo–labeled DCs in lymph nodes during a robust T cell response. In the first 2 h after entry into lymph nodes, T cells made short-lived contacts with antigen-bearing DCs, each contact lasting an average of 11–12 min and occurring mainly on dendrites. Altered patterns of T cell motility during this early stage of antigen recognition promoted serial engagement with several adjacent DCs. Subsequently, T cell behavior progressed through additional distinct stages, including long-lived clusters, dynamic swarms, and finally autonomous migration punctuated by cell division. These observations suggest that the immunological synapse in native tissues is remarkably fluid, and that stable synapses form only at specific stages of antigen presentation to T cells. Furthermore, the serial nature of these interactions implies that T cells activate by way of multiple antigen recognition events.
Keywords: two-photon microscopy, T lymphocyte, immunological synapse, lymph node, antigen presentation
Introduction
DCs ingest antigens in peripheral tissues and, in response to inflammatory signals, migrate to lymph nodes where they present MHC-bound peptide antigens to recirculating T cells (1). Within the paracortex of the lymph node, cognate physical interactions between naive CD4+ T cells and antigen-bearing DCs trigger the adaptive immune response. In vitro observations using cell culture systems have provided a wealth of molecular detail, and yet, the in vivo cellular dynamics of this central process remain poorly understood (2–4).
A crucial question concerns the duration, stability, and number of T cell–DC contacts required to achieve full activation. The bulk of experimental evidence is derived from in vitro experiments and suggests that activation requires a stable long-lived immunological synapse (IS; references 5–8). Observations of fixed lymph node tissue sections (9–11) and of conjugate T cell–DC clusters isolated from dissociated lymph nodes (12) also support this view. In contrast, Gunzer et al. and Freidl et al. (13, 14) showed that serial and short-lived contacts with DCs were sufficient to activate CD4+ T cells in collagen gels. Ultimately, time-resolved single cell observations within intact lymphoid tissues are necessary to resolve this issue. Two-photon laser microscopy now makes this possible (15–18).
We recently described an in vivo method to fluorescently label migratory DCs that carry antigen from peripheral tissues to lymph nodes in response to inflammation and analyzed interactions between labeled DCs and CD4+ T cells in the lymph node in the absence of antigen (19). Those experiments showed that, in the absence of antigen, migrating T cells made brief, random contacts with DCs and that dynamic changes in DC morphology substantially increased the number of contacts, a mechanism that we have termed stochastic repertoire scanning (19–21). Here, we compare antigen-independent interactions with cognate interactions between in vivo–labeled DCs and naive CD4+ T cells during an immune response. Our approach resolves the single cell kinetics of individual antigen recognition events in lymph nodes and reveals that CD4+ T cell activation progresses through several distinct stages.
Materials and Methods
Antigen Priming and In Vivo Labeling of Endogenous DCs.
BALB/c mice (Jackson ImmunoResearch Laboratories) were immunized with chicken OVA (100 μg unless otherwise stated; Sigma-Aldrich) adsorbed to alum (50 μl as a 1.3% suspension; Accurate Chemical and Scientific Corp.), containing 1 μg of recombinant murine TNF-α (R&D Systems), 2.5 μg of recombinant murine Flt-3 ligand (R&D Systems), and 12.5 μg CFSE (Molecular Probes) to label endogenous DCs (green fluorescence). Subcutaneous injections were administered, performed at the scruff of the neck (30 μl) and intradermally (20 μl) in the ear while maintaining the mouse under methoxyflurane (Metafane) anesthesia (20). For control experiments, OVA was omitted from the adjuvant–dye mixture.
Transgenic T Cells and Recipient Mice.
CD4+ T cells specific for OVA were isolated from DO11.10 transgenic mice (Jackson ImmunoResearch Laboratories; reference 22) by magnetic negative selection (Miltenyi Biotec). After labeling with 5-(and-6)-{[(4-chloromethyl) benzol] amino} tetramethylrhodamine (CMTMR; 8 μM for 45 min at 37°C; red fluorescence; Molecular Probes), 2–3 × 10⁶ T cells were transferred by tail vein injection into 4–6-wk-old BALB/c recipient mice that had been immunized or sham-treated 18–24 h previously as described before.
Two-Photon Microscopy and Image Analysis.
Mice were killed by CO2 asphyxiation at various times after T cell transfer. Cervical or inguinal lymph nodes were removed and maintained at 36°C under superfused medium bubbled with 95% O2/5% CO2 for multidimensional (x, y, z, time, and emission wavelength) two-photon microscopy as described previously (15). Image acquisition, morphometric analysis, and cell tracking were performed using Metamorph software (Universal Imaging Corp.). T cell–DC contacts were visualized in three dimensions at different times, using either a fully rendered multidimensional dataset (Imaris; Bitplane) or a scheme in which depth information was color encoded by assigning red, green, and blue to overlapping segments (top, middle, and bottom) of monochrome z-stacks, resulting in a “top view” projection with a five-color spectrum in which each color represents a 15-μm depth within the imaging volume (20). Cells were tracked over time manually from maximum intensity top-view image sequences. Instantaneous velocities were calculated from the distance moved between successive time points (∼27 s each). Motility coefficients (M) were calculated from time lapse records using the formula M = x2/4t, where x = mean displacement of individual T cells from their initial origins at time t (15). The surface areas of DC–T cell contacts were estimated assuming circular geometry and measuring the length of membrane apposition in two-photon sections. All measurements are presented as mean ± 1 SEM.
Assays for T Cell Activation.
The early activation marker CD69 was assessed on CD4+ T cells by flow cytometry using a CD69-specific FITC-conjugated antibody (BD Biosciences). To assess T cell proliferation in vivo, ∼8 × 10⁶ OVA-specific CFSE-labeled (5 μM for 45 min at 37°C; Molecular Probes) T cells were adoptively transferred into 4–6-wk-old BALB/c recipient mice ∼24 h after OVA challenge or sham treatment. Proliferation was assessed 1–5 d later by CFSE dilution with a two-color analysis protocol using the TCR-specific antibody, KJ1-26 (Caltag) to exclude irrelevant cells. To test for T cell effector function, CFSE-labeled DO11.10 T cells were transferred into OVA-challenged or sham-treated mice, and mice were rechallenged 8 d later in the ear pinna with 60 μg of soluble OVA. On day 9, delayed-type hypersensitivity (DTH) was assessed by measuring ear thickness with a micrometer. Ears were subsequently placed in RPMI 1640 medium, and the dermal layers were separated to release cells from the DTH site. These cells were stained with the KJ1-26 antibody and the degree of proliferation of OVA-specific cells determined by FACS.
Online Supplemental Material.
Nine time lapse videos illustrate many of the key findings. Video S1 illustrates the kinetics of T cell homing to a draining inguinal lymph node. Video S2 shows stochastic T cell repertoire scanning in the absence of OVA. Video S3 provides a side-by-side comparison of T cell motility in the presence and absence of antigen. Video S4 depicts early cognate interactions (1–3 h) between antigen-specific T cells and DCs in the draining lymph node of OVA-challenged mice. Video S5 shows T cells forming dynamic clusters on DC dendrites at later times (8 h) in OVA-challenged mice. Video S6 shows that clusters are less apparent in experiments with reduced amounts of OVA. Video S7 shows that OVA-specific T cells regain motility and move in “swarms” near DCs (16 h). Video S8 shows reduced T cell–DC interaction 24 h after adoptive transfer. Video S9 depicts T cell motility and proliferation 26 h after adoptive transfer. Online supplemental material is available at http://www.jem.org/cgi/content/full/jem.20041236/DC1.
Results
Our primary objective was to describe cell behavior and interactions in native tissues during T cell priming, from initial contact with antigen-bearing DCs to cell division. To accomplish this, we used two-photon microscopy to image OVA-specific CD4+ T cells with endogenous DCs in intact lymph nodes. Because it is not currently possible to monitor continuously a given T cell from initial contact with an antigen-bearing DC to cell division, we used an experimental protocol (Fig. 1 A) designed to synchronize responses within the adoptively transferred T cell population. The key features of this approach are as follows: (a) the use of abundant antigen (∼100 μg of OVA, bound to alum) to activate a majority of antigen-specific T cells in the system, and (b) the adoptive transfer of T cells only after allowing sufficient time (18–24 h) for antigen-bearing DCs to traffic to the lymph node (19). This procedure also avoided the presence of soluble antigen within the lymph node (23, 24) and ensured that the DC pool arriving from the periphery contained CFSE-labeled DCs that were competent to present antigen (19).
Figure 1.
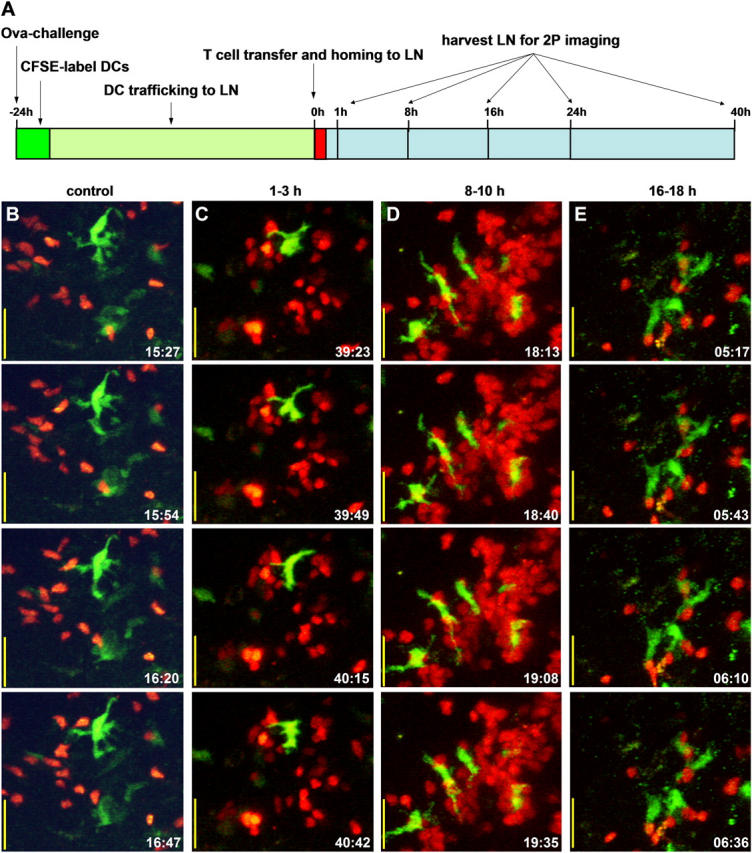
Two-photon imaging of T cell activation in the lymph node. (A) Time line of our experimental protocol. (B–E) Time lapse images of T cells (red) and DCs (green), displayed as maximum intensity projections along the z axis (top view) through image stacks encompassing a volume of 120 × 100 × 75 μm (x, y, z) in the lymph node. Each column shows individual “snapshots,” acquired at the times indicated (in min:s) within a continuous time lapse sequence. The sequence in B illustrates noncognate interactions in the absence of antigen. Image sequences in C–E illustrate the main stages of cognate T cell–DC interactions observed in nodes from OVA-primed mice at respective times of 1, 8, and 16 h after adoptive transfer of DO11.10 T cells. Bars, 25 μm.
Within 1 h of adoptive transfer, most T cells homed to lymph nodes and few remained in the circulation (Video S1, available at http://www.jem.org/cgi/content/full/jem.20041236/DC1). Thus, the great majority of labeled T cells in the draining node encounter antigen-bearing DCs at approximately the same time, thereby synchronizing their responses. Moreover, this period of synchronization would persist during the first day because T cells that had initially homed to nondraining nodes remain sequestered there for ∼24 h (25). We imaged T cells and DCs in lymph nodes during continuous periods of 30 min–2.5 h at different times after T cell transfer (time zero). As illustrated in Fig. 1, B–E, and Videos S2–S7 (available at http://www.jem.org/cgi/content/full/jem.20041236/DC1), T cells exposed to cognate antigen progress through distinct stages defined by their behavior. In the following sections, we describe these stages in sequential order, provide a quantitative comparison of T cell behavior at each stage, and conclude with an assessment of T cell activation induced by this immunization protocol.
Default T Cell Trafficking and Antigen-independent DC Interactions in the Lymph Node.
As a prelude to examining antigen-induced T cell behaviors, we first established whether T cells exhibited time-dependent changes after adoptive transfer and homing in the absence of cognate antigen.
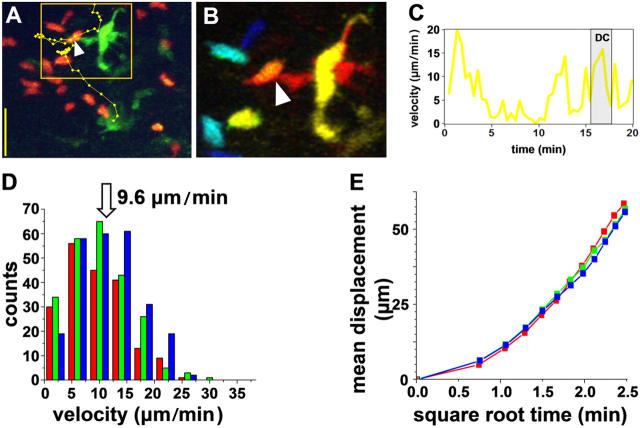
Fig. 2 shows examples of noncognate interactions between T cells and DCs, and illustrates our procedure for cell tracking and contact analysis. Individual T cell tracks are superimposed on true-color images (Fig. 2 A, dotted lines), and contacts between T cells and DCs (arrowheads) were confirmed if both cells were at the same depth in depth-encoded images (Fig. 2 B). As reported previously (19), T cells encountered DCs randomly, decelerating only slightly while in contact with DCs, and quickly migrated away after ∼3 min (Fig. 2 C and Video S2). T cells from sham-immunized mice showed no significant change in T cell velocity (averaging 9.6 μm/min−1; Fig. 2 D), motility coefficient (Fig. 2 E), or contact duration with DCs (averaging 3.2 min) when imaged at 2, 8, 12, 18, or 24 h after adoptive transfer. This description of baseline naive T cell behavior serves as a basis of comparison with cognate interactions in OVA-primed mice.
Figure 2.
Noncognate interactions at various times after T cell homing. (A–C) Representative interactions between T cells and DCs 12 h after adoptive transfer in a control mouse without antigen. (A) True-color image of a single time point showing a T cell (red) contacting a DC (green) with a superimposed track showing the position of the T cell at 27-s intervals. Bar, 25 μm. (B) Pseudo-colored image showing an enlarged portion of the image in A, with depth of cells in the imaging volume encoded on a “rainbow” scale (top, red, and bottom, blue). Arrow marks a contact between the T cell and DC. (C) Changes in instantaneous velocity of the T cell tracked in A. Shaded region corresponds to the time the T cell was contacting the DC. (D) Distributions of instantaneous T cell velocities, measured at times of 1–3 h (red bars; n = 15 cells), 8–10 h (green; 16 cells), and 18–20 h (blue; 18 cells) after adoptive transfer. (E) Mean T cell displacement plotted as a function of the square root of time. Points fall on straight lines, consistent with random movement, and the slopes represent the motility coefficient. Data for different periods after adoptive transfer overlap closely.
Cognate Interactions at <2 h: Dynamic and Serial T Cell–DC Contacts.
In contrast with the default, noncognate interactions described before, distinct differences in T cell behavior were apparent within <2 h in the lymph nodes of OVA-challenged mice. Most T cells moved in characteristic looping patterns, making serial contacts with the same or with neighboring DCs (Fig. 3, A–D, and Videos S3 and S4). As a result, the overall T cell motility decreased sharply (mean velocity = 5.4 μm/min−1 and motility coefficient = 9.7 μm2/min−1: Fig. 3, G and H). Contacts occurred preferentially on DC dendrites, fluctuated rapidly in size over tens of seconds, and involved an average membrane area of ∼10 μm2. Interactions were more prolonged in the presence of antigen (mean: 11.4 min vs. 3.2 min in sham-immunized mice), but usually remained intermittent (Fig. 3, B and D), with the exception of a few T cells that showed associations lasting >1 h (e.g., Fig. 3, E and F). Perhaps the most striking observation is that interactions between T cells and dendritic cells are for the most part unstable early in the immune response.
Figure 3.
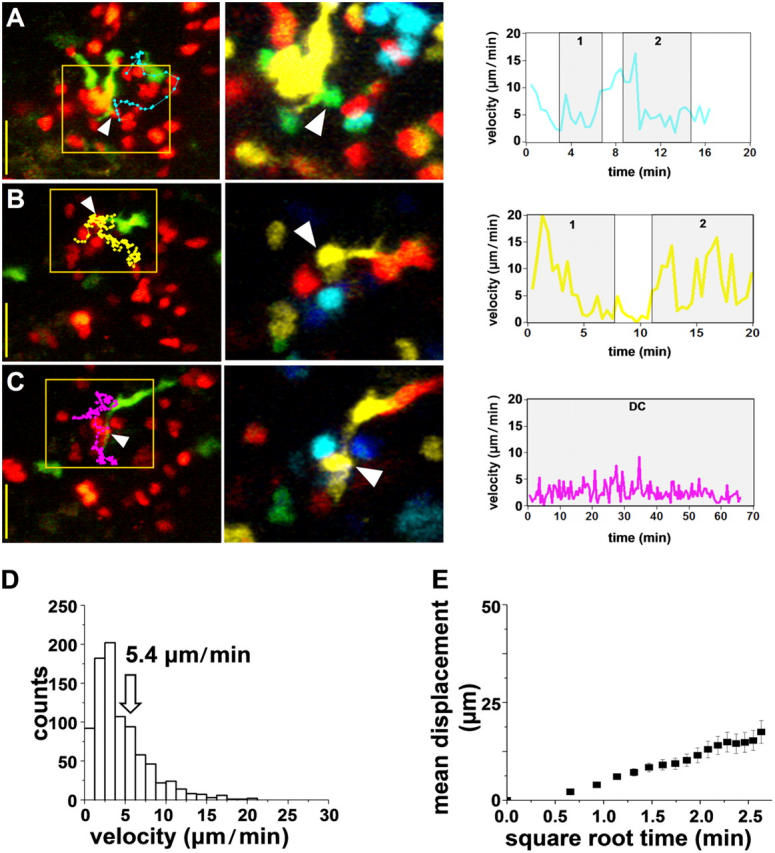
Early cognate interactions, 1–3 h. (A–C) Three examples of T cell–DC interactions imaged 1–3 h after adoptive transfer into an OVA-challenged mouse. Each row shows a true-color snapshot with overlain T cell track. Bars, 25 μm. Zoomed depth-encoded image and plot of T cell velocity with periods of DC contact shaded as in Fig. 2, A–C. Numbers indicate serial contacts with different DCs. (D) Distribution of instantaneous T cell velocities (n = 30 cells). (E) Mean displacement plotted as a function of the square root of time.
Interactions at 2–14 h: T Cell Clusters.
The next stage was characterized by the formation of dense T cell clusters around DCs (Fig. 4, A and B). Contact areas at this stage were roughly 16 μm2, and contact durations increased such that many T cells remained associated with DCs for longer than the typical duration (∼60 min) of our imaging sequence. Nevertheless, the T cell clusters were dynamic entities because cells continuously changed their relative positions and individual T cells were sometimes added or lost (Fig. 4, C and D, and Video S5). T cell–DC interactions were terminated either by the T cell moving away or by the DC withdrawing its dendrite. In some instances (Fig. 4, E and F), an entire cluster of T cells transferred from one DC to another (Video S5). T cells in clusters showed spherical morphology, and their movement resulted primarily from cells being carried along on migrating DCs. During this period, the average T cell velocity was only 2.6 μm/min (Fig. 4 G), and the motility coefficient was 2.3 μm2/min (Fig. 4 H).
Figure 4.
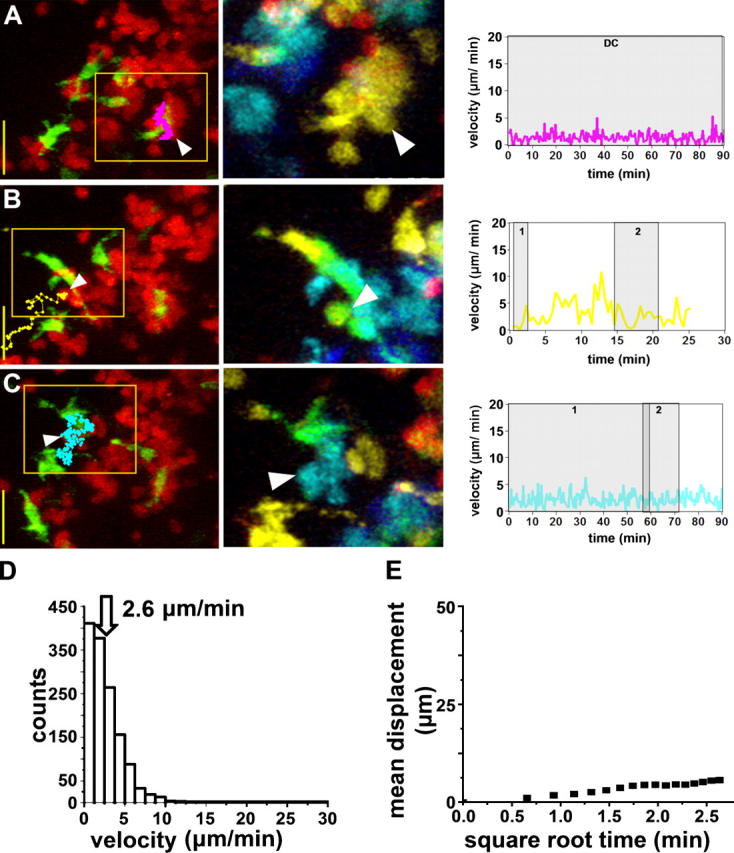
T cell clusters after T cell transfer. (A–E) Cognate T cell–DC interactions imaged 8–10 h after adoptive transfer into an OVA-challenged mouse. Images and measurements from 39 T cells were obtained as in Fig. 3. Numbers within shaded regions indicate serial contacts with different DCs. In C, a T cell contacts two DCs simultaneously between 58 and 60 min.
The aforementioned results were obtained with our standard immunization protocol (∼100 μg OVA), which produced clustering behavior in >80% of T cells. With lesser amounts of OVA (<10 μg), far fewer T cells were observed in clusters, and many were freely motile (Video S6).
Interactions at 16–24 h: T Cell Swarms.
By this time, the clusters had largely dissociated, and T cells were visibly enlarged. These T cell blasts moved slowly in a looping pattern within a local area (Fig. 5 and Video S7), a behavior we termed “swarming” (15). Although some cells remained stably associated with DCs (Fig. 5, A and B), most swarmed around DCs, making intermittent, sweeping contacts, often involving successive contacts with several DCs (Fig. 5, C–F). These contacts lasted on average 20 min and involved roughly 24 μm2 of membrane surface area. In comparison with the preceding cluster stage, T cell velocities increased to 4.1 μm/min, and the motility coefficient to 6.3 μm2/min.
Figure 5.
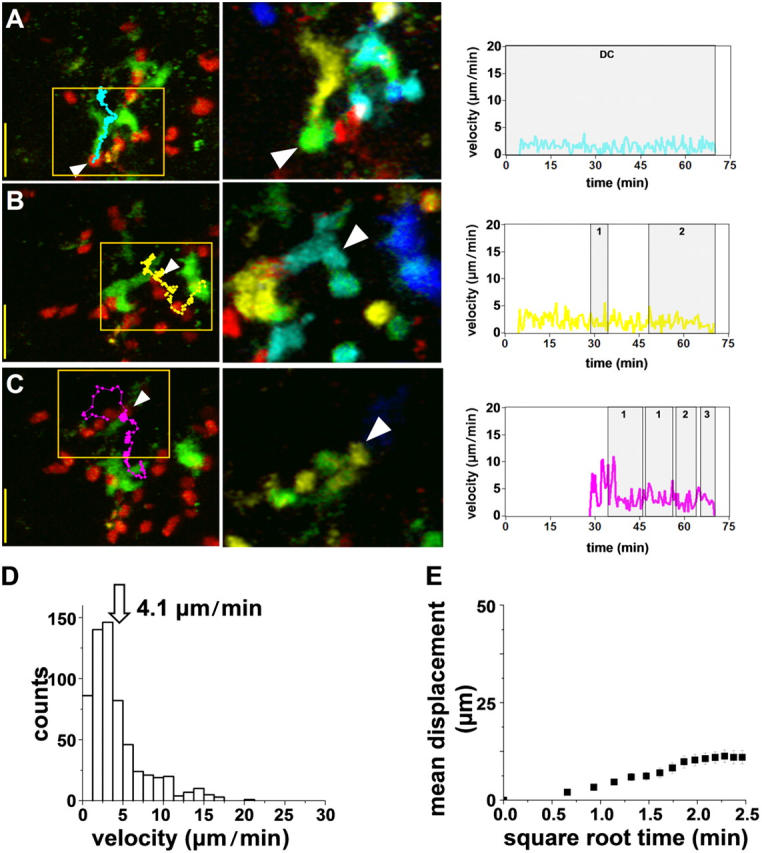
Late T cell swarms. (A–E) Cognate T cell–DC interactions imaged 16–18 h after adoptive transfer into an OVA-challenged mouse. Images and measurements from 23 cells were obtained as in Figs. 2–4.
T Cell Behaviors at >24 h: Proliferation and Resumption of Autonomous Motility.
After 24 h, T cell swarming behavior diminished and many T cell blasts migrated autonomously, making only infrequent, brief (mean ∼12 min) contacts with DCs (Fig. 6 and Video S8, available at http://www.jem.org/cgi/content/full/jem.20041236/DC1). The overall T cell velocity averaged 4.6 μm/min, but individual blasts often showed appreciably higher mean velocities (8–9 μm/min). At this time, we observed many instances of cell division (Fig. 6 E and Video 9, available at http://www.jem.org/cgi/content/full/jem.20041236/DC1). T cell blasts stopped abruptly, rounded up, paused for ∼15 min, and cleaved into daughter cells within ∼5 min. The daughter cells rapidly regained motility, sometimes trailing long membrane tethers as they moved away from each other. Finally, by 40 h, most T cells had undergone one or more rounds of division (assessed by dilution of CFSE fluorescence) and were migrating randomly with a mean velocity of 9.5 μm/min, similar to that of naive T cells (15).
Figure 6.
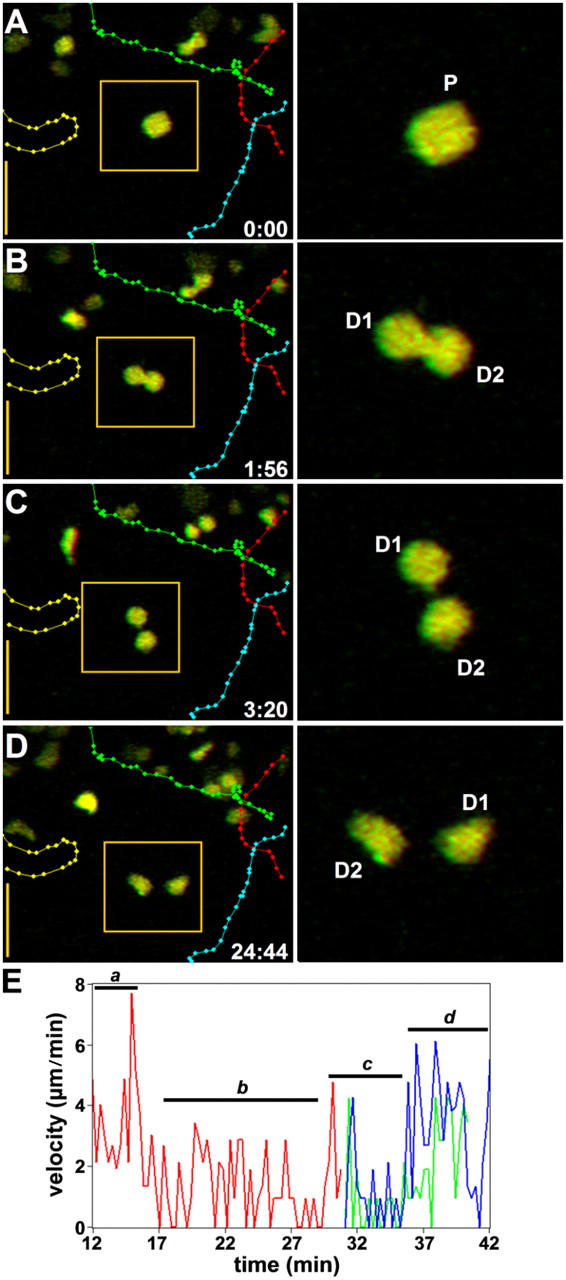
T cell proliferation and resumption of motility. (A–D) Time lapse sequence showing T cell motility and cell division 26 h after T cell transfer. (left) Full-frame images with superimposed tracks of four T cells (different colors). Bars, 25 μm. (right) Frames show an enlarged view of a T cell blast in the middle of the imaging volume (left, boxed area). Both sets of images are red-green anaglyphs and can be viewed through red-green stereoscopic glasses. This parental cell (P) undergoes cleavage over a period of ∼3 min (the time stamp shows elapsed time min:s) to produce two daughter cells (D1 and D2) that begin to move independently after ∼20 min. (E) Measurements from a different example of T cell division, showing changes in instantaneous velocity of a T cell blast (red trace) as it migrates (a), pauses (b), and divides (c) into daughter cells (blue and green traces) that each resume independent motility (d).
Progressive Changes in T Cell Motility and DC Contact Durations.
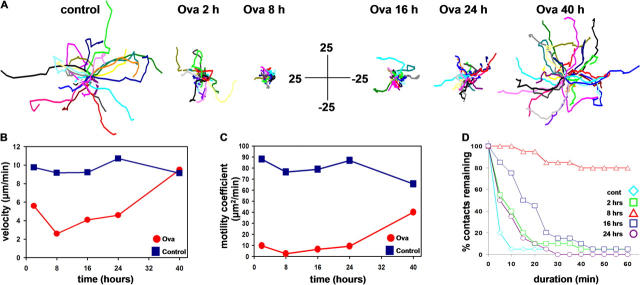
Fig. 7 summarizes the progressive changes in T cell velocity, motility coefficient, and DC contact duration throughout T cell priming. Changes in T cell motility are most readily apparent in the superimposed cell tracks shown in Fig. 7 A, and in the plot of motility coefficient (Fig. 7 C), which provides a measure of how far a cell would have moved on average from its starting point after any given time. In the absence of cognate antigen, T cells roamed widely along random paths with high motility coefficient, a strategy that enhances efficient scanning of the T cell repertoire (19–21). After transfer into OVA-challenged mice, T cell displacement decreased rapidly (Fig. 7 A), illustrated by the dramatic compression of cell tracks at 2 and 8 h. Motility gradually recovered as shown by cell tracks that covered a broader territory at 16, 24, and 40 h. By 40 h, most T cells had resumed autonomous migration, dispersing throughout the T cell region. The transient reduction in T cell velocity and motility coefficient (Fig. 7, B and C) retained T cells near antigen-bearing DCs, and was associated with increased T cell–DC contact durations (Fig. 7 D). In OVA-challenged mice, contact durations increased by 2 h and peaked at 8 h, by which time the majority of contacts lasted longer than the imaging record. After this clustering period, contact durations decreased to ∼20 min at 16 h, and further to ∼10 min at 24 h. Without OVA, T cell–DC interactions lasted only minutes, seen as a rapid decay in the contact persistence plot.
Figure 7.
Analysis of T cell motility at different stages of activation. (A) Tracks of individual T cells (different colors, normalized to their starting coordinates) showing representative motility of cells in control experiments (without OVA) and at various times as indicated in OVA-challenged mice. Bars are in micrometers. (B) Average instantaneous velocities of T cells in antigen-challenged (red) and control sham-treated mice (blue) as a function of time after adoptive transfer. (C) Corresponding measurements of motility coefficients, derived from plots of mean displacement against square root of time. (D) T cell–DC contact durations in control and OVA-immunized mice at various times (indicated by differently colored symbols) after adoptive transfer. Cumulative plots show the percentage of T cells that remained in contact for any given duration.
Population Measures of T Cell Activation, Proliferation, and Effector Function.
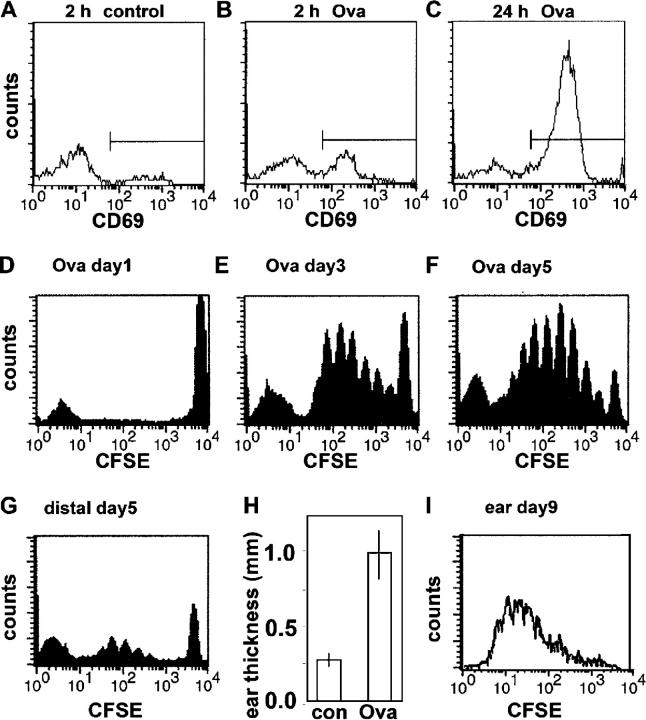
To correlate our single cell imaging data with functional measures of T cell activation, we assayed CD69 expression, proliferation, and DTH. By 2 h, ∼40% of antigen-specific T cells had up-regulated CD69 (Fig. 8 A, B), and by 24 h this increased to ∼80% (Fig. 8 C). There was no evidence of proliferation in draining lymph nodes at this time (Fig. 8 D), but after 3 d T cells had undergone as many as six rounds of division (Fig. 8 E). By day 5, the number of divisions increased to >10 (Fig. 8 F). Thus, beginning at ∼24 h when we first observed instances of cell proliferation directly by two-photon imaging, T cells proliferated with a minimum doubling time of ∼8 h. On day 5, distal nondraining nodes in OVA-challenged mice contained T cells that had divided more than four times, in addition to a population of undivided T cells (Fig. 8 G), indicating that many OVA-specific T cells were trafficking throughout the body as central memory cells (26, 27). Finally, the capacity of expanded OVA-specific T cells to mount an effector response was confirmed by the presence of a DTH reaction after injection of soluble OVA into the ear on day 9 (Fig. 8 H). Moreover, OVA-specific T cells that had divided more than six times were present in ears exhibiting DTH, but not in the ears of sham-immunized animals that were similarly challenged (Fig. 8 I). Together, these results provide evidence that the single cell behavior we have described here reflects productive T cell–DC interactions.
Figure 8.
Kinetics of T cell activation, proliferation, and effector response. (A–C) CD69 expression by DO11.10 T cells in control and OVA-challenged mice at the times indicated. (D–F) T cell proliferation assessed by CFSE dilution measured 1, 3, and 5 d after adoptive transfer. (G) OVA-specific T cells are present in distal lymph nodes on day 5 after OVA challenge. (H) DTH assayed by ear thickness on day 9, 24 h after challenge with soluble OVA. (I) OVA-specific T cells recovered from the DTH site on day 9 after OVA challenge.
Discussion
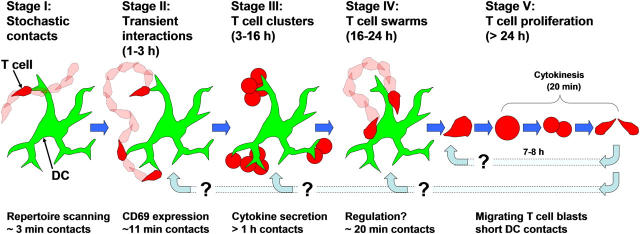
In the present work, we describe results that expand on a multi-stage model suggested previously for T cell activation (15). Based on our observations (19, 20) and the work of others (17, 18), we propose a model whereby T cells pass through five sequential stages during initial activation in the lymph node (Fig. 9).
Figure 9.
Proposed stages of antigen recognition and CD4+ T cell activation.
Stage I: Stochastic Scanning.
T cells approach DCs randomly and, in the absence of cognate antigen, make exploratory contacts with DC dendrites lasting only minutes (19). If a T cell fails to detect the appropriate MHC–peptide complex, it quickly departs to make room for another T cell to interact, thereby enabling each DC to contact thousands of T cells per hour in a process of stochastic T cell repertoire scanning (19–21). Because DCs localize near HEV (28), contacts with newly homed T cells would be favored, further enhancing the efficiency of stochastic scanning.
Stage II: Serial Interactions.
If cognate antigen is detected during stage I, T cells enter a distinct second stage involving longer DC contacts and decreased T cell velocity. During this period, T cells move in looping paths, promoting multiple contacts with the same or nearby DCs. After ∼2 h of such intermittent interactions, many T cells have up-regulated the early activation marker CD69. Thus, early antigen recognition involves multiple short-lived signaling events.
Stage III: Dynamic Clusters.
T cells enter an extended period lasting 12–14 h, during which they make relatively long-lived (>60 min) contacts with DCs. This stage appears as dense clusters of T cells on DCs under our experimental conditions of abundant antigen and large numbers of cognate T cells. We had previously described T cell clusters (15), although DCs were not imaged in those experiments. Such clusters are dynamic, and the transfer of T cells between different clusters was often observed.
Stage IV: T Cell Swarms.
T cells begin to dissociate from clusters and adopt a swarming behavior (15) with lower velocity and motility coefficient than naive T cells. During this stage, T cells are visibly enlarged and migrate slowly among DCs in the local region with which they make dynamic serial interactions. These swarming interactions likely augment previous antigen signals and may represent an additional checkpoint on the road to full T cell commitment.
Stage V: Proliferation.
Finally, at times >24 h, T cells enter a proliferative stage. Before and after dividing, T cells migrate autonomously and interact only briefly with DCs. Before cytokinesis, T cells stop moving and round up (∼15 min), but do not appear to be in contact with DCs. After cell cleavage (∼5 min), daughter cells quickly regain motility and move apart. Over the next few days, T cells divide approximately every 8 h, and by day 5, they display motility similar to naive T cells (19). The resumption of robust motility likely facilitates exit from the draining lymph node and, indeed, we observed expanded OVA-specific T cells recirculating through distal lymph nodes on day 5, similar to the behavior of central memory T cells. A key remaining question is whether CD4+ T cells are fully committed to multiple rounds of division after the first 24 h as with CD8+ T cells (29, 30), or whether they require continued interactions with DCs, possibly by reentering at one of the preceding stages.
Single Cell Imaging in Lymph Nodes.
A particular strength of our current work is that we imaged T cell interactions with in vivo–labeled DCs that acquired antigen in the periphery and migrated to the lymph node in response to inflammation induced by the adjuvant in our immunization mixture (19). This technique mimics the conditions during vaccination or infection and, as such, these endogenous DCs are expected to carry physiological concentrations of peptide–MHC and enter the lymph node at the appropriate stage of maturation. Other works have used in vitro–derived isolated DCs that were peptide pulsed in vitro (17, 18, 31). It is possible that those DCs may not carry a physiological level of peptide–MHC on their surface, or may lack intracellular reserves of antigen required for optimal stimulation of T cells in vivo. Moreover, there are concerns regarding the viability and maturation status of in vitro–prepared DCs. Another important advantage of our procedure is that we have synchronized T cell responses in the draining lymph node for approximately a day by adoptively transferring T cells after the antigen challenge. This synchronization, due to rapid T cell homing, allows us to resolve distinct stages of T cell behavior without further experimental manipulation.
Few live-cell imaging analyses of CD4+ T cells have been performed in intact lymphoid tissues, and these have yielded inconsistent results (15, 31). Stoll et al. (31) was the first to visualize T cells interacting with in vitro–derived DCs during an antigen response in intact lymphoid tissue, and reported stable, long-lasting (∼24 h) contacts between CD4+ T cells and DCs. That contrasts with our finding that T cell activation is initiated by an early period of transient interactions. In retrospect, the lack of dynamic behavior observed previously (31) likely resulted from photodamage or limited imaging depth associated with use of confocal microscopy.
Two recent real-time imaging papers have focused on the activation of antigen-specific CD8+ T cells using in vitro–derived, peptide-pulsed DCs (17, 18). Bousso and Robey (17) used two-photon microscopy to investigate antigen presentation in explanted lymph nodes and showed a single type of contact persisting for >2 h between high affinity CD8+ T cells and DCs. In contrast, Mempel et al. (18) used an intravital preparation that preserved normal blood and lymphatic flow, and described three distinct phases of CD8+ T cell priming: multiple, brief encounters with DCs; long-lasting stable DC–T cell conjugates; and a third phase, coincident with T cell proliferation, involving short DC contacts. T cell motility was reduced during the first phase when early activation markers were up-regulated, but high motility resumed on day 2 as cells began to proliferate. Surprisingly, this three-phase trafficking program was also observed in the absence of antigen, though with an abbreviation of the second phase.
Our findings reported here for CD4+ cells share many similarities with these previous papers on CD8+ cells (17, 18). However, there are several key differences that could arise from methodological differences (lymph node explant vs. intravital imaging), or differences in cell type (CD4+ vs. CD8+ T cells, and in vivo–labeled DCs vs. in vitro–derived DCs). Mempel et al. (18) proposed that recirculating lymphocytes pass through the same three phases in the presence or absence of cognate antigen during their transit through the lymph node. We did not observe antigen-independent changes in naive T cell behavior; the vast majority of CD4+ T cells maintained robust motility and made only brief contacts with DCs, regardless of the time after adoptive transfer (Fig. 7). CD8+ cognate interactions in the lymph node explant preparation and in the intravital preparation were reported to occur by T cells primarily contacting the body of the DC or crawling along the DC soma (17, 18). However, dendrite processes were not well resolved in these studies. In our analysis, we observed contacts between CD4+ T cells and DCs that occurred primarily at arms length on dendrites, possibly reflecting differences in the preferred sites of interaction for CD4+ and CD8+ T cells. Moreover, the sequence of T cell behaviors appeared to follow different kinetics. Mempel et al. found only a slight prolongation (4.1 vs. 5.9 min) of T cell–DC contact duration in the presence of cognate antigen and did not report these as separate phases (18), whereas we observed a marked prolongation (3.4 vs. 11.4 min), and propose two distinct stages: initial sampling and early antigen recognition. Mempel et al. observed a transition to T cell clustering behavior and prolonged DC contacts after 8 h, but with CD4+ cells we found a more rapid transition beginning within 2 h of T cell transfer. However, the up-regulation of CD69 paralleled these behavioral changes in both instances. In addition, Mempel et al. (18) did not describe a transition stage of swarming after T cell clusters disperse and before the resumption of autonomous motility.
Together, the results of two-photon imaging studies with CD4+ and CD8+ T cells indicate that both undergo progressive changes in motility and DC contact stability during priming in native tissues. Although the signaling complexes differ in molecular composition between these cell types, it is thus likely that they share a common overarching activation program that involves multiple, serial antigen recognition events. However, as noted before, existing imaging studies point to significant differences in the kinetics and qualitative characteristics of CD4+ and CD8+ T cell activation. It remains unclear to what extent these reflect intrinsic cellular properties or methodological differences.
Implications for the IS.
Observations in cell culture systems have been instrumental to understanding the molecular features of the IS. Nevertheless, the morphology and dynamics of the T cell–DC contacts that result in T cell priming in vivo remain controversial (32, 33).
The first studies using in vitro systems led to a structural view of the IS as being composed of T cell receptors, adhesion molecules, and kinases organized into central and peripheral supramolecular activation clusters (c- and p-SMACs; references 6, 34). This “classical” IS takes the form of a flat membrane interface with an area of ∼50 μm2, that assembles over a period of 30–60 min and remains stably associated for many hours (7). Different to this, our results for CD4+ T cells suggest that activation is mediated through sequential stages of T cell–DC interactions, primarily involving small, dynamic contacts. Only the cluster stage exhibits contacts that would be sufficiently long lived for assembly of c- and p-SMACs. Furthermore, the sizes of the contacts we observe (8–10 μm2 during stages 1 and 2; 16 μm2 during stage III; and 20 μm2 during stage IV) are generally smaller and more dynamic than the classical IS, but accord better with recent findings of more complex and dynamic IS morphology (35, 36).
The temporal requirements for T cell activation also remain unclear. A majority of in vitro studies suggest that stable establishment of an IS lasting several hours is required for NFAT-mediated gene expression (37), cytokine expression (38), and full T cell activation (5–8). This interpretation is further supported by observations of TCR aggregation at contact zones in fixed lymph node tissue sections (10, 11) and conjugate T cell–DC clusters isolated from dissociated lymph nodes (12). However, serial and short-lived contacts with DCs are sufficient to activate CD4+ T cells in collagen gels (13, 14), and subsequent studies have shown that contacts lasting only a few minutes (on the timescale of our stage II contacts) are sufficient to permit tyrosine phosphorylation (36), calcium signaling in CD4+ T cells (39), and cell killing by CD8+ T cells (40). Our observations of in situ CD4+ T cell–DC interactions at the early serial stage (stage II, <2 h) and at the later swarming stage (stage IV, >16 h) are similar to the short-lived dynamic contacts seen in collagen gel culture (13). Nevertheless, the relatively stable contacts we observe during the T cell clusters of stage III may be crucial for full T cell activation, consistent with the requirement of long-lasting contacts for cytokine production in vitro (38).
In summary, imaging studies indicate that T cell activation in native tissues proceeds through multiple transient interactions, rather than being triggered by a single long-lived antigen-recognition event. The nature and durations of these interactions change dramatically as T cells progress through the various stages of activation. Such an accumulation of sequential signaling events is a central tenet of the “progressive differentiation” model proposed by Lanzavecchia and Sallusto (27).
Advances in single cell imaging techniques have provided a road map for the cell biology of antigen recognition by T cells. We show that the interactions between naive CD4+ T cells and endogenous DCs occur preferentially on DC dendrites, and involve many serial contacts. Because these interactions progress through distinct stages, T cell priming cannot be ascribed to a single, stereotypical form of cell–cell contact. Instead, a complex choreography has likely evolved to balance the competing requirements of marshalling a rapid and robust immune response while ensuring sufficient fidelity to avoid inappropriate or autoimmune responses. Moreover, the requirement for serial interactions with DCs provides a mechanism allowing T cell responses to be graded in proportion to the antigen challenge.
Acknowledgments
We thank Dr. L. Forrest for outstanding veterinary support.
This work was supported by grant nos. GM-41514 (to M.D. Cahalan) and GM-48071 (to I. Parker) from the National Institutes of Health.
The authors have no conflicting financial interests.
I. Parker and M.D. Cahalan contributed equally to this work.
Abbreviations used in this paper: DTH, delayed type hypersensitivity; IS, immunological synapse.
References
- 1.Mellman, I., and R.M. Steinman. 2001. Dendritic cells: specialized and regulated antigen processing machines. Cell. 106:255–258. [DOI] [PubMed] [Google Scholar]
- 2.Jenkins, M.K., A. Khoruts, E. Ingulli, D.L. Mueller, S.J. McSorley, R.L. Reinhardt, A. Itano, and K.A. Pape. 2001. In vivo activation of antigen-specific CD4 T cells. Annu. Rev. Immunol. 19:23–45. [DOI] [PubMed] [Google Scholar]
- 3.Cahalan, M.D., I. Parker, S.H. Wei, and M.J. Miller. 2003. Real-time imaging of lymphocytes in vivo. Curr. Opin. Immunol. 15:372–377. [DOI] [PMC free article] [PubMed] [Google Scholar]
- 4.Germain, R.N., and M.K. Jenkins. 2004. In vivo antigen presentation. Curr. Opin. Immunol. 16:120–125. [DOI] [PubMed] [Google Scholar]
- 5.Dustin, M.L., and J.A. Cooper. 2000. The immunological synapse and the actin cytoskeleton: molecular hardware for T cell signaling. Nat. Immunol. 1:23–29. [DOI] [PubMed] [Google Scholar]
- 6.Grakoui, A., S.K. Bromley, C. Sumen, M.M. Davis, A.S. Shaw, P.M. Allen, and M.L. Dustin. 1999. The immunological synapse: a molecular machine controlling T cell activation. Science. 285:221–227. [DOI] [PubMed] [Google Scholar]
- 7.Krummel, M.F., and M.M. Davis. 2002. Dynamics of the immunological synapse: finding, establishing and solidifying a connection. Curr. Opin. Immunol. 14:66–74. [DOI] [PubMed] [Google Scholar]
- 8.Tseng, S.Y., and M.L. Dustin. 2002. T-cell activation: a multidimensional signaling network. Curr. Opin. Cell Biol. 14:575–580. [DOI] [PubMed] [Google Scholar]
- 9.Ingulli, E., A. Mondino, A. Khoruts, and M.K. Jenkins. 1997. In vivo detection of dendritic cell antigen presentation to CD4+ T cells. J. Exp. Med. 185:2133–2141. [DOI] [PMC free article] [PubMed] [Google Scholar]
- 10.Reichert, P., R.L. Reinhardt, E. Ingulli, and M.K. Jenkins. 2001. Cutting edge: in vivo identification of TCR redistribution and polarized IL-2 production by naive CD4 T cells. J. Immunol. 166:4278–4281. [DOI] [PubMed] [Google Scholar]
- 11.McGavern, D.B., U. Christen, and M.B. Oldstone. 2002. Molecular anatomy of antigen-specific CD8+ T cell engagement and synapse formation in vivo. Nat. Immunol. 3:918–925. [DOI] [PMC free article] [PubMed] [Google Scholar]
- 12.Hommel, M., and B. Kyewski. 2003. Dynamic changes during the immune response in T cell–antigen-presenting cell clusters isolated from lymph nodes. J. Exp. Med. 197:269–280. [DOI] [PMC free article] [PubMed] [Google Scholar]
- 13.Gunzer, M., A. Schafer, S. Borgmann, S. Grabbe, K.S. Zanker, E.B. Brocker, E. Kampgen, and P. Friedl. 2000. Antigen presentation in extracellular matrix: interactions of T cells with dendritic cells are dynamic, short lived, and sequential. Immunity. 13:323–332. [DOI] [PubMed] [Google Scholar]
- 14.Friedl, P., and E.B. Brocker. 2002. TCR triggering on the move: diversity of T-cell interactions with antigen-presenting cells. Immunol. Rev. 186:83–89. [DOI] [PubMed] [Google Scholar]
- 15.Miller, M.J., S.H. Wei, I. Parker, and M.D. Cahalan. 2002. Two-photon imaging of lymphocyte motility and antigen response in intact lymph node. Science. 296:1869–1873. [DOI] [PubMed] [Google Scholar]
- 16.Cahalan, M.D., I. Parker, S.H. Wei, and M.J. Miller. 2002. Two-photon tissue imaging: seeing the immune system in a fresh light. Nat. Rev. Immunol. 2:872–880. [DOI] [PMC free article] [PubMed] [Google Scholar]
- 17.Bousso, P., and E. Robey. 2003. Dynamics of CD8+ T cell priming by dendritic cells in intact lymph nodes. Nat. Immunol. 4:579–585. [DOI] [PubMed] [Google Scholar]
- 18.Mempel, T.R., S.E. Henrickson, and U.H. Von Andrian. 2004. T-cell priming by dendritic cells in lymph nodes occurs in three distinct phases. Nature. 427:154–159. [DOI] [PubMed] [Google Scholar]
- 19.Miller, M.J., A.S. Hejazi, S.H. Wei, M.D. Cahalan, and I. Parker. 2004. T cell repertoire scanning is promoted by dynamic dendritic cell behavior and random T cell motility in the lymph node. Proc. Natl. Acad. Sci. USA. 101:998–1003. [DOI] [PMC free article] [PubMed] [Google Scholar]
- 20.Miller, M.J., S.H. Wei, M.D. Cahalan, and I. Parker. 2003. Autonomous T cell trafficking examined in vivo with intravital two-photon microscopy. Proc. Natl. Acad. Sci. USA. 100:2604–2609. [DOI] [PMC free article] [PubMed] [Google Scholar]
- 21.Wei, S.H., I. Parker, M.J. Miller, and M.D. Cahalan. 2003. A stochastic view of lymphocyte motility and trafficking within the lymph node. Immunol. Rev. 195:136–159. [DOI] [PubMed] [Google Scholar]
- 22.Hsieh, C.S., S.E. Macatonia, A. O'Garra, and K.M. Murphy. 1995. T cell genetic background determines default T helper phenotype development in vitro. J. Exp. Med. 181:713–721. [DOI] [PMC free article] [PubMed] [Google Scholar]
- 23.Itano, A.A., S.J. McSorley, R.L. Reinhardt, B.D. Ehst, E. Ingulli, A.Y. Rudensky, and M.K. Jenkins. 2003. Distinct dendritic cell populations sequentially present antigen to CD4 T cells and stimulate different aspects of cell-mediated immunity. Immunity. 19:47–57. [DOI] [PubMed] [Google Scholar]
- 24.Itano, A.A., and M.K. Jenkins. 2003. Antigen presentation to naive CD4 T cells in the lymph node. Nat. Immunol. 4:733–739. [DOI] [PubMed] [Google Scholar]
- 25.Young, A.J. 1999. The physiology of lymphocyte migration through the single lymph node in vivo. Semin. Immunol. 11:73–83. [DOI] [PubMed] [Google Scholar]
- 26.Sallusto, F., D. Lenig, R. Forster, M. Lipp, and A. Lanzavecchia. 1999. Two subsets of memory T lymphocytes with distinct homing potentials and effector functions. Nature. 401:708–712. [DOI] [PubMed] [Google Scholar]
- 27.Lanzavecchia, A., and F. Sallusto. 2002. Progressive differentiation and selection of the fittest in the immune response. Nat. Rev. Immunol. 2:982–987. [DOI] [PubMed] [Google Scholar]
- 28.Bajenoff, M., S. Granjeaud, and S. Guerder. 2003. The strategy of T cell antigen-presenting cell encounter in antigen-draining lymph nodes revealed by imaging of initial T cell activation. J. Exp. Med. 198:715–724. [DOI] [PMC free article] [PubMed] [Google Scholar]
- 29.van Stipdonk, M.J., E.E. Lemmens, and S.P. Schoenberger. 2001. Naive CTLs require a single brief period of antigenic stimulation for clonal expansion and differentiation. Nat. Immunol. 2:423–429. [DOI] [PubMed] [Google Scholar]
- 30.Kaech, S.M., and R. Ahmed. 2001. Memory CD8+ T cell differentiation: initial antigen encounter triggers a developmental program in naive cells. Nat. Immunol. 2:415–422. [DOI] [PMC free article] [PubMed] [Google Scholar]
- 31.Stoll, S., J. Delon, T.M. Brotz, and R.N. Germain. 2002. Dynamic imaging of T cell-dendritic cell interactions in lymph nodes. Science. 296:1873–1876. [DOI] [PubMed] [Google Scholar]
- 32.Jacobelli, J., P.G. Andres, J. Boisvert, and M.F. Krummel. 2004. New views of the immunological synapse: variations in assembly and function. Curr. Opin. Immunol. 16:345–352. [DOI] [PubMed] [Google Scholar]
- 33.Huppa, J.B., and M.M. Davis. 2003. T-cell-antigen recognition and the immunological synapse. Nat. Rev. Immunol. 3:973–983. [DOI] [PubMed] [Google Scholar]
- 34.Monks, C.R., B.A. Freiberg, H. Kupfer, N. Sciaky, and A. Kupfer. 1998. Three-dimensional segregation of supramolecular activation clusters in T cells. Nature. 395:82–86. [DOI] [PubMed] [Google Scholar]
- 35.Hailman, E., W.R. Burack, A.S. Shaw, M.L. Dustin, and P.M. Allen. 2002. Immature CD4(+)CD8(+) thymocytes form a multifocal immunological synapse with sustained tyrosine phosphorylation. Immunity. 16:839–848. [DOI] [PubMed] [Google Scholar]
- 36.Lee, K.H., A.D. Holdorf, M.L. Dustin, A.C. Chan, P.M. Allen, and A.S. Shaw. 2002. T cell receptor signaling precedes immunological synapse formation. Science. 295:1539–1542. [DOI] [PubMed] [Google Scholar]
- 37.Winslow, M.M., J.R. Neilson, and G.R. Crabtree. 2003. Calcium signalling in lymphocytes. Curr. Opin. Immunol. 15:299–307. [DOI] [PubMed] [Google Scholar]
- 38.Hurez, V., A. Saparov, A. Tousson, M.J. Fuller, T. Kubo, J. Oliver, B.T. Weaver, and C.T. Weaver. 2003. Restricted clonal expression of IL-2 by naive T cells reflects differential dynamic interactions with dendritic cells. J. Exp. Med. 198:123–132. [DOI] [PMC free article] [PubMed] [Google Scholar]
- 39.Irvine, D.J., M.A. Purbhoo, M. Krogsgaard, and M.M. Davis. 2002. Direct observation of ligand recognition by T cells. Nature. 419:845–849. [DOI] [PubMed] [Google Scholar]
- 40.Purbhoo, M.A., D.J. Irvine, J.B. Huppa, and M.M. Davis. 2004. T cell killing does not require the formation of a stable mature immunological synapse. Nat. Immunol. 5:524–530. [DOI] [PubMed] [Google Scholar]
