A Transcription Factor Map as Revealed by a Genome-Wide Gene Expression Analysis of Whole-Blood mRNA Transcriptome in Multiple Sclerosis (original) (raw)
Abstract
Background
Several lines of evidence suggest that transcription factors are involved in the pathogenesis of Multiple Sclerosis (MS) but complete mapping of the whole network has been elusive. One of the reasons is that there are several clinical subtypes of MS and transcription factors that may be involved in one subtype may not be in others. We investigate the possibility that this network could be mapped using microarray technologies and contemporary bioinformatics methods on a dataset derived from whole blood in 99 untreated MS patients (36 Relapse Remitting MS, 43 Primary Progressive MS, and 20 Secondary Progressive MS) and 45 age-matched healthy controls.
Methodology/Principal Findings
We have used two different analytical methodologies: a non-standard differential expression analysis and a differential co-expression analysis, which have converged on a significant number of regulatory motifs that are statistically overrepresented in genes that are either differentially expressed (or differentially co-expressed) in cases and controls (e.g., V$KROX_Q6, p-value <3.31E-6; V$CREBP1_Q2, p-value <9.93E-6, V$YY1_02, p-value <1.65E-5).
Conclusions/Significance
Our analysis uncovered a network of transcription factors that potentially dysregulate several genes in MS or one or more of its disease subtypes. The most significant transcription factor motifs were for the Early Growth Response EGR/KROX family, ATF2, YY1 (Yin and Yang 1), E2F-1/DP-1 and E2F-4/DP-2 heterodimers, SOX5, and CREB and ATF families. These transcription factors are involved in early T-lymphocyte specification and commitment as well as in oligodendrocyte dedifferentiation and development, both pathways that have significant biological plausibility in MS causation.
Introduction
Multiple Sclerosis (MS) [1] is an autoimmune disease characterised by chronic inflammatory demyelination of the central nervous system. The disorder affects millions of people worldwide and is the most common chronic disease of the central nervous system that begins in early to middle adult life [2] (its prevalence in the USA is 0.9 per 1,000 [3]). MS is a multifactorial and heterogeneous disease, and although its causes are currently unknown it is increasingly clear that both genetic and environmental factors contribute to susceptibility [2], [4]–[6]. Evidence for genetic risk includes familial aggregation [5], [7] and differences in prevalence between ethnic groups [8]–[10] (caucasians of Northern European ancestries appear to be particularly susceptible). It is now well established that certain genes influence susceptibility to MS – human leukocyte antigen HLA DRB1*1501 [11], IL2RA, IL7R, CLEC16A [12]–[16], and others [17]–[23].
There are three principal clinical subtypes of MS, the most prevalent being: relapsing remitting (RRMS), where unpredictable relapsing episodes alternate with periods of remission; primary progressive (PPMS), where there is steady progression of the illness from onset; and secondary progressive (SPMS), where after an initial relapsing remitting pattern, there is progressive neurological decline with or without relapses. The question of whether some MS subtypes are associated with particular susceptibility genes is open and merits further examination. Currently there is only modest evidence for any association [24], [25], and these have been challenged [26].
Previous research has demonstrated the potential of differential gene expression profiling in elucidating complex traits, including disease susceptibility, when expression is measured in tissue related to the trait under study [27]. A companion study [28] to the work presented here applied traditional statistical analysis to whole blood mRNA transcriptome of all known genes in a gene expression study of MS. The results were combined with results from the genome-wide association study published by the ANZgene GWAS[21]. The expression of 48,000 gene probe sequences in human HT-12 beadarray chips (Illumina Inc., CA, USA) hybridized with cDNA from 99 untreated MS patients (36 RRMS, 43 PPMS, and 20 SPMS) and 45 age-matched healthy controls, identifying over 19,000 gene probes expressed in the blood cells with a large number that were differentially expressed between the controls and MS sample groups. Functional profiling of the differentially expressed genes revealed that the cells in whole blood are more active in MS, being engaged in translation and energy production through oxidative phosphorylation to a greater extent. Additionally, T cells accounted for the greatest percentage of differentially expressed (in controls versus MS collectively) immune cell “tagging” genes. Together, these results are consistent with the prevailing view that autoreactive T cells play a key role in the pathogenesis of MS.
Evidence suggests that transcription factors are involved in the pathogenesis of MS and other autoimmune diseases [29], [30]. For example, it has previously been observed that members of the NF-kappaB, STAT, AP-1 and E2F families [30]–[56], IRF-1 [36], [46], [47], [57], IRF-2 [58], IRF-5 [59], IRF-8 [20], CREB [36], [46], PPARgamma and PPARalpha [60]–[68], SP1 [59], SP3 [69]–[71], RORC [72], NR4A2, TCF2 [73], ETS-1 [74] and FOXP3 [75]–[85] may be implicated in MS and its disease subtypes. This paper aims to complement the companion study by uncovering, thanks to combinatorial optimization and differential co-expression methods and a different focus in the analysis, transcription factors that potentially dysregulate many genes in MS. The working hypothesis is that, given consistent sets of genes exhibiting differential expression or co-expression patterns between two classes, this change is attributed to a set of transcription factors. Ultimately, our goal is to piece together relationships and infer a network of transcription factors that are implicated in MS and its subtypes as inferred from the differential expression and co-expression of several hundreds of genes.
We are aware that a cautionary note is required to our study and all others that aim to correlate variations in the transcriptome of whole-blood with gene expression and its regulation mechanisms and their consequences in the brain (for instance, those of oligodendrocyte de-differentiation). There exist few studies in the area. In a recent study [86], the consistency between expression patterns between brain and blood was analysed. Although important differences were observed (around 90% of all transcripts examined presented variations in the alternative splicing index in brain and blood), a large number of brain transcripts (4,100) co-expressed in blood samples. This means, on the biomarker identification phase, that they can be further explored in experimental studies of either blood or cell lines from patients with MS.
As the effects of processing whole blood may also contribute to changes of these gene expression patterns, our cautionary note remains until we could better narrow the valid consistencies. In some sense, the diagnostic need of a simple blood test for MS, as well as our present atlas of expression changes with this technology will certainly motivate useful studies like the one in [86] to bridge this gap.
The data discussed in this publication have been deposited in NCBI's Gene Expression Omnibus [87], and are accessible through GEO Series accession number GSE17048 (http://www.ncbi.nlm.nih.gov/geo/query/acc.cgi?acc=GSE17408).
Results
Two different analyses were used to define potentially relevant transcription factors. Gene expression using microarray detection techniques utilize short sequences (“probes”) that target specific genes, and even specific protein isoforms (particularly true in Illumina technology). All differential expression or co-expression analysis here are performed on individual probe identifiers, while transcription factor overrepresentation are performed based on the target genes identifiers. The first identified gene probes differentially expressed between the four different clinical groups in the study's sample set; the second, groups of gene probes pair-wise differentially co-expressed between control and MS samples. The first analysis is better at revealing differences in gene expression between the sample groups, while the second aims to find specific groups of genes which have lost their normal pattern of co-expression and are affected by MS irrespective of disease subtype. Overrepresented binding motifs, and their corresponding transcription factors, were obtained for the groups of genes identified under both approaches.
Seven molecular genetic signatures were derived from the whole blood mRNA expression data collected in [28] (our companion study) and then profiled for overrepresented TRANSFAC motifs. Each signature contained a set of gene probe sequences that are differentially expressed between a pair of sample groups specified by the signature's denotation (C/MS, C/PP, C/RR, C/SP, PP/RR, RR/SP, or PP/SP); for example, C/PP contained genes differentially expressed between control and PPMS samples. The signatures were obtained using a three-step filtering process that discards the probes that are least relevant for distinguishing between the pair of sample groups according to formal criteria: Standard detection p-value initial filtering, then an entropy-based selection procedure [88], and finally, an (α,β)-k-feature set selection method [89], [90], which removes probes based on statistical significance, information content, and predictive ability respectively. More details are provided in the Materials and Methods section. This methodology has been used to identify robust gene sets associated to a variety of diseases, including Alzheimer's [89], [91], Parkinson's [92], and prostate cancer [93]. Gene sets obtained by this methodology maximise intra-class coherency and inter-class discriminatory power with the minimum number of genes[94].
Figures 1–7 depict the signatures and their corresponding clustered heatmaps, while detailed listings are provided in supporting information Table S1, Table S2 and Table S3, with combined summary, listing and overlap with the companion study signatures in supporting information Table S4. We note that the heatmap for C/MS (Figure 1) exhibits a lack of coherence in the MS samples, indicating that gene expression is heterogeneous over the MS group as a whole. Coherence increases when the MS subtypes are considered separately (C/PP: Figure 2, C/RR: Figure 3, C/SP: Figure 4, PP/SP: Figure 5, PP/RR: Figure 6, and RR/SP: Figure 7), suggesting a correlation between disease subtype and gene expression. The heatmaps containing SPMS samples (Figures 4, 5, and 7) are less coherent overall than those for PPMS (Figures 2, 5, and 6) and RRMS (Figures 3, 6, and 7), suggesting that SPMS is the most heterogeneous MS subtype with respect to gene expression in our study. A noticeable pattern of “bars” does appear in the PPMS samples in C/PP (Figure 2), though, which could be evidence of distinct PPMS subtypes with contrasting gene expression for the genes in the bars.
Figure 1. mRNA expression heatmap for the C/MS signature.

Samples are placed along the horizontal axis and mRNA probe sequences along the vertical axis. Samples are colour-coded in the bottom horizontal bar (controls: blue; MS: green, as RR: red, SP: yellow, PP: grey). Clustering with a high-performance memetic algorithm (described in [285]) has ordered the samples and probe sequences, revealing four quadrants that are primarily up- (red) or down- (green) regulated. Note that division into up/down regulated is more coherent in the control samples than the MS samples.
Figure 2. mRNA expression heatmap for the C/PP signature.

Control samples (blue), PPMS (grey). Note the pattern of ‘bars’ near the bottom right of the heatmap (circled) where expression broadly alternates between up- (red) and down- (green) regulated in disease. This regular pattern could indicate that PPMS contains distinct subgroups with respect to gene expression.
Figure 3. mRNA expression heatmap for the C/RR signature.

Control samples (blue), RRMS (red).
Figure 4. mRNA expression heatmap for the C/SP signature.

Control samples (blue), SPMS (yellow).
Figure 5. mRNA expression heatmap for the PP/SP signature.

SPMS samples (yellow), PPMS (grey).
Figure 6. mRNA expression heatmap for the PP/RR signature.

RRMS samples (red), PPMS (grey).
Figure 7. mRNA expression heatmap for the RR/SP signature.

RRMS samples (red), SPMS (yellow).
Analysis of Differential Gene Expression
A profile of overrepresented regulatory sequences was obtained for each of the seven signatures using the profiling tool GATHER [95] (See supporting information Table S5). The profiles contain TRANSFAC binding motifs occurring in the regulatory regions of the genes for each signature, which appear overrepresented with _p_-value <0.05. The complete profiles for all signatures are given in Figure 8. Inspection of the profiles reveals that, with the exception of C/RR and C/SP, there is only a modest intersection between any pair of profiles. In contrast, nearly half of the motifs in each of the C/RR and C/SP TRANSFAC profiles (six motifs) occur in the intersection of the pair. The C/RR and C/SP signatures share only 12 gene probes (the signatures contain 267 and 113 probes respectively), which is not enough to account for the amount of agreement between their TRANSFAC profiles. In fact, the composition of the TRANSFAC profiles was unchanged when the 12 probes were removed from C/RR and C/SP and the profiles recomputed. These observations suggest that any pathways of transcriptional dysregulation occurring in MS are likely to be largely distinct in the PPMS subtype, while overlapping considerably in RRMS and SPMS. (We note a similar finding in the companion study [28] using a different methodology: RRMS and SPMS share more dysregulated gene ontology pathways –principally immune regulation pathways– with each other than with PPMS.)
Figure 8. TRANSFAC motif profiles for the seven signatures (blue bars).

Only significant motifs (_p_-value ≤0.05) are shown. Bar size is proportional to the negative natural logarithm of _p_-value, which is also given as a number. Note that, in contrast to other pairs of profiles, there is a sizeable intersection between the C/RR and C/SP profiles (green ring). “Key” regulators of each profile, which are found by hitting set analysis, are indicated by dots underneath a bar (see figure legend). The TRANSFAC profile for the set containing all the key regulators' coding genes is shown (orange bars); this profile in effect contains “higher level” regulators – i.e. a hierarchy with a next level of putative regulators of regulators.
Additionally, we profiled the above TRANSFAC profiles themselves to reveal higher-level overrepresented regulatory sequences. These higher-level regulatory sequences – which effectively identify ‘regulators of regulators’ – were obtained by TRANSFAC profiling the coding genes of transcription factors corresponding to key sequences in the above TRANSFAC profiles. We considered the identification of the key sequences to be a problem of combinatorial optimization (specifically, a generalization of the Hitting Set problem) as described under Materials and Methods. The resulting higher-level sequences are given in Figure 8 (HS column) and Table 1.
Table 1. Regulators of regulators: binding motifs/transcription factors appearing in the higher level regulation network.
| Binding motif | Transcription factor | HS of | In which HS | _p-_value | |
|---|---|---|---|---|---|
| 1. | V$E2F1DP1_01 (M00736) | E2F-1/DP-1 heterodimer | HS-Clust | 3-hs | 3.31E-06 |
| 2. | V$E2F4DP2_01 (M00739) | E2F-4/DP-2 heterodimer | HS-Clust | 1-, 3-hs | 3.31E-06 |
| 3. | V$DEAF1_01 (M01001) | DEAF1 | HS-Sig | 2-, 3-hs | 4.28E-05 |
| 4. | V$CREB_Q2_01 (M00916) | CREB | HS-Clust | 1-, 2-, 3-hs | 6.57E-05 |
| 5. | V$E2F1_Q6_01 (M00940) | E2F-1 | HS-Clust | 2-hs | 7.87E-05 |
| 6. | V$KROX_Q6 (M00982) | KROX/EGR family | HS-Clust | 1-, 3-hs | 2.03E-04 |
| 7. | V$CREB_Q4_01 (M00917) | CREB family | HS-Clust | 3-hs | 7.25E-04 |
| 8. | V$HNF3B_01 (M00131) | HNF3beta | HS-Clust | 2-, 3-hs | 7.62E-04 |
| 9. | V$E2F1_Q6 (M00431) | E2F-1 | HS-Sig | 1-, 2-, 3-hs | 1.76E-03 |
| 10. | V$CREB_Q2_01 (M00916) | CREB | HS-Sig | 2-, 3-hs | 2.09E-03 |
| 11. | V$CREL_01 (M00053) | c-Rel | HS-Sig | 1-, 2-, 3-hs | 2.48E-03 |
| 12. | V$ZTA_Q2 (M00711) | Zta | HS-Clust | 1-, 2-, 3-hs | 3.21E-03 |
| 13. | V$ICSBP_Q6 (M00699) | ICSBP | HS-Sig | 2-, 3-hs | 4.99E-03 |
| 14. | V$ELK1_02 (M00025) | ELK1 | HS-Sig | 3-hs | 7.45E-03 |
| 15. | V$MAZ_Q6 (M00649) | MAZ | HS-Clust | 2-, 3-hs | 8.92E-03 |
| 16. | V$E2F_Q6 (M00427) | E2F | HS-Clust | 3-hs | 1.41E-02 |
Binding Motifs for KROX/EGR Family, ATF2, and YY1 are Significantly Overrepresented in MS Subtypes
We highlight the appearance of V$E2F1DP1_01 complex (p-value <4.28E-5), V$DEAF1_01 (p-value <4.28E-5), V$MAZR_01 (p-value <1.0E-3) and V$E2F4DP2_01 (p-value <1.1E-3). V$DEAF1_01 is a binding motif for the DEAF1 (deformed epidermal autoregulatory factor 1 homolog/NUDR/Supressin) transcription factor, which has been related to negative regulation of T-lymphocytes [96], and recently linked to altered tissue-specific antigen expression in the lymphoid system and autoimmune diabetes [97], [98].
Finally, we profiled up-/down regulated subsets of the signatures to reveal any regulatory sequences associated with increased/decreased expression only. The intersection of the signatures is depicted in Figure 9, while Figure 10 shows the complete profiles for each signature subset. We note the transcription factor motifs for the KROX/EGR family (V$KROX_Q6, p-Value <3.31E-6), for ATF2 (V$CREBP1_Q2, p-Value <1.0E-5) and for YY1 (V$YY1_02, p-Value <1.65E-5) as the most significantly overrepresented (see Table 2, second block).
Figure 9. The A) up- and B) down-regulated signature subsets.

(Note that when two groups were combined, the genes in the intersection are also included in the analysis). The most significant transcription factor motifs associated with a group are shown in square brackets.
Figure 10. TRANSFAC motif profiles for the up- (red bars) and down- (green bars) regulated signature subsets.

Profiles for subset unions are also shown; for instance C/PP+C/RR contains the up (red) or down (green) regulated genes from the union of the C/PP and C/RR signatures (Figure 8 depicts all the signature subsets and subset unions.) The bottom row (blue bars) is the profile for all genes in the C/PP, C/RR and C/SP signatures. Size of bar is proportional to the negative natural logarithm of _p_-value, which is also given as a number. Only significant motifs (_p_-value ≤0.05) are shown.
Table 2. The most significantly overrepresented TRANSFAC motifs found in this study.
| Binding motif | Transcription Factor | Profile | _p_-value | |
|---|---|---|---|---|
| Via profiling the signatures | ||||
| 1. | V$CREBP1CJUN_01 (M00041) | ATF2/c-Jun heterodimer | C/SP | 1.38E-4 |
| 2. | V$ATF_B (M00338) | ATF family | C/SP | 1.92E-4 |
| 3. | V$TEL2_Q6 (M00678) | TEL2 | C/PP | 2.41E-4 |
| 4. | V$CREB_Q2 (M00177) | CREB | C/RR | 6.49E-4 |
| 5. | V$VMYB_01 (M00003) | V-MYB | C/PP | 8.01E-4 |
| 6. | V$ELK1_02 (M00025) | ELK1 | C/RR | 8.67E-4 |
| 7. | V$CETS1P54_01 (M00032) | ETS1 | RR/SP | 8.67E-4 |
| 8. | V$CREBP1_Q2 (M00179) | ATF2 | C/SP | 1.14E-3 |
| 9. | V$ATF_B (M00338) | ATF family | C/RR | 1.63E-3 |
| 10. | V$NFKAPPAB65_01 (M00052) | NF-KappaBeta (p65) | C/RR | 1.95E-3 |
| Via profiling the up/down regulated signature subsets | ||||
| 1. | V$KROX_Q6 (M00982) | KROX/EGR family | C/PP+C/RR (-) | 3.31E-6 |
| 2. | V$KROX_Q6 (M00982) | KROX/EGR family | C/PP+C/RR+C/SP (-) | 6.59E-6 |
| 3. | V$CREBP1_Q2 (M00179) | ATF2 | C/PP+C/RR+C/SP (+) | 9.93E-6 |
| 4. | V$CREBP1_Q2 (M00179) | ATF2 | C/RR+C/SP (+) | 1.65E-5 |
| 5. | V$CREBP1_Q2 (M00179) | ATF2 | C/SP (+) | 1.65E-5 |
| 6. | V$YY1_02 (M00069) | YY1 | C/PP+C/RR+C/SP (+) | 1.65E-5 |
| 7. | V$CREBP1CJUN_01 (M00041) | ATF2/c-Jun heterodimer | C/SP (+) | 3.30E-5 |
| 8. | V$YY1_02 (M00069) | YY1 | C/PP+C/RR (+) | 4.28E-5 |
| 9. | V$CREBP1CJUN_01 (M00041) | ATF2/c-Jun heterodimer | C/RR+C/SP (+) | 1.19E-4 |
| 10. | V$YY1_02 (M00069) | YY1 | C/PP+C/SP (+) | 1.22E-4 |
| Via profiling the star groups | ||||
| 1. | V$SOX5_01 (M00042) | SOX5 | final_1 | 6.59E-6 |
| 2. | V$CREB_Q4_01 (M00917) | CREB family | final_2 | 6.59E-6 |
| 3. | V$CREBATF_Q6 (M00981) | CREB and ATF families | final_1 | 9.93E-6 |
| 4. | V$HTF_01 (M00538) | final_12 | 1.65E-5 | |
| 5. | V$E2F_Q4 (M00426) | E2F/DP heterodimers | final_2 | 2.65E-5 |
| 6. | V$E2F1_Q6_01 (M00940) | E2F-1 | final_2 | 2.65E-5 |
| 7. | V$NRF2_01 (M00108) | NFE2L2 (NRF2) | final_10 | 2.65E-5 |
| 8. | V$CREB_Q2_01 (M00916) | CREB family | final_1 | 3.30E-5 |
| 9. | V$MINI20_B (M00324) | final_1 | 3.30E-5 | |
| 10. | V$CREB_Q4_01 (M00917) | CREB family | final_1 | 6.57E-5 |
Remarks on the presence of some probes in the genetic signature that discriminates Controls from MS patients
The heterogeneity of the C/MS signature makes it relatively difficult to talk about individual probes, as it is unlikely that they will have the same pattern of expression across all subtypes of MS. Nevertheless, we highlight the following for future discussion. First, a probe for LOC649143 (similar to HLA class II histocompatibility antigen, DRB1-9 beta chain precursor (MHC class I antigen DRB1*9) (DR-9) (DR9)) has a tendency to be consistently upregulated in controls but not in MS samples. Second, a probe for LOC650557 (similar to HLA class II histocompatibility antigen, DQ(W1.1) beta chain precursor (DQB1*0501)) has the opposite behaviour, a tendency to be downregulated in controls. CASP8 (caspase 8, apoptosis-related cysteine peptidase) appears upregulated in MS and RRMS groups; the protective effect of its inhibition to oligodendrocytes has been suggested in [99]. Finally, several MS samples have higher expression for a probe of KIR2DS5 (Homo sapiens killer cell immunoglobulin-like receptor) [100], [101] than in controls (KIR2DS5 was also part of a study of KIRs in [102]).
Remarks on the presence of some probes in the genetic signature that discriminates Controls from PPMS patients
FOXO3 [103]–[106] is downregulated in many of the PPMS samples. Deficiency in FOXO3 leads to spontaneous lymphoproliferation, associated with inflammation of several organs, in the absence of overt apoptotic defects [107]. FOXO3 regulates, by inhibiting NF-kappaB activity [108], the tolerance and activation of T cells and is proposed as an inhibitor of inflammatory transcriptional activity [107].
An interesting finding in this signature is the presence of a probe for HAR1A (highly accelerated region 1A (non-protein coding)). HAR1A was first identified in 2006 by Katherine Pollard et al. as part of a novel “RNA gene” expressed specifically in Cajal-Retzius neurons in the developing human neocortex from 7 to 19 weeks of gestation [109] and co-expressed with reelin (which is an extracelluar matrix protein that is considered essential in the laminar organization of structures in the brain during development). Panteri et al. have reported that reelin is secreted by Schwann cells in the developing peripheral nerve, is dowregulated in adult stages, and induced following sciatic never injury. They have proposed reelin as a factor in determining the final calibre of myelinated axons and the absolute number of fibers per unit area in the peripheral nervous system [110]. What makes HAR1A somewhat unique is that it is one of the “highly accelerated regions” [111], where evolutionary mechanisms have created pressure for the emergence of “human-specific” brain features. HAR1A has been found by whole genome bioinformatics comparisons and is at centre stage of research on the functional genomic implications of these new non-coding RNA structures [109], [112]. In the present study, HAR1A is one of two highly accelerated regions that we point to as interesting putative biomarkers; the other is in a protein-coding region and is discussed later. We highlight, however, the presence of SNHG5 (small nucleolar RNA host gene 5 (non-protein coding)), located on chromosome 6q15 [113], [114], in this signature. Both non-protein-coding probes warrant further investigation into the role that they may have in neurological diseases, especially MS.
Other notable biomarkers include CD52, RNASE2, and EGR3 (upregulated in PPMS in comparison to Controls). The CD52 molecule (Cambridge pathology 1 antigen, CAMPATH-1 antigen) [115]–[123] is targeted by Alemtuzumab and there are recent reports that indicate that it may be an effective treatment for early MS [124]. RNASE2 (ribonuclease, RNase A family, 2 (liver, eosinophil-derived neurotoxin)) [125], [126] is linked to selective neuronal and axonal damage to white matter of cerebellum and spinal cord of experimental animals when injected intrathecally (the “Gordon phenomenon”) [127]. The upregulation of EGR3 has apparently never been previously reported – neither in PPMS nor in other clinically defined subtypes of MS – and thus could be an important finding. EGR3 is a member of the KROX/EGR family of genes that code for immediate-early transcription factors [128], [129], which regulate thymocyte proliferation during the transition from CD4−CD8− to CD4+CD8+ [130], and with EGR2 is a negative regulator of T-cell activation [131] and development (see [132]–[134]). Experiments in mice show that together with EGR1/KROX-24 and SOX10, it cooperates to activate the Myelin Protein Zero (Mpz) intron element by EGR2 [135]. A common pathway for developmental regulation of Mpz and other peripheral myelin genes has been proposed [135]. EGR3 was also linked to myelination in Schwann cells, hence dysregulation of these concerted pathways may have consequences for neuropathies [136].
Remarks on the presence of some probes in the genetic signature that discriminates Controls from RRMS patients
We again note the presence of a probe for LOC649143 (similar to HLA class II histocompatibility antigen, DRB1-9 beta chain precursor (MHC class I antigen DRB1*9) (DR-9) (DR9)). Another probe that seems to be consistently upregulated in controls but not in MS samples is for HLA-DQB1 (major histocompatibility complex, class II, DQ beta 1). This is of potential interest in view of the strong evidence that the expression of the MHC class II Allele HLA-DRB1*1501 is regulated by vitamin D [137]. The analysis involved sequencing the vitamin D response element (VDRE) in more than 1,000 chromosomes from HLA-DRB1 homozygotes; they localised a single MHC (VDRE) to the promoter region of HLA-DRB1, while there was an important variation in non-MS-associated haplotypes [137]. We also observe a number of upregulated ribosomal protein genes (including RPS10, RPS14, RPL12, RPL24, etc) in this signature.
With a different behaviour, we should cite a probe for VDR (Vitamin D (1,25- dihydroxyvitamin D3) receptor) and, as in the C/MS signature, a probe for LOC650557 (HLA class II histocompatibility antigen, DQ(W1.1) beta chain precursor (DQB1*0501)), which are upregulated in MS. Other interesting biomarkers include CA2 (Carbonic anhydrase II) (downregulated in RRMS), IRF5 (Interferon Regulatory Factor 5) and CD3D (CD3d molecule, delta (CD3-T-cell receptor complex)), both upregulated in RRMS. CA2 is localized to oligodendrocytes, myelin, and choroid plexus epithelium in the human brain [138]. In 1996, Cammer reported delays on oligodendorcyte maturation in mutant mice deficient in CA2 [139], [140].
IRF5, SOD1, NF1 (neurofibromin 1), CD3D, ADAM-17 (ADAM metallopeptidase domain 17) and ILF2/NF45 (interleukin enhancer binding factor 2, 45 kDa), on the contrary, have a tendency to be upregulated in RRMS samples. An allele in IRF5 has been reported as conferring an increased risk for inflammatory bowel diseases, systemic lupus erythematosus and MS, suggesting that there is a link between IRF5 and several autoimmune diseases [59], [141]. SOD1 and NF1 and their homologues have appeared in our gene ontology search as linked with several types of myelopathies and familial amyotrophic lateral sclerosis [142]–[151]. NF1 is expressed in cortical neurons and oligodendrocytes and sensory neurons and Schwann cells in the peripheral nervous system [152]–[154]. There are anecdotal clinical reports of neurofibromatosis type 1 and MS co-ocurring in patients [155], [156]. OMgp, the oligodendrocyte-Myelin glycoprotein gene, is within an intron of NF1 [157]. CD3D has a tendency to be upregulated in RRMS samples and is involved in TCR activation [158] and T-cell development [159]–[161]. ADAM-17 has been observed to be upregulated in MS lesions in brain tissue [162].
Viral Pathways are Significantly Overrepresented in the genetic signature that discriminates between Controls and PPMS patients
Each signature was also functionally profiled using g:PROFILER [163], which integrates several profiling resources, including Gene Ontology, KEGG and Reactome pathways, and TRANSFAC sequence motifs. Only three of the signatures, C/MS, C/RR, and C/PP, had profiles containing significant terms. However, g:PROFILER's significance test is considered to be very conservative, so profiles derived under a less stringent significance criterion, _p_-value <0.005, are provided (supporting information Table S6).
There is a group of nine ribosomal genes (RPL27, RPL35, RPL35A, RPL39, RPS5, RPS14, RPS15A, RPS27A, and RPLP0P2) in the C/PP signature that are responsible for almost all the terms in its profile (see Table S6). Most of these terms relate to influenza or translation Reactome pathways – principally translation initiation, translation elongation and influenza viral RNA transcription and replication. Although influenza itself is considered unlikely to be involved in MS, other viruses have been linked to autoimmune diseases. One viral theory of MS relates genetic sequences for viruses to similar sequences that code for the myelin sheath [164]. T cells adapted for the protein products of the virus sequence could mistakenly recognize myelin proteins as antigens and, were they to penetrate the blood-brain barrier, attack them in the brain [165], [166]. Some viruses, including influenza, do contain genetic sequences that mimic human myelin protein coding sequences [164]. Furthermore, several studies have linked exacerbation of MS lesions to viral infection [167]–[171]; however, the studies usually target the relapsing forms of the disease rather than the primary progressive form, which is where we find the connection to these ribosomal proteins linked to a viral pathway.
Analysis of Differential Gene Co-Expression
In this section, we report on the results of applying our second method of differential gene (co-)expression analysis. A kNN-MST clustering algorithm [172], [173] was applied to the detection p-value prefiltered whole genome mRNA expression data set (19,000 probes) to produce a clustering of nodes. More formally, the clustering result is a forest, a collection of disjoint graphs such that each component is a tree (a connected graph with no cycles). Each cluster corresponds to a particular tree in the forest. Each node corresponds to an mRNA probe sequence. Nodes are connected to its nearest neighbour according to a distance metric based on pair-wise differential co-expression (see Materials and Methods section for details). A pair of nodes whose expression is perfectly correlated in control samples and perfectly anti-correlated in MS samples (or vice versa) has a distance of zero; the distance increases as expression in controls and MS correlates better. In total, 448 clusters were found, 22 of which contain more than one hundred nodes. Figure 11 shows the seventeen largest clusters, one of which is depicted in greater detail in Figure 12 (Figure 11 contents are provided as a graphics markup language file in supporting information Figure S1).
Figure 11. The seventeen largest clusters.

The clustering results from using a distance measure based on changes in correlation of gene expression between classes.
Figure 12. The largest cluster from Figure 11 with a different layout.

Nodes represent probes, colour and size indicate its centrality in the graph (number of connected nodes). Some of the prominent “stars” have been labelled.
Of particular interest are nodes with many immediate neighbours – a configuration that we call a ‘_star_’. Each star contains a designated centre node and its immediate neighbours; a high cardinality star has a centre with at least twenty neighbours. A star indicates that a group of genes exhibit differential co-expression between two different class labelling; in this case to the control and MS groups only. The co-expression of the centre with each neighbour (inversely) correlates over one sample group but not the other. To illustrate, a plot of the correlation behaviour of one star centre (a probe for INSR, Insulin Receptor) with its neighbours is shown in Figure 13. In total, there were 39 high cardinality stars; the members of these stars and their correlation plots are given in supporting information Table S7 and Figure S2, respectively.
Figure 13. Correlation plot for the insulin receptor star centre (INSR).

The figure shows the correlation of scaled expression values of INSR (insulin receptor, purple line) with the average of negatively (left column) and positively (right column) correlated neighbour probes (coloured dots). The light blue vertical line separates control samples to the left and MS to the right. The figures show three different orderings: by the harmonic mean of neighbours (top row), by the star centre expression value (middle row) and by the difference between star centre and neighbours average (bottom row). The class correlation values of star centre with neighbours are shown in the top figure; for example, r(−,C) is correlation coefficient of negatively correlated probes with control samples and r(+,MS) is the correlation of positively correlated probes with MS samples. Dot colours indicate sample class: green – control, blue – PPMS, red – RRMS, yellow – SPMS. This graph illustrate patterns of differential co-expression in Control versus MS samples. In particular, on the left it can be observed that some neighbours are strongly anti-correlated with the star centre in controls (correlation coefficient −0.744) but weakly correlated in MS (0.130); on the right, the remaining neighbours are strongly correlated with the centre in controls (0.739) but weakly anti-correlated in MS (−0.233).
Profiles containing overrepresented regulatory sequences were obtained for the 39 high cardinality stars. The members of the stars were assigned to one of 15 groups according to the cluster containing the star, which were profiled for overrepresented TRANSFAC binding motifs using GATHER [95]. Figure 14 shows the complete profiles for the 15 groups. The three most significant transcription factor motifs are for SOX5 (V$SOX5_01), the CREB family (V$CREB_Q4_01), and the CREB and ATF families (V$CREBATF_Q6), all with similar p-Value <6.6E-6. Again, we also obtained higher-level regulatory sequences (Figure 14, HS column, and Table 1); the two most significant were for the E2F-1:DP-1 heterodimer (V$E2F1DP1_0) and the E2F-4:DP-2 heterodimer (V$E2F4DP2_01), with p-Values <3.31E-6.
Figure 14. TRANSFAC motif profiles for the fifteen clusters found by correlation clustering (cyan bars).

Only “key” regulators of each profile, which are found by hitting set analysis (see figure legend), are shown. The TRANSFAC profile for the set containing all the key regulators' coding genes is shown (orange bars); this profile in effect contains “higher level” regulators – regulators of regulators. Size of bar is proportional to the negative natural logarithm of _p_-value, which is also given as a number. Only significant motifs (p-value ≤0.05) are shown.
A significantly large proportion of these motifs intersect with those in the TRANSFAC profiles of the signatures (see Figure 15). In particular, 80 motifs – or 78.4% of the signature motifs and 41.5% of the star motifs – occur in at least one star profile and one signature profile (the expected likelihood of this event under uniform random selection of motifs is less than one in 109, i.e. _p-_value <10−9). A similar proportion occurs in the intersection between the star and up/down regulated signature subset profiles: 75 motifs, or 77.3% of the up/down signature subset motifs and 38.9% of the star motifs (again: _p-_value <10−9).
Figure 15. Number of motifs found in common between the different analytical approaches.

Number of motifs occurring in the A. signature profiles, B. up/down regulated signature subset profiles, and C. cluster profiles.
The significant agreement between the two approaches is notable because patterns of differential expression and differential co-expression are unlikely to contain a large number of the same genes. This is indeed the case; there are 790 and 1,256 unique probes in the signatures and stars respectively, only 53 of these (6.7% and 4.2% respectively) occur in the intersection. The agreement in the regulatory motifs between both approaches could be explained by the occurrence of transcriptional dysregulation in MS, mediated by the transcription factors associated with these particular regulatory sequences.
Remarks on the Composition of the set of “stars”
We now highlight some of the probes that correspond to “stars”, seem to indicate genes that are differentially co-expressed in MS patients.
ASPM (ASP (abnormal spindle) homolog, microcephaly associated (Drosophila)) is a centrosome protein [174] which initially was considered to be a major determinant of cortical size [175], but its function is now revisited [176]–[179], however its relatively recent positive selection status remain unquestioned. ASPM is also a highly accelerated region that holds key features that make us human [112], including perhaps language [180]–[182]. Deficits in ASPM's functions has been consistently associated with neurodevelopmental disorders, primary in microencephaly [183]–[188].
PTPRN (protein tyrosine phosphatase, receptor type, N), appears in the literature with different names (IA2, IA-2, IA-2/PTP, ICA3, ICA512, ICA 512, Islet cell antigen 512, Islet cell autoantigen 3). The literature reports associations with insulin dependent diabetes mellitus [189]–[194] and influences not only the secretion of hormones but also of neurotransmitters [195], brain development [196]. Disruption of PTPRN results in alterations in insulin secretion and glucose tolerance [197].
A probe for INSR, the Insulin Receptor (probe ILMN_1670918), has lost its pattern of co-expression with a group of 20 other probes. If the INSR has lost co-expression in MS with some other partner probes we should expect downstream effects on the insulin signaling pathway. Indeed, MAPK3 also belongs to the insulin signaling pathway and has also been identified at the centre of a star with 23 neighbours. It is noteworthy that GATHER brings Insulin signalling pathway (KEGG hsa04910, p-Value <1E-4, Bayes 5) as the most significant when all neighbours of the 39 stars are searched; 17 out of the 21 probes that appear in the insulin signalling pathway (including INSR and MAPK3 themselves) have V$KROX_06 as a binding motif, and all 21 have V$E2F_Q6, pointing again to the KROX family of proteins and E2F, now linked to insulin signalling regulation.
The star corresponding to UniGene HS.495215 (T-cell antigen receptor alpha (TCRA), probe ILMN_1820392) has 56 neighbours. Of these 56, 15 have also appeared in one of our seven genetic signatures. With the exception of only one, they have appeared in either the signatures C/PP or C/RR. There is a relative big number of ribosomal proteins associated (RPL24, RPL27, RPL35, RPS10, RPS14, RPS17 (Ribosomal proteins L24, L27, L35, S10, S14, S25, S17), LOC441246 (ribosomal protein L35 pseudogene 5), LOC285900 (ribosomal protein L6 pseudogene 20), LOC646483 (ribosomal protein L6 pseudogene 19). We have also found CD3D (CD3d molecule, delta (CD3-TCR complex)), GNL3/Nucleostemin (guanine nucleotide binding protein-like 3 (nucleolar)) SNRPD2 (small nuclear ribonucleoprotein D2 polypeptide 16.5 kDa), SEC11A/Endopeptidase SP18 (SEC11 homolog A (S. cerevisiae)), TOMM7 (translocase of outer mitochondrial membrane 7 homolog (yeast)). The only downregulated gene (in a signature SP/PP) is MAD2L1BP (MAD2L1 binding protein). From this group, it is perhaps CD3D and its the relationship with the TCRA locus that caught our immediate attention, since progress in the understanding of CD3D's functions come from studies on its deficiency, defects and/or inactivation [160], [198]–[204]. CD3D is a receptor involved in TCR activation [158] which has been recently found to be a biomarker for chronic graft-versus-host disease in mononuclear cell samples from allogeneic hematopoietic stem cell transplantation recipients [205] and primary Sjögren's syndrome [206]. CD3D promotes the progression of early thymocytes towards the double positive-stage [160], [207], [208]. GNL3/Nucleostemin, is a gene implicated in cell cycle/growth/progression [209], [210], neural progenitor activity [211], which has also been linked to bipolar disorder [212]. However, upregulation of GNL3 may also lead to apoptosis [213].
Interestingly, of the genes present in the MS signature only three, two of which are ribosomal proteins, occur in any of the 39 highest cardinality stars (all three are neighbours rather than star centres). Of the 790 genes differentially expressed in some signature, three are also star centres (PTPRN, underexpressed in C/RR; C20orf134, an uncharacterized protein overexpressed in C/PP, and Hs.443993, another uncharacterized transcribed locus overexpressed in PP/SP), while fifty appear as neighbours of star centres. Of these 53 genes, sixteen (30%) appear in a single star, the star with centre Hs.495215 (T-cell antigen receptor alpha locus, TRAV38-1), most of which come from C/PP and C/RR. The TRAV38-1 star is strongly associated with ribosomal proteins.
Discussion
In this paper we have analysed gene expression data with a variety of computational methods with the aim of uncovering transcription factors that potentially dysregulate in MS or one or more of its disease subtypes. Table 1, Table 2 and Table 3 summarise the most significant transcription factors uncovered by our methods. Of these, the most significant are KROX/EGR family members, ATF2, YY1 (Yin and Yang 1), E2F-1/DP-1 and E2F-4/DP-2 heterodimers, SOX5, DEAF1, and CREB and ATF families.
Table 3. The 25 most significantly overrepresented binding motifs/transcription factors that have coding genes involved in T cell specification.
| Binding motif | Transcription factor | Profile | Gene(s) | _p_-value | |
|---|---|---|---|---|---|
| 1. | V$KROX_Q6 (M00982) | EGR family | C/P+C/R(−) | EGR1, EGR2, EGR3 | 3.31E-06 |
| 2. | V$YY1_02 (M00069) | YY1 | C/P+C/R(+) | YY1 | 1.65E-05 |
| 3. | V$KROX_Q6 (M00982) | EGR family | C/R(−) | EGR1, EGR2, EGR3 | 6.25E-05 |
| 4. | V$KROX_Q6 (M00982) | EGR family | HS | EGR1, EGR2, EGR3 | 2.03E-04 |
| 5. | V$YY1_02 (M00069) | YY1 | C/P(+) | YY1 | 2.41E-04 |
| 6. | V$KROX_Q6 (M00982) | EGR family | C/R+C/S(−) | EGR1, EGR2, EGR3 | 4.62E-04 |
| 7. | V$ER_Q6 (M00191) | ER | All genes | ESR1 | 4.62E-04 |
| 8. | V$CETS1P54_01 (M00032) | C-ETS-1(P54) | RR/SP | ETS1 | 8.67E-04 |
| 9. | V$E2F_Q3_01 (M00918) | E2F | All genes | TFDP1 | 1.84E-03 |
| 10. | V$CDP_01 (M00095) | CUTL1 | C/P+C/R(−) | ETS1 | 2.09E-03 |
| 11. | V$YY1_02 (M00069) | YY1 | C/P+C/S(+) | YY1 | 2.22E-03 |
| 12. | V$EBF_Q6 (M00977) | EBF | final_53 | EBF | 2.48E-03 |
| 13. | V$ER_Q6 (M00191) | ER | C/P+C/R(+) | ESR1 | 2.63E-03 |
| 14. | V$KROX_Q6 (M00982) | EGR family | final_25 | EGR1, EGR2, EGR3 | 2.74E-03 |
| 15. | V$ER_Q6 (M00191) | ER | C/MS | ESR1 | 2.74E-03 |
| 16. | V$OCT1_Q6 (M00195) | OCT1 | final_25 | POU2F1 | 3.06E-03 |
| 17. | V$EBF_Q6 (M00977) | EBF | final_25 | EBF | 3.21E-03 |
| 18. | V$KROX_Q6 (M00982) | EGR family | HS | EGR1, EGR2, EGR3 | 3.21E-03 |
| 19. | V$CETS1P54_01 (M00032) | C-ETS-1(P54) | final_63 | ETS1 | 3.38E-03 |
| 20. | V$TCF1P_Q6 (M00670) | TCF1 | final_63 | YY1 | 3.38E-03 |
| 21. | V$KROX_Q6 (M00982) | EGR family | C/P(−) | EGR1, EGR2, EGR3 | 3.38E-03 |
| 22. | V$IK3_01 (M00088) | IK-3 | PP/SP | AIOLOS | 4.99E-03 |
| 23. | V$KROX_Q6 (M00982) | EGR family | All genes | EGR1, EGR2, EGR3 | 5.92E-03 |
| 24. | V$E2F_Q3_01 (M00918) | E2F | C/P+C/R(−) | TFDP1 | 5.92E-03 |
| 25. | V$ER_Q6 (M00191) | ER | C/S(−) | ESR1 | 6.22E-03 |
The YY1 transcription factor (Yin and Yang 1)
The zinc finger protein YY1 [214] can be a transcriptional activator or repressor of several genes (including those for ribosomal and nuclear-encoded mitochondrial proteins [215], [216]) and has known roles in replication, cell proliferation, differentiation, and developmental processes [214], [217]–[220]. It also regulates T-cell cytokine gene expression [221] and the immune response [222], [223] and its relationships with viral replicating processes [224]. Experiments in mice seem to indicate that the T-cell specific expression of CD3delta is regulated, in part, by YY1 which represses the promoter activity strongly in non-T cells [225]. The disruption of Epstein-Barr virus latency in B cells is induced by expression of BZLF1 immediate-early protein, and this transcription is negatively regulated by YY1 [226], [227]. A motif for inhibitory activity of YY1 on the PrP gene has been observed. The multiple functions of the YY1 transcription factor in the nervous system have been recently reviewed [226], [228], and enhanced transcription of the proteolipid protein (PLP), one of the most abundantly expressed myelin proteins, has also been observed [229].
YY1 inhibits human papillomavirus (HPV) replication in vitro, and binds the human papillomavirus-6 E1 promoter [230]. It has been suggested as a negative regulator in the differentiation-induced HPV-6 E1 promoter and the HPV life cycle (see also the link between YY1 and the long control region of HPV-16, as reported in [231]). Nearly half of the intermediate and late gene transcriptional promoters of vaccinia virus have a binding site for the YY1 transcription factor that overlaps the initiator elements, acting as a negative regulator [232]. It also seems to be implicated, together with SP1 and SP3, on the establishment or reactivation of varicella-zoster virus latency [233]. The non-structural protein NS of the Rift Valley fever virus interacts with the host protein SAP30 and with YY1, and as a consequence antagonize interferon-beta gene expression [234]. The Hepatitis C virus core interacts with the C-terminal end of the nucleolar phosphoprotein B23, and the recruitment of p300 reducing the repression effect of YY1 [235].
YY1 is considered a critical regulator of early B-cell development [236]. The perturbed expression of YY1 in the development of acute myeloid leukemia has been also highlighted by Erkeland et al. who observed that these gene tends to harbour viral integrations of the 1.4 strain of Graffi murine leukemia virus [237].
The role of overexpression of YY1 in the differentiation of oligodendrocyte progenitors has been studied in [238], conditional ablation of YY1 in the oligodencrocyte linage gives phenotypes which have defective myelination, ataxia and tremor. YY1 is then seen as a repressor of the transcriptional inhibitors of myelin gene expression (Tcf4 and Id4), by a mechanism that includes the recruitment of HDAC1 to their promoters during oligodendrocyte differentiation [239].
In summary, YY1 transcription factor seems to be playing a key role in the pathogenesis of MS or its subtypes, given its connection to processes affecting myelin protein generation, viral replication and immune response processes. It appears as one the most significant transcription factors related to the differential expression of genes in MS patients.
The EGR/KROX family
A motif for the Early Growth Response family (KROX/EGR family motif, V$KROX_Q6) was one of the most significantly overrepresented motifs identified by this study. A member of this family, EGR2/KROX-20 has been previously associated with the regulation of Schwann cells [240] (which in turn are known to be affected in some demyelinating disorders [241] – see also [242], [243]). In Schwann cells, progesterone has also been shown to stimulate KROX-20 expression [244]–[249].
Activation of KROX-20 is an indispensable transcription factor for myelination and a prerequisite for Schwann cell differentiation” [250]. EGR1 and EGR3 (we have already observed the later as upregulated in PPMS in comparison to Controls) provide a balance to EGR2/KROX-20 in Schwann cells. It has been hypothesised that the pair should be expressed prior to start myelination, be downregulated on myelination, but be again upregulated as Schwann cells dedifferentiate after injury [136] (see also [251]–[253]). There exists an antagonist effect of EGR1 and EGR2 in Schwann cells [254]. EGR1 has been previously found disregulated in a genome-wide expression profiling analysis of synchronously differentiating olygodendrocytes generated from pure precursor cells in vitro, and comparing with the program of cells in vivo. In that study, a probe for EGR1 was found to be the most strongly expressed specifically in undifferentiated oligodendrocyte precursor cells [255]. A possible joint dysregulation of members of this family could be explored to see if they have a role in the differentiation of oligodendrocytes [256], [257].
As it was the case of the YY1 transcription factor, this family role in the immune response has to be monitored as there are reports of EGR/KROX being negative regulators of T cell activation [131], having roles in T cell anergy [133], [258]–[261], upregulation of Fas ligand [262] and TNF [263], CD154/CD40 ligand on CD4 T cells [264], autoreactive T cell activation [265], upregulation of cell cycle inhibitors p21(cip1) and p27(kip) (as studied in tolerant T cells following antigen challenge in vivo), interact with NF-kappaB p50 and p65 [266], regulate proinflammatory cytokines [267], as well as thymocyte development [268], [269].
ATF2 and SOX5
Studies of homozygous shiverer mutant mice have identified ATF2 as a regulator of the expression of MAG expression at a specific stage of shi/she oligodendrocyte differentiation [270]. It was reported in 2005 that infection of macrophages by Theiler's murine encephalomyelitis virus induces a type of demyelination in mice that that that resembles human MS, and also observed induction of ATF2 30 minutes after the infection of macrophages [271]. A study of a mycobacterial antigen suggests that ATF-2 might control expression of CREB and c-Jun during T cell activation and that of expression of IFN-gamma [272].
Another transcription factor motif significantly overrepresented is SOX5 (p-value <6.59E-6). Together with SOX6, SOX5 was identified as cell-autonomously regulating several stages of oligodendrocyte development in the mouse spinal cord (via repression of specification and terminal differentiation and influence migration patterns) [273].
KROX/EGR Family and YY1 are Further Indicated by Involvement in T Cell Specification
It is widely believed that T cells are central to the pathogenesis of MS; autoreactive T cells are hypothesised to coordinate an attack against central nervous system myelin, triggering an inflammatory response leading to neurological damage. However, the origin of the autoreactive lymphocytes is unknown. We looked for a correspondence between the regulators that we found above and those of T cell specification (the process by which haematopoietic stem cells progress through intermediate progenitor cell types to mature T cells), which may help to identify a defect in the T cell developmental program in MS. Such defects have been linked to many diseases, including a proposed contribution to diabetes susceptibility in non-obese diabetic mice, with CD4+CD8+ blasts that have abnormally high expression of IL-7Ralpha, and c-Kit [274].
Cell specification is well understood for T cells compared to most other cell types and many regulators of the process have been identified. In two recent comprehensive studies, a sizeable network of regulatory relationships involved in T cell specification was constructed [275] and the expression of more than 100 regulatory genes characterized in early T cell progenitors [276]. Table 3 lists the transcription factors that are known to participate in T cell specification [275], [276] and which are indicated by our above analyses of differential expression as potentially playing a role in the pathogenesis of MS. The most significant are the KROX/EGR family and the Yin and Yang 1 transcription factor, which are both indicated in several different signatures and clusters.
YY1, IKAROS and other “legacy transcription factors” are relatively unchanged during early T-lymphocyte specification and commitment
T-cell lineage differentiation is an ongoing process in mammals with a clear transcription factor “armature” regulation [277] that is currently being thoroughly mapped [275], [278], [279]. Defects on the T-cell developmental program have been linked to many diseases, including a proposed contribution to diabetes susceptibility in non-obese diabetic mice, with CD4+CD8+ blasts that have abnormally high expression of IL-7Ralpha, and c-Kit [274].
To obtain a time-series of early T-cell development for gene expression analysis, David-Fung et al. sorted subsets of immature mouse thymocytes from postnatal, weanling mice. Stages of development were based on the expression of CD44, CD25, and the growth factor receptor c-Kit and markers CD44, CD25 and the heat-stable antigen (CD24) and CD27. In the first stages of T-cell development the cells that enter the thymus are defined as “double negative” (DN), since they do not have the T-cell markers of maturity (CD4 and CD8). David-Fung et al, indexed these stages in terms of increasing maturity as DN1 (or early T-cell precursor, ETP), DN2, DN3a, DN3b, and DN4. Using four independent series of samples (from normal, young adult mice), DN1, DN2, total DN3, and DN4 cells were collected in each of the first two sets (“sets 1 and 2”, Series A). In the second two sets (“sets 4 and 5”, Series B) the DN3 cells were subdivided into DN3a (pre-selection) and DN3b (the first stage past β-selection).
YY1, together with Ikaros (Ikzf1), MYB and other transcription factors have been shown to have minimal changes from DN1 to DN3 stage. The list of other transcription factors that have critical roles in T-cell differentiation and development, and that have minimal changes of gene expression also includes MLL1, Gfi-1, GABPα, Stat5b, Oct1 (Pou2f1), and TOX. More recently, David-Fung et al have included YY1 together with FOG-1 (Zfpm1), Gse1, and Zfp598 to this list of “legacy genes” [276]. This is in sharp contrast with other genes that have large changes in T-lineage gene expression. Examples include Aiolos (Ikzf3), Gata3 [280], [281], and others that have clear patterns of upregulation during DN1 to DN3 progression (for the complete list see [276]).
A Hypothetical Network of Transcription Factors that Dysregulate genes in MS
If transcription factors do dysregulate genes in MS, it is reasonable to suspect that some are only associated with specific disease subtypes. Based on our data, we propose the following speculative, informal initial model that links transcription factors to MS disease subtype. The model is limited to transcription factors currently known to be involved in T cell specification [275]. It is informally constructed with the transcription factors indicated by the TRANSFAC analysis of the signatures (see Figure 9), which distinguish between disease subgroups or between controls and disease subgroups.
The model is illustrated in Figure 16. Each node in the model lists transcription factors that dysregulate in one of the node's outcomes. Under the model, dysregulation by CREB/ATF, E2F families, ELK-1, MAZR and principally by KROX, V-MYB and YY1 characterises MS overall. Dysregulation by CHOP, COUP-TF, HNF4 heterodimer, DEC, FOXD3, GATA-1, PAX9-B, SRF and TEL-2 characterises PPMS. CCAAT box, E2F-1/DP-1 and E2F-4/DP-2 heterodimers, NF-kappaB (p65), TTF-1 and Zta characterises RRMS. Finally, ATF-1, HNF-4alpha1 and NF-Y are the transcription factors associated with SPMS. Lack of evidence of dysregulation by the afore mentioned groups, but dysregulation by CDX-2, E2, E47, MyoD and SP3 might indicate that exclusion from MS cannot be asserted. Note that under this model SPMS has the least characteristic group of transcription factors, and there is some overlap with MS as a whole.
Figure 16. Speculative initial sketch for a model of transcription factors currently known to be involved in T cell specification and which may also be involved in the pathogenesis of MS, showing links to disease subtype.

Other transcription factors that also need to be added to this model are those which we have found very relevant in our analysis such as the Early Growth response EGR/KROX family, ATF2, YY1 (Yin and Yang 1), E2F-1/DP-1 and E2F-4/DP-2 heterodimers, SOX5, and CREB and ATF families.
The model is intended as a starting point to motivate further research for identifying transcription factors involved in the pathogenesis of MS, as it relies on simplifying and biologically naïve assumptions – for instance, T cell specification does not occur in peripheral blood, where the samples were collected, but in the thymus, but effects on peripheral blood are still measurable. Thus, there is room for refinement and it could be extended also by considering other transcription factors such as the key regulators identified by the hitting set analyses. However, our hope is that this model can be used to corroborate other findings, single out transcription factors for more detailed research, and participate in unravelling some of the heterogeneity in MS.
Conclusions
Using state-of-the-art bioinformatics methods, our analysis uncovered a network of transcription factors that putatively contribute to the dysregulation of several genes in MS or one or more of its disease subtypes. Separate analytical methods were used on the same dataset, involving sophisticated mathematical algorithms to solve combinatorial optimization problems. We noted a convergence of findings, leading to a set of transcription factors which are involved in the early T-lymphocyte specification and commitment as well as in oligodendrocyte dedifferentiation and development. The most significant transcription factors motifs were for the Early Growth response EGR/KROX family, ATF2, YY1 (Yin and Yang 1), E2F-1/DP-1 and E2F-4/DP-2 heterodimers, SOX5, and CREB and ATF families.
Materials and Methods
Ethics Statement
Institutional Human Research Ethics Committees approval to conduct this study was obtained by the Chief Investigators of the ANZgene Consortium, that included: E08/910 from Eastern Health Research and Ethics Committee (VIC), Research Application 105/07 from Flinders Medical Centre Research Ethics Committee (SA), GU Protocol HSC/09/03/HREC from Griffith University (QLD), MEC/07/12/176 from Multi-Region Ethics Committee (NZ), 05/04/13/3.09 from Hunter New England Human Research Ethics Committee (NSW), H-505-0607 from the University of Newcastle Human Research Ethics Comitee (NSW), HREC #1980 from The University of Sydney Human Research Ethics Committee (NSW) and H0009782 from the Human Research Ethics Committee (Tasmania) Network (TAS).
Written informed consent was obtained from all subjects prior to participation in this project.
Patients, Phenotyping, and Inclusion Criteria
A cohort of 99 people with MS and 45 healthy controls was recruited from Sydney, Newcastle (NSW) and Gold Coast (QLD). Diagnosis of MS was confirmed using the revised McDonald criteria [282]. Further separation into RRMS, SPMS and PPMS cases was done according to published criteria [283], [284]. Patient demographics are given in Table 4. All patients had no immunomodulatory therapy for at least three months prior to sample collection.
Table 4. Demographics of patient and control cohorts.
| Sample | N | M∶F | Age | Age at diagnosis | Duration | EDSS |
|---|---|---|---|---|---|---|
| Controls | 45 | 16∶29 | 48.5 (23–77) | – | – | – |
| MS | 99 | 33∶66 | 54 (28–97) | 35.5 (16–59) | 16.5 (1–54) | 4.5 (0–9) |
| PPMS | 43 | 21∶22 | 55.3 (30–87) | 42 (21–58) | 13 (5–31) | 5.6 (2–8) |
| RRMS | 36 | 7∶29 | 48.5 (29–65) | 33 (19–56) | 15 (1–36) | 2.7 (0–6.5) |
| SPMS | 20 | 5∶15 | 57.5 (34–73) | 35.5 (16–59) | 22 (2–54) | 6.5 (4–9) |
RNA Extraction, Microarray Protocols
The peripheral blood samples were collected between 9AM and 1PM and total RNA was extracted from the whole blood in PAXgene tubes using PAXgene™ Blood RNA kit (Qiagen, Germany) according to the manufacturer's instruction unless otherwise stated. Total RNA quality was assessed and its concentration was measured using Agilent RNA 6000 series II Nano kit (Agilent Technologies, CA, USA). Minimum RNA Integrity Number (RIN) of >7 was employed for each sample to pass the quality assessment. 250 ng total RNA from each sample was biotinylated and amplified using Illumina® TotalPrep RNA Amplification Kit (Ambion, TX, USA). Total RNA was reverse transcribed to synthesize first strand of cDNA followed by second strand synthesis. Double stranded cDNA was then transcribed and amplified in vitro to synthesize biotin labelled complementary mRNA (cRNA). The cRNA yield was measured at 260 nm using NanoDrop 1000A Spectrophotometer. 750 ng of cRNA sample was hybridized on a human HT-12 expression beadchip (Illumina Inc., CA, USA) profiling 48,804 transcripts per sample. The chips were stained with streptavidin-Cye3 conjugate and scanned using an Illumina BeadArray Reader (Illumina Inc.).
The dataset is available in Gene Expression Omnibus under the reference GSE17048.
Normalisation and Initial Pre-Filtering
The average signal intensity for each gene was measured using Beadstudio v3. The sample signals were normalized with cubic spline in order to minimize variation due to non-biological factors. Approximately 19,000 genes were selected for differential expression analysis with detection _p_-value <0.01 for at least one of all samples. The detection _p_-value measures the probability of observing signal without specific probe-target hybridization.
Analysis of Differential Expression
A genetic ‘signature’ was obtained from the detection p-value filtered dataset for each pair of sample groups by applying an additional two-step filtering process, which removed probes lacking sufficient discriminative power according to information content and predictive ability respectively.
- An entropy-based selection procedure employing Fayyad and Irani's multi-class, multi-interval discretisation algorithm [88] was applied. For each probe sequence, the algorithm finds the threshold that minimizes the class-information entropy of the samples, which discretises the dataset (greater than threshold – 1; less – 0). It then discards the genes that do not sufficiently discriminate between the sample groups according to the minimum description length principle.
- Following, an (α,β) _k_-feature set selection method [89], [90] was applied. The (α,β) _k_-feature set problem asks, in this context, for the smallest subset of probe sequences containing: i) at least α probes differentially expressed (after discretisation) between every pair of samples in the Cartesian product of the two sample groups (a probe is differentially expressed between a pair if their values are 0 and 1), and ii) at least β probes with equal (discretised) value for all pairs over the Cartesian product of the sample groups. Intuitively, α and β specify the degree of inter-class differentiation and intra-class similarity respectively. In practise, we use α maximum and β maximal to facilitate computation of a solution; Table 5 gives the (α,β) values (and various summary statistics) for each signature. We refer the reader to [89], [91]–[93] for mathematical details and applications of the approach.
Table 5. Summary of (α,β) _k-_feature set selection results for each signature.
| 0-Centered | 1-Centered | |||||||||||
|---|---|---|---|---|---|---|---|---|---|---|---|---|
| #0 | #1 | # EntF | Nalfa | Amax | #ABK | Nbeta | Bmax | Bmxml | Nbeta | Bmax | Bmxml | |
| C/MS | 45 | 99 | 369 | 4455 | 40 | 145 | 990 | 232 | 79 | 4851 | 107 | 58 |
| C/PP | 45 | 43 | 360 | 1935 | 66 | 221 | 990 | 209 | 113 | 903 | 170 | 113 |
| C/RR | 45 | 36 | 366 | 1620 | 73 | 260 | 990 | 235 | 154 | 630 | 160 | 131 |
| C/SP | 45 | 20 | 317 | 900 | 40 | 113 | 990 | 245 | 67 | 190 | 124 | 67 |
| PP/SP | 43 | 20 | 133 | 860 | 23 | 77 | 903 | 90 | 48 | 190 | 83 | 53 |
| RR/PP | 36 | 43 | 126 | 1548 | 25 | 86 | 630 | 82 | 55 | 903 | 75 | 49 |
| RR/SP | 36 | 20 | 113 | 720 | 24 | 66 | 630 | 66 | 32 | 190 | 80 | 48 |
Analysis of Differential Co-expression
A cluster map was constructed for the approximately 19,000 probe sequences found to be expressed in whole blood, using a kNN-MST graph clustering analysis [172], [173]. The map connects each probe to its nearest neighbour under the distance metric
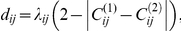
where dij is the distance between probes i and j, Cij (k) ∈ [-1,1] is the correlation between i and j in class k (class 1 is controls and class 2 is MS, all subtypes), and
Correlation values are computed as a normalized sum of the Pearson and Spearman correlation coefficients, which is robust against outliers. The minimum distance between a pair of probe sequences is dij = 0, which occurs when the expression of i and j are perfectly correlated over controls and perfectly anti-correlated over disease (or vice versa). A distance of dij = 1, which is relatively short, occurs between a pair of probe sequences correlated (or anti-correlated) over controls and uncorrelated over disease.
With this definition of distance, high cardinality stars are particularly important since all (or almost all) the immediate neighbours of the centre have changed or lost correlation with the centre in disease. Under our working hypothesis, this effect is attributed to dysregulation of the transcription factor(s) associated with the centre and not with the neighbours.
Hitting Set Filter
Our hitting set filter is formally defined as follows. Consider a set S (of TRANSFAC motifs), a collection C of n subsets C 1,…,Cn ⊆ S, and a positive integer m. The elements of S have positive weights ws (p_-values), µ_s ∈ S. We seek a subset HS ⊆ S such that |HS ∩ Ci| ≥ _m, i = 1,_…,n, and Σs ws is minimal. Such a set HS, if it exists, is a weight-minimal hitting set because it ‘hits’ all subsets Ci at least m times.
To illustrate, consider the hitting set instance given in the matrix shown in Table 6 (left). Each subset Ci is defined by Ci = {sj | M(i, j) = ‘x’ }, where M(i,j) is the i,_j_th entry in the matrix with the row for w removed; for example, C 3 = {s 1, s 3, s 5}.
Table 6. Hitting Set Example.
| S | ||||||||
|---|---|---|---|---|---|---|---|---|
| s 1 | s 2 | s 3 | s 6 | s 5 | m | HS | ||
| w s | 5 | 6 | 6 | 7 | 8 | 1 | s 1 | |
| C | C 1 | x | x | x | x | x | 2 | s 1, s 5 |
| C 2 | x | x | x | x | 3 | s 1, s 2, s 3, s 5 | ||
| C 3 | x | x | x | 4 | No solution |
On the right, weight minimal solutions are shown for m = 1,…,4. Note that there is a two-fold effect as m grows: first, |HS| tends to increase with m; but second, beyond a certain point no satisfying HS exists. Throughout this paper, m = 1, 2, and 3.
We employed CPLEX, an integer linear programming tool, to efficiently compute solutions to the hitting set instances. The hitting set problem can be formulated as an integer linear programming problem as follows
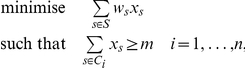
where xs = 1 if s ∈ HS, xs = 0 otherwise.
Supporting Information
Table S1
Signature Control - MS. Heatmap and annotation for the C/MS signature. Probe Ids, expression values, hitting set annotation, and gene annotations are given.
(1.08 MB XLS)
Table S2
Signatures Control - RRMS and Control - SPMS. For each signature, the probe Ids, expression values, heatmap, hitting set annotation, and gene annotations are given.
(1.88 MB XLS)
Table S3
Signatures Control - PPMS, PPMS - SPMS, RRMS - PPMS and RRMS - SPMS. For each signature, the probe Ids, expression values, heatmap, hitting set annotation, and gene annotations are given.
(2.27 MB XLS)
Table S4
(α,β) k-feature set summary statistics. Summary statistics of the (α,β) k-feature set selection process for each of the signatures and combined listing of all signatures, showing over or under expression and signature overlap. Overlap with the signatures in the companion study are also given.
(0.52 MB XLS)
Table S5
TRANSFAC Profiles. Excel file containing the TRANSFAC profiles for the 7 signatures, 14 up/down-regulated signature subsets, and 15 star clusters.
(0.30 MB XLS)
Table S6
g:Profiler functional profiles for signatures. Functional profiles for each signature. Profiling was performed with g:PROFILER [163], which integrates several profiling resources, including Gene Ontology, KEGG and Reactome pathways, and TRANSFAC sequence motifs. Note that a group of six ribosomal protein genes (RPL10A, RPL12, RPL39, RPS17, RPS21, and RPS25P8) are responsible for over half of the significant terms (17 of the 30) in the C/MS profile, and are linked to viral and translation pathways. Similarly, there is a group of nine ribosomal genes (RPL27, RPL35, RPL35A, RPL39, RPS5, RPS14, RPS15A, RPS27A, and RPLP0P2) that are responsible for almost all the significant Reactome pathway terms in the profile for C/PP; most of these terms relate to influenza or translation pathways - principally translation initiation, translation elongation and influenza viral RNA transcription and replication.
(0.47 MB PDF)
Table S7
Members of high cardinality stars. Complete member listing of all 39 high cardinality stars.
(0.29 MB XLS)
Figure S1
Stars correlation plots. Correlation plots for all high cardinality stars.
(8.18 MB PDF)
Figure S2
Largest clusters. The seventeen largest clusters found by analysis of genes differentially co-expressed over controls and MS. Figure is in GML format.
(0.44 MB ZIP)
Acknowledgments
We would like to thank people with MS in Australia and New Zealand for supporting this research. We are grateful to Multiple Sclerosis Research Australia for supporting this project, and in particular to the expediting efforts from Mr Jeremy Wright and Ms Christine Remediakis.
The Australia and New Zealand Multiple Sclerosis Genetics Consortium (ANZgene). Study design and management committee. The ANZgene Consortium members (in alphabetical order):
Melanie Bahlo1, David R. Booth2, Simon A. Broadley3,4, Matthew A. Brown5,6, Brian L. Browning7, Sharon R. Browning7, Helmut Butzkueven8, William M. Carroll9,10,11, Patrick Danoy5, Judith Field8, Simon J. Foote12, Lyn R. Griffiths13, Robert N. Heard2, Allan G. Kermode9,10,11, Trevor J. Kilpatrick9,14,15, Jeanette Lechner-Scott16,17, Deborah Mason21, Pablo Moscato17,18, Victoria M. Perreau14, Rodney J. Scott16,17,18, Mark Slee19, Jim Stankovich12, Graeme J. Stewart2, Bruce V. Taylor12, James Wiley20 (Chair).
1 The Walter and Eliza Hall Institute of Medical Research, Parkville, Australia,
2 The Westmead Millennium Institute, Westmead, Australia,
3 School of Medicine, Griffith University, Brisbane, Australia,
4 Department of Neurology, Gold Coast Hospital, Southport, Australia,
5 Diamantina Institute of Cancer, Immunology and Metabolic Medicine, Princess Alexandra Hospital, University of Queensland, Brisbane, Australia,
6 Botnar Research Centre, Nuffield Department of Orthopaedic Surgery, University of Oxford, Oxford, United Kingdom,
7 Department of Statistics, The University of Auckland, Auckland, New Zealand,
8 The Howard Florey Institute, University of Melbourne, Melbourne, Australia,
9 Sir Charles Gairdner Hospital, Nedlands, Australia,
10 Australian Neuromuscular Research Institute, Nedlands, Australia,
11 Centre for Neuromuscular and Neurological Disorders, University of Western Australia, Nedlands, Australia,
12 Menzies Research Institute, University of Tasmania, Hobart, Australia,
13 Genomics Research Centre, Griffith University, Brisbane, Australia,
14 Centre for Neuroscience, University of Melbourne, Melbourne, Australia,
15 Royal Melbourne Hospital, Parkville, Australia,
16 John Hunter Hospital, Hunter New England Health Service, Newcastle, Australia,
17 Hunter Medical Research Institute, Newcastle, Australia,
18 Centre for Bioinformatics, Biomarker Discovery and Information-based Medicine, The University of Newcastle, Newcastle, Australia,
19 School of Medicine, Department of Neurology, Flinders University, Bedford Park, Adelaide, Australia,
20 Department of Medicine, Nepean Hospital, Penrith, Australia,
21 Canterbury District Health Board, Christchurch, New Zealand.
Footnotes
Competing Interests: The authors have declared that no competing interests exist.
Funding: This project had the following sources of funding: Australian Research Council Centre of Excellence in Bioinformatics (PM), Australian Research Council Linkage Project LP0776744 (ANZgene, MS Research Australia), Australian Research Council Discovery project DP0559755 (PM and RB) and DP0773279 (PM, RS and DM). The University of Newcastle via central funding to the Priority Research Centre in Bioinformatics, Biomarker Discovery and Information-based Medicine (PM, RS, RB, CR, DM, MIP). The University of Newcastle's Strategic Initiative Fund for project: Newcastle Bioinformatics Initiative, 2003-2007 (PM, RB, MIP). Universidad de Santiago de Chile, Departamento de Investigaciones Científicas y Tecnológicas project 060919IP (MIP). Australia Research Council Biogen Idec PhD award (KG). Grant from the John Hunter Hospital Charitable Trust Fund and a special grant from Macquarie Bank (MBC). The funders had no role in study design, data collection and analysis, decision to publish, or preparation of the manuscript.
References
- 1.Compston A, McDonald I, Noseworthy J, Lassmann H, Miller D, et al. Philadelphia: McAlpine's multiple sclerosis: Churchill Livingstone Elsevier; 2005. [Google Scholar]
- 2.Hauser SL, Oksenberg JR. The Neurobiology of Multiple Sclerosis: Genes, Inflammation, and Neurodegeneration. 2006;52:61–76. doi: 10.1016/j.neuron.2006.09.011. [DOI] [PubMed] [Google Scholar]
- 3.Hirtz D, Thurman DJ, Gwinn-Hardy K, Mohamed M, Chaudhuri AR, et al. How common are the “common” neurologic disorders? Neurology. 2007;68:326–337. doi: 10.1212/01.wnl.0000252807.38124.a3. [DOI] [PubMed] [Google Scholar]
- 4.Pugliatti M, Harbo HF, Holmoy T, Kampman MT, Myhr KM, et al. Environmental risk factors in multiple sclerosis. Acta Neurol Scand. 2008;(Suppl 188):34–40. doi: 10.1111/j.1600-0404.2008.01029.x. [DOI] [PubMed] [Google Scholar]
- 5.Ramagopalan SV, Dyment DA, Ebers GC. Genetic epidemiology: the use of old and new tools for multiple sclerosis. Trends Neurosci. 2008;31:645–652. doi: 10.1016/j.tins.2008.09.001. [DOI] [PubMed] [Google Scholar]
- 6.Ebers GC. Environmental factors and multiple sclerosis. Lancet Neurol. 2008;7:268–277. doi: 10.1016/S1474-4422(08)70042-5. [DOI] [PubMed] [Google Scholar]
- 7.Hawkes C, Macgregor A. Twin studies and the heritability of MS: a conclusion. Multiple Sclerosis. 2009;15:661–667. doi: 10.1177/1352458509104592. [DOI] [PubMed] [Google Scholar]
- 8.Smestad C, Sandvik L, Holmoy T, Harbo HF, Celius EG. Marked differences in prevalence of multiple sclerosis between ethnic groups in Oslo, Norway. J Neurol. 2008;255:49–55. doi: 10.1007/s00415-007-0659-8. [DOI] [PubMed] [Google Scholar]
- 9.Rosati G. The prevalence of multiple sclerosis in the world: an update. Neurological Sciences. 2001;22:117–139. doi: 10.1007/s100720170011. [DOI] [PubMed] [Google Scholar]
- 10.Alter M, Kahana E, Zilber N, Miller A for the Israeli MS Study Group. Multiple sclerosis frequency in Israel's diverse populations. Neurology. 2006;66:1061–1066. doi: 10.1212/01.wnl.0000204194.47925.0d. [DOI] [PubMed] [Google Scholar]
- 11.Svejgaard A. The immunogenetics of multiple sclerosis. Immunogenetics. 2008;60:275–286. doi: 10.1007/s00251-008-0295-1. [DOI] [PubMed] [Google Scholar]
- 12.The International Multiple Sclerosis Genetics Consortium. Risk Alleles for Multiple Sclerosis Identified by a Genomewide Study. N Engl J Med. 2007;357:851–862. doi: 10.1056/NEJMoa073493. [DOI] [PubMed] [Google Scholar]
- 13.Gregory SG, Schmidt S, Seth P, Oksenberg JR, Hart J, et al. Interleukin 7 receptor [alpha] chain (IL7R) shows allelic and functional association with multiple sclerosis. Nat Genet. 2007;39:1083–1091. doi: 10.1038/ng2103. [DOI] [PubMed] [Google Scholar]
- 14.Rubio JP, Stankovich J, Field J, Tubridy N, Marriott M, et al. Replication of KIAA0350, IL2RA, RPL5 and CD58 as multiple sclerosis susceptibility genes in Australians. Genes Immun. 2008;9:624–630. doi: 10.1038/gene.2008.59. [DOI] [PubMed] [Google Scholar]
- 15.Akkad DA, Hoffjan S, Petrasch-Parwez E, Beygo J, Gold R, et al. Variation in the IL7RA and IL2RA genes in German multiple sclerosis patients. Journal of Autoimmunity. 2009;32:110–115. doi: 10.1016/j.jaut.2009.01.002. [DOI] [PubMed] [Google Scholar]
- 16.Ramagopalan SV, Anderson C, Sadovnick AD, Ebers GC, Matesanz F, et al. Genomewide Study of Multiple Sclerosis. N Engl J Med. 2007;357:2199–2201. doi: 10.1056/NEJMc072836. [DOI] [PubMed] [Google Scholar]
- 17.International Multiple Sclerosis Genetics Consortium. The expanding genetic overlap between multiple sclerosis and type I diabetes. Genes Immun. 2008;10:11–14. doi: 10.1038/gene.2008.83. [DOI] [PMC free article] [PubMed] [Google Scholar]
- 18.Aulchenko YS, Hoppenbrouwers IA, Ramagopalan SV, Broer L, Jafari N, et al. Genetic variation in the KIF1B locus influences susceptibility to multiple sclerosis. Nat Genet. 2008;40:1402–1403. doi: 10.1038/ng.251. [DOI] [PubMed] [Google Scholar]
- 19.Ban M, Goris A, Lorentzen AR, Baker A, Mihalova T, et al. Replication analysis identifies TYK2 as a multiple sclerosis susceptibility factor. Eur J Hum Genet. 2009 doi: 10.1038/ejhg.2009.41. [DOI] [PMC free article] [PubMed] [Google Scholar]
- 20.De Jager PL, Jia X, Wang J, de Bakker PI, Ottoboni L, et al. Meta-analysis of genome scans and replication identify CD6, IRF8 and TNFRSF1A as new multiple sclerosis susceptibility loci. Nat Genet. 2009;41:776–782. doi: 10.1038/ng.401. [DOI] [PMC free article] [PubMed] [Google Scholar]
- 21.The Australia and New Zealand Multiple Sclerosis Genetics Consortium (ANZgene) Genome-wide association study identifies new multiple sclerosis susceptibility loci on chromosomes 12 and 20. Nat Genet. 2009;41:824–828. doi: 10.1038/ng.396. [DOI] [PubMed] [Google Scholar]
- 22.Baranzini SE, Wang J, Gibson RA, Galwey N, Naegelin Y, et al. Genome-wide association analysis of susceptibility and clinical phenotype in multiple sclerosis. Hum Mol Genet. 2009;18:767–778. doi: 10.1093/hmg/ddn388. [DOI] [PMC free article] [PubMed] [Google Scholar]
- 23.Brynedal B, Bomfim IL, Olsson T, Duvefelt K, Hillert J. Differential expression, and genetic association, of CD58 in Swedish multiple sclerosis patients. Proceedings of the National Academy of Sciences. 2009;106:E58–E58. doi: 10.1073/pnas.0904338106. [DOI] [PMC free article] [PubMed] [Google Scholar]
- 24.Hillert J, Gronnig M, Nyland H, Link H, Olerup O. An immunogenetic heterogeneity in multiple sclerosis. J Neurol Neurosurg Psychiatry. 1992;55:887–890. doi: 10.1136/jnnp.55.10.887. [DOI] [PMC free article] [PubMed] [Google Scholar]
- 25.Olerup O, Hillert J, Fredrikson S, Olsson T, Kam-Hansen S, et al. Primarily chronic progressive and relapsing/remitting multiple sclerosis: two immunogenetically distinct disease entities. Proc Natl Acad Sci USA. 1989;86:7113–7117. doi: 10.1073/pnas.86.18.7113. [DOI] [PMC free article] [PubMed] [Google Scholar]
- 26.Francis D, Thompson A, Brookes P, Davey N, Lechler R, et al. Multiple sclerosis and HLA: is the susceptibility gene really HLA-DR or -DQ? Human immunology. 1991;32:119–124. doi: 10.1016/0198-8859(91)90108-l. [DOI] [PubMed] [Google Scholar]
- 27.Dermitzakis ET. From gene expression to disease risk. Nat Genet. 2008;40:492–493. doi: 10.1038/ng0508-492. [DOI] [PubMed] [Google Scholar]
- 28.Gandhi KS, McKay FC, Cox M, Riveros C, Armstrong N, et al. The multiple sclerosis whole blood mRNA transcriptome and genetic associations indicate dysregulation of specific T cell pathways in pathogenesis. Hum Mol Genet. doi: 10.1093/hmg/ddq090. [DOI] [PubMed] [Google Scholar]
- 29.Eggert M, Kluter A, Zettl UK, Neeck G. Transcription Factors in Autoimmune Diseases. Frontiers in Medicinal Chemistry. 2006;3:383–397. [Google Scholar]
- 30.Peng SL. Transcription factors in autoimmune diseases. Front Biosci. 2008;13:4218–4240. doi: 10.2741/3001. [DOI] [PubMed] [Google Scholar]
- 31.Li H, Lu Y, Smith HK, Richardson WD. Olig1 and Sox10 interact synergistically to drive myelin basic protein transcription in oligodendrocytes. J Neurosci. 2007;27:14375–14382. doi: 10.1523/JNEUROSCI.4456-07.2007. [DOI] [PMC free article] [PubMed] [Google Scholar]
- 32.O'Connor RA, Anderton SM. Foxp3+ regulatory T cells in the control of experimental CNS autoimmune disease. J Neuroimmunol. 2008;193:1–11. doi: 10.1016/j.jneuroim.2007.11.016. [DOI] [PubMed] [Google Scholar]
- 33.Zaheer S, Wu Y, Bassett J, Yang B, Zaheer A. Glia maturation factor regulation of STAT expression: a novel mechanism in experimental autoimmune encephalomyelitis. Neurochem Res. 2007;32:2123–2131. doi: 10.1007/s11064-007-9383-0. [DOI] [PubMed] [Google Scholar]
- 34.Chavanas S, Adoue V, Mechin MC, Ying S, Dong S, et al. Long-range enhancer associated with chromatin looping allows AP-1 regulation of the peptidylarginine deiminase 3 gene in differentiated keratinocyte. PLoS ONE. 2008;3:e3408. doi: 10.1371/journal.pone.0003408. [DOI] [PMC free article] [PubMed] [Google Scholar]
- 35.Christophi GP, Hudson CA, Gruber RC, Christophi CP, Mihai C, et al. SHP-1 deficiency and increased inflammatory gene expression in PBMCs of multiple sclerosis patients. Lab Invest. 2008;88:243–255. doi: 10.1038/labinvest.3700720. [DOI] [PMC free article] [PubMed] [Google Scholar]
- 36.Kuipers HF, Biesta PJ, Montagne LJ, van Haastert ES, van der Valk P, et al. CC chemokine receptor 5 gene promoter activation by the cyclic AMP response element binding transcription factor. Blood. 2008;112:1610–1619. doi: 10.1182/blood-2008-01-135111. [DOI] [PubMed] [Google Scholar]
- 37.Martinez-Forero I, Garcia-Munoz R, Martinez-Pasamar S, Inoges S, Lopez-Diaz de Cerio A, et al. IL-10 suppressor activity and ex vivo Tr1 cell function are impaired in multiple sclerosis. Eur J Immunol. 2008;38:576–586. doi: 10.1002/eji.200737271. [DOI] [PubMed] [Google Scholar]
- 38.Hur EM, Youssef S, Haws ME, Zhang SY, Sobel RA, et al. Osteopontin-induced relapse and progression of autoimmune brain disease through enhanced survival of activated T cells. Nat Immunol. 2007;8:74–83. doi: 10.1038/ni1415. [DOI] [PubMed] [Google Scholar]
- 39.Rodriguez M, Zoecklein L, Gamez JD, Pavelko KD, Papke LM, et al. STAT4- and STAT6-signaling molecules in a murine model of multiple sclerosis. FASEB J. 2006;20:343–345. doi: 10.1096/fj.05-4650fje. [DOI] [PubMed] [Google Scholar]
- 40.Qin H, Wilson CA, Lee SJ, Zhao X, Benveniste EN. LPS induces CD40 gene expression through the activation of NF-kappaB and STAT-1alpha in macrophages and microglia. Blood. 2005;106:3114–3122. doi: 10.1182/blood-2005-02-0759. [DOI] [PMC free article] [PubMed] [Google Scholar]
- 41.Flores N, Duran C, Blasco MR, Puerta C, Dorado B, et al. NFkappaB and AP-1 DNA binding activity in patients with multiple sclerosis. J Neuroimmunol. 2003;135:141–147. doi: 10.1016/s0165-5728(02)00440-x. [DOI] [PubMed] [Google Scholar]
- 42.Miterski B, Bohringer S, Klein W, Sindern E, Haupts M, et al. Inhibitors in the NFkappaB cascade comprise prime candidate genes predisposing to multiple sclerosis, especially in selected combinations. Genes Immun. 2002;3:211–219. doi: 10.1038/sj.gene.6363846. [DOI] [PubMed] [Google Scholar]
- 43.Kim MO, Si Q, Zhou JN, Pestell RG, Brosnan CF, et al. Interferon-beta activates multiple signaling cascades in primary human microglia. J Neurochem. 2002;81:1361–1371. doi: 10.1046/j.1471-4159.2002.00949.x. [DOI] [PubMed] [Google Scholar]
- 44.Huang CJ, Nazarian R, Lee J, Zhao PM, Espinosa-Jeffrey A, et al. Tumor necrosis factor modulates transcription of myelin basic protein gene through nuclear factor kappa B in a human oligodendroglioma cell line. Int J Dev Neurosci. 2002;20:289–296. doi: 10.1016/s0736-5748(02)00022-9. [DOI] [PubMed] [Google Scholar]
- 45.Feng X, Petraglia AL, Chen M, Byskosh PV, Boos MD, et al. Low expression of interferon-stimulated genes in active multiple sclerosis is linked to subnormal phosphorylation of STAT1. J Neuroimmunol. 2002;129:205–215. doi: 10.1016/s0165-5728(02)00182-0. [DOI] [PubMed] [Google Scholar]
- 46.Gobin SJ, Montagne L, Van Zutphen M, Van Der Valk P, Van Den Elsen PJ, et al. Upregulation of transcription factors controlling MHC expression in multiple sclerosis lesions. Glia. 2001;36:68–77. doi: 10.1002/glia.1096. [DOI] [PubMed] [Google Scholar]
- 47.Colombatti M, Moretto G, Tommasi M, Fiorini E, Poffe O, et al. Human MBP-specific T cells regulate IL-6 gene expression in astrocytes through cell-cell contacts and soluble factors. Glia. 2001;35:224–233. doi: 10.1002/glia.1087. [DOI] [PubMed] [Google Scholar]
- 48.Azimi N, Mariner J, Jacobson S, Waldmann TA. How does interleukin 15 contribute to the pathogenesis of HTLV type 1-associated myelopathy/tropical spastic paraparesis? AIDS Res Hum Retroviruses. 2000;16:1717–1722. doi: 10.1089/08892220050193209. [DOI] [PubMed] [Google Scholar]
- 49.Hilliard B, Samoilova EB, Liu TS, Rostami A, Chen Y. Experimental autoimmune encephalomyelitis in NF-kappa B-deficient mice: roles of NF-kappa B in the activation and differentiation of autoreactive T cells. J Immunol. 1999;163:2937–2943. [PubMed] [Google Scholar]
- 50.Bonetti B, Stegagno C, Cannella B, Rizzuto N, Moretto G, et al. Activation of NF-kappaB and c-jun transcription factors in multiple sclerosis lesions. Implications for oligodendrocyte pathology. Am J Pathol. 1999;155:1433–1438. doi: 10.1016/s0002-9440(10)65456-9. [DOI] [PMC free article] [PubMed] [Google Scholar]
- 51.Weinstock-Guttman B, Bhasi K, Badgett D, Tamano-Blanco M, Minhas M, et al. Genomic effects of once-weekly, intramuscular interferon-beta1a treatment after the first dose and on chronic dosing: Relationships to 5-year clinical outcomes in multiple sclerosis patients. J Neuroimmunol. 2008;205:113–125. doi: 10.1016/j.jneuroim.2008.09.004. [DOI] [PubMed] [Google Scholar]
- 52.Frisullo G, Nociti V, Iorio R, Patanella AK, Marti A, et al. The persistency of high levels of pSTAT3 expression in circulating CD4+ T cells from CIS patients favors the early conversion to clinically defined multiple sclerosis. J Neuroimmunol. 2008;205:126–134. doi: 10.1016/j.jneuroim.2008.09.003. [DOI] [PubMed] [Google Scholar]
- 53.Satoh J, Misawa T, Tabunoki H, Yamamura T. Molecular network analysis of T-cell transcriptome suggests aberrant regulation of gene expression by NF-kappaB as a biomarker for relapse of multiple sclerosis. Dis Markers. 2008;25:27–35. doi: 10.1155/2008/824640. [DOI] [PMC free article] [PubMed] [Google Scholar]
- 54.Martinez A, Varade J, Marquez A, Cenit MC, Espino L, et al. Association of the STAT4 gene with increased susceptibility for some immune-mediated diseases. Arthritis Rheum. 2008;58:2598–2602. doi: 10.1002/art.23792. [DOI] [PubMed] [Google Scholar]
- 55.Liu X, Lee YS, Yu CR, Egwuagu CE. Loss of STAT3 in CD4+ T cells prevents development of experimental autoimmune diseases. J Immunol. 2008;180:6070–6076. doi: 10.4049/jimmunol.180.9.6070. [DOI] [PMC free article] [PubMed] [Google Scholar]
- 56.Zeis T, Graumann U, Reynolds R, Schaeren-Wiemers N. Normal-appearing white matter in multiple sclerosis is in a subtle balance between inflammation and neuroprotection. Brain. 2008;131:288–303. doi: 10.1093/brain/awm291. [DOI] [PubMed] [Google Scholar]
- 57.Fortunato G, Calcagno G, Bresciamorra V, Salvatore E, Filla A, et al. Multiple sclerosis and hepatitis C virus infection are associated with single nucleotide polymorphisms in interferon pathway genes. J Interferon Cytokine Res. 2008;28:141–152. doi: 10.1089/jir.2007.0049. [DOI] [PubMed] [Google Scholar]
- 58.Taki S. Type I interferons and autoimmunity: lessons from the clinic and from IRF-2-deficient mice. Cytokine Growth Factor Rev. 2002;13:379–391. doi: 10.1016/s1359-6101(02)00023-0. [DOI] [PubMed] [Google Scholar]
- 59.Kristjansdottir G, Sandling JK, Bonetti A, Roos IM, Milani L, et al. Interferon regulatory factor 5 (IRF5) gene variants are associated with multiple sclerosis in three distinct populations. J Med Genet. 2008;45:362–369. doi: 10.1136/jmg.2007.055012. [DOI] [PMC free article] [PubMed] [Google Scholar]
- 60.Klotz L, Schmidt S, Heun R, Klockgether T, Kolsch H. Association of the PPARgamma gene polymorphism Pro12Ala with delayed onset of multiple sclerosis. Neurosci Lett. 2009;449:81–83. doi: 10.1016/j.neulet.2008.10.066. [DOI] [PubMed] [Google Scholar]
- 61.Bright JJ, Walline CC, Kanakasabai S, Chakraborty S. Targeting PPAR as a therapy to treat multiple sclerosis. Expert Opin Ther Targets. 2008;12:1565–1575. doi: 10.1517/14728220802515400. [DOI] [PubMed] [Google Scholar]
- 62.Schmidt S, Moric E, Schmidt M, Sastre M, Feinstein DL, et al. Anti-inflammatory and antiproliferative actions of PPAR-gamma agonists on T lymphocytes derived from MS patients. J Leukoc Biol. 2004;75:478–485. doi: 10.1189/jlb.0803402. [DOI] [PubMed] [Google Scholar]
- 63.Mrak RE, Landreth GE. PPARgamma, neuroinflammation, and disease. J Neuroinflammation. 2004;1:5. doi: 10.1186/1742-2094-1-5. [DOI] [PMC free article] [PubMed] [Google Scholar]
- 64.Lovett-Racke AE, Hussain RZ, Northrop S, Choy J, Rocchini A, et al. Peroxisome proliferator-activated receptor alpha agonists as therapy for autoimmune disease. J Immunol. 2004;172:5790–5798. doi: 10.4049/jimmunol.172.9.5790. [DOI] [PubMed] [Google Scholar]
- 65.Feinstein DL. Therapeutic potential of peroxisome proliferator-activated receptor agonists for neurological disease. Diabetes Technol Ther. 2003;5:67–73. doi: 10.1089/152091503763816481. [DOI] [PubMed] [Google Scholar]
- 66.O'Keefe GM, Nguyen VT, Benveniste EN. Regulation and function of class II major histocompatibility complex, CD40, and B7 expression in macrophages and microglia: Implications in neurological diseases. J Neurovirol. 2002;8:496–512. doi: 10.1080/13550280290100941. [DOI] [PubMed] [Google Scholar]
- 67.Nguyen VT, Benveniste EN. Critical role of tumor necrosis factor-alpha and NF-kappa B in interferon-gamma -induced CD40 expression in microglia/macrophages. J Biol Chem. 2002;277:13796–13803. doi: 10.1074/jbc.M111906200. [DOI] [PubMed] [Google Scholar]
- 68.Diab A, Deng C, Smith JD, Hussain RZ, Phanavanh B, et al. Peroxisome proliferator-activated receptor-gamma agonist 15-deoxy-Delta(12,14)-prostaglandin J(2) ameliorates experimental autoimmune encephalomyelitis. J Immunol. 2002;168:2508–2515. doi: 10.4049/jimmunol.168.5.2508. [DOI] [PubMed] [Google Scholar]
- 69.Grekova MC, Salerno K, Mikkilineni R, Richert JR. Sp3 expression in immune cells: a quantitative study. Lab Invest. 2002;82:1131–1138. doi: 10.1097/01.lab.0000029149.38881.84. [DOI] [PubMed] [Google Scholar]
- 70.Grekova MC, Scherer SW, Trabb J, Richert JR. Localization of the human SP3 gene to chromosome 7p14-p15.2. The lack of expression in multiple sclerosis does not reflect abnormal gene organization. J Neuroimmunol. 2000;106:214–219. doi: 10.1016/s0165-5728(99)00264-7. [DOI] [PubMed] [Google Scholar]
- 71.Grekova MC, Robinson ED, Faerber MA, Katz P, McFarland HF, et al. Deficient expression in multiple sclerosis of the inhibitory transcription factor Sp3 in mononuclear blood cells. Ann Neurol. 1996;40:108–112. doi: 10.1002/ana.410400117. [DOI] [PubMed] [Google Scholar]
- 72.Montes M, Zhang X, Berthelot L, Laplaud DA, Brouard S, et al. Oligoclonal myelin-reactive T-cell infiltrates derived from multiple sclerosis lesions are enriched in Th17 cells. Clin Immunol. 2009;130:133–144. doi: 10.1016/j.clim.2008.08.030. [DOI] [PMC free article] [PubMed] [Google Scholar]
- 73.Avasarala JR, Chittur SV, George AD, Tine JA. Microarray analysis in B cells among siblings with/without MS - role for transcription factor TCF2. BMC Med Genomics. 2008;1:2. doi: 10.1186/1755-8794-1-2. [DOI] [PMC free article] [PubMed] [Google Scholar]
- 74.Gerhauser I, Alldinger S, Baumgartner W. Ets-1 represents a pivotal transcription factor for viral clearance, inflammation, and demyelination in a mouse model of multiple sclerosis. J Neuroimmunol. 2007;188:86–94. doi: 10.1016/j.jneuroim.2007.05.019. [DOI] [PubMed] [Google Scholar]
- 75.Venken K, Hellings N, Hensen K, Rummens JL, Medaer R, et al. Secondary progressive in contrast to relapsing-remitting multiple sclerosis patients show a normal CD4+CD25+ regulatory T-cell function and FOXP3 expression. J Neurosci Res. 2006;83:1432–1446. doi: 10.1002/jnr.20852. [DOI] [PubMed] [Google Scholar]
- 76.McKay FC, Swain LI, Schibeci SD, Rubio JP, Kilpatrick TJ, et al. CD127 immunophenotyping suggests altered CD4+ T cell regulation in primary progressive multiple sclerosis. J Autoimmun. 2008;31:52–58. doi: 10.1016/j.jaut.2008.02.003. [DOI] [PubMed] [Google Scholar]
- 77.Stenner MP, Waschbisch A, Buck D, Doerck S, Einsele H, et al. Effects of natalizumab treatment on Foxp3+ T regulatory cells. PLoS ONE. 2008;3:e3319. doi: 10.1371/journal.pone.0003319. [DOI] [PMC free article] [PubMed] [Google Scholar]
- 78.Awasthi A, Murugaiyan G, Kuchroo VK. Interplay between effector Th17 and regulatory T cells. J Clin Immunol. 2008;28:660–670. doi: 10.1007/s10875-008-9239-7. [DOI] [PubMed] [Google Scholar]
- 79.Aranami T, Yamamura T. Th17 Cells and autoimmune encephalomyelitis (EAE/MS). Allergol Int. 2008;57:115–120. doi: 10.2332/allergolint.R-07-159. [DOI] [PubMed] [Google Scholar]
- 80.Feger U, Luther C, Poeschel S, Melms A, Tolosa E, et al. Increased frequency of CD4+ CD25+ regulatory T cells in the cerebrospinal fluid but not in the blood of multiple sclerosis patients. Clin Exp Immunol. 2007;147:412–418. doi: 10.1111/j.1365-2249.2006.03271.x. [DOI] [PMC free article] [PubMed] [Google Scholar]
- 81.Kumar M, Putzki N, Limmroth V, Remus R, Lindemann M, et al. CD4+CD25+FoxP3+ T lymphocytes fail to suppress myelin basic protein-induced proliferation in patients with multiple sclerosis. J Neuroimmunol. 2006;180:178–184. doi: 10.1016/j.jneuroim.2006.08.003. [DOI] [PubMed] [Google Scholar]
- 82.Hong J, Zang YC, Nie H, Zhang JZ. CD4+ regulatory T cell responses induced by T cell vaccination in patients with multiple sclerosis. Proc Natl Acad Sci U S A. 2006;103:5024–5029. doi: 10.1073/pnas.0508784103. [DOI] [PMC free article] [PubMed] [Google Scholar]
- 83.Huan J, Culbertson N, Spencer L, Bartholomew R, Burrows GG, et al. Decreased FOXP3 levels in multiple sclerosis patients. J Neurosci Res. 2005;81:45–52. doi: 10.1002/jnr.20522. [DOI] [PubMed] [Google Scholar]
- 84.Hong J, Li N, Zhang X, Zheng B, Zhang JZ. Induction of CD4+CD25+ regulatory T cells by copolymer-I through activation of transcription factor Foxp3. Proc Natl Acad Sci U S A. 2005;102:6449–6454. doi: 10.1073/pnas.0502187102. [DOI] [PMC free article] [PubMed] [Google Scholar]
- 85.Frisullo G, Nociti V, Iorio R, Patanella AK, Caggiula M, et al. Regulatory T cells fail to suppress CD4T+-bet+ T cells in relapsing multiple sclerosis patients. Immunology. 2009;127:418–428. doi: 10.1111/j.1365-2567.2008.02963.x. [DOI] [PMC free article] [PubMed] [Google Scholar]
- 86.Rollins B, Martin MV, Morgan L, Vawter MP. Analysis of whole genome biomarker expression in blood and brain. Am J Med Genet B Neuropsychiatr Genet. 2010;153B:919–936. doi: 10.1002/ajmg.b.31062. [DOI] [PMC free article] [PubMed] [Google Scholar]
- 87.Edgar R, Domrachev M, Lash AE. Gene Expression Omnibus: NCBI gene expression and hybridization array data repository. Nucleic Acids Res. 2002;30:207–210. doi: 10.1093/nar/30.1.207. [DOI] [PMC free article] [PubMed] [Google Scholar]
- 88.Fayyad UM, Irani KB. Multi-Interval Discretization of Continuous-Valued Attributes for Classification Learning. INTERNATIONAL JOINT CONFERENCE ON ARTIFICIAL INTELLIGENCE 1993 [Google Scholar]
- 89.Berretta R, Costa W, Moscato P. Combinatorial optimization models for finding genetic signatures from gene expression datasets. Methods Mol Biol. 2008;453:363–377. doi: 10.1007/978-1-60327-429-6_19. [DOI] [PubMed] [Google Scholar]
- 90.Rosso OA, Mendes A, Berretta R, Rostas JA, Hunter M, et al. Distinguishing childhood absence epilepsy patients from controls by the analysis of their background brain electrical activity (II): a combinatorial optimization approach for electrode selection. J Neurosci Methods. 2009;181:257–267. doi: 10.1016/j.jneumeth.2009.04.028. [DOI] [PubMed] [Google Scholar]
- 91.Gomez Ravetti M, Moscato P. Identification of a 5-protein biomarker molecular signature for predicting Alzheimer's disease. PLoS ONE. 2008;3:e3111. doi: 10.1371/journal.pone.0003111. [DOI] [PMC free article] [PubMed] [Google Scholar]
- 92.Hourani M, Berretta R, Mendes A, Moscato P. Genetic signatures for a rodent model of Parkinson's disease using combinatorial optimization methods. Methods Mol Biol. 2008;453:379–392. doi: 10.1007/978-1-60327-429-6_20. [DOI] [PubMed] [Google Scholar]
- 93.Mendes A, Scott RJ, Moscato P. Microarrays–identifying molecular portraits for prostate tumors with different Gleason patterns. Methods Mol Med. 2008;141:131–151. doi: 10.1007/978-1-60327-148-6_8. [DOI] [PubMed] [Google Scholar]
- 94.Johnstone D, Riveros C, Moscato P, Milward L. Effects of different normalisation and analysis procedures on illumina gene expression microarray data. Proceedings of the 19th International Conference on Genome Informatics (GIW 2008) 2008 [Google Scholar]
- 95.Chang JT, Nevins JR. GATHER: a systems approach to interpreting genomic signatures. Bioinformatics. 2006;22:2926–2933. doi: 10.1093/bioinformatics/btl483. [DOI] [PubMed] [Google Scholar]
- 96.Ban EM, LeBoeuf RD. Suppressin: an endogenous negative regulator of immune cell activation. Immunol Res. 1994;13:1–9. doi: 10.1007/BF02918219. [DOI] [PubMed] [Google Scholar]
- 97.Gardner JM, Anderson MS. The sickness unto Deaf. Nat Immunol. 2009;10:934–936. doi: 10.1038/ni0909-934. [DOI] [PMC free article] [PubMed] [Google Scholar]
- 98.Yip L, Su L, Sheng D, Chang P, Atkinson M, et al. Deaf1 isoforms control the expression of genes encoding peripheral tissue antigens in the pancreatic lymph nodes during type 1 diabetes. Nat Immunol. 2009;10:1026–1033. doi: 10.1038/ni.1773. [DOI] [PMC free article] [PubMed] [Google Scholar]
- 99.Benjamins JA, Nedelkoska L, George EB. Protection of mature oligodendrocytes by inhibitors of caspases and calpains. Neurochem Res. 2003;28:143–152. doi: 10.1023/a:1021612615554. [DOI] [PubMed] [Google Scholar]
- 100.Della Chiesa M, Romeo E, Falco M, Balsamo M, Augugliaro R, et al. Evidence that the KIR2DS5 gene codes for a surface receptor triggering natural killer cell function. Eur J Immunol. 2008;38:2284–2289. doi: 10.1002/eji.200838434. [DOI] [PubMed] [Google Scholar]
- 101.Schellekens J, Rozemuller EH, Petersen EJ, van den Tweel JG, Verdonck LF, et al. Activating KIRs exert a crucial role on relapse and overall survival after HLA-identical sibling transplantation. Mol Immunol. 2008;45:2255–2261. doi: 10.1016/j.molimm.2007.11.014. [DOI] [PubMed] [Google Scholar]
- 102.Lorentzen AR, Karlsen TH, Olsson M, Smestad C, Mero IL, et al. Killer immunoglobulin-like receptor ligand HLA-Bw4 protects against multiple sclerosis. Ann Neurol. 2009;65:658–666. doi: 10.1002/ana.21695. [DOI] [PubMed] [Google Scholar]
- 103.Caserta S, Zamoyska R. Memories are made of this: synergy of T cell receptor and cytokine signals in CD4(+) central memory cell survival. Trends Immunol. 2007;28:245–248. doi: 10.1016/j.it.2007.04.006. [DOI] [PubMed] [Google Scholar]
- 104.Dabrowska A, Kim N, Aldovini A. Tat-induced FOXO3a is a key mediator of apoptosis in HIV-1-infected human CD4+ T lymphocytes. J Immunol. 2008;181:8460–8477. doi: 10.4049/jimmunol.181.12.8460. [DOI] [PMC free article] [PubMed] [Google Scholar]
- 105.van Grevenynghe J, Procopio FA, He Z, Chomont N, Riou C, et al. Transcription factor FOXO3a controls the persistence of memory CD4(+) T cells during HIV infection. Nat Med. 2008;14:266–274. doi: 10.1038/nm1728. [DOI] [PubMed] [Google Scholar]
- 106.Riou C, Yassine-Diab B, Van grevenynghe J, Somogyi R, Greller LD, et al. Convergence of TCR and cytokine signaling leads to FOXO3a phosphorylation and drives the survival of CD4+ central memory T cells. J Exp Med. 2007;204:79–91. doi: 10.1084/jem.20061681. [DOI] [PMC free article] [PubMed] [Google Scholar]
- 107.Lin L, Hron JD, Peng SL. Regulation of NF-kappaB, Th activation, and autoinflammation by the forkhead transcription factor Foxo3a. Immunity. 2004;21:203–213. doi: 10.1016/j.immuni.2004.06.016. [DOI] [PubMed] [Google Scholar]
- 108.Su H, Bidere N, Lenardo M. Another fork in the road: Foxo3a regulates NF-kappaB activation. Immunity. 2004;21:133–134. doi: 10.1016/j.immuni.2004.07.015. [DOI] [PubMed] [Google Scholar]
- 109.Pollard KS, Salama SR, Lambert N, Lambot MA, Coppens S, et al. An RNA gene expressed during cortical development evolved rapidly in humans. Nature. 2006;443:167–172. doi: 10.1038/nature05113. [DOI] [PubMed] [Google Scholar]
- 110.Panteri R, Mey J, Zhelyaznik N, D'Altocolle A, Del Fa A, et al. Reelin is transiently expressed in the peripheral nerve during development and is upregulated following nerve crush. Mol Cell Neurosci. 2006;32:133–142. doi: 10.1016/j.mcn.2006.03.004. [DOI] [PubMed] [Google Scholar]
- 111.Pollard KS, Salama SR, King B, Kern AD, Dreszer T, et al. Forces shaping the fastest evolving regions in the human genome. PLoS Genet. 2006;2:e168. doi: 10.1371/journal.pgen.0020168. [DOI] [PMC free article] [PubMed] [Google Scholar]
- 112.Pollard KS. What makes us human? Sci Am. 2009;300:44–49. doi: 10.1038/scientificamerican0509-44. [DOI] [PubMed] [Google Scholar]
- 113.Nakamura Y, Takahashi N, Kakegawa E, Yoshida K, Ito Y, et al. The GAS5 (growth arrest-specific transcript 5) gene fuses to BCL6 as a result of t(1;3)(q25;q27) in a patient with B-cell lymphoma. Cancer Genet Cytogenet. 2008;182:144–149. doi: 10.1016/j.cancergencyto.2008.01.013. [DOI] [PubMed] [Google Scholar]
- 114.Tanaka R, Satoh H, Moriyama M, Satoh K, Morishita Y, et al. Intronic U50 small-nucleolar-RNA (snoRNA) host gene of no protein-coding potential is mapped at the chromosome breakpoint t(3;6)(q27;q15) of human B-cell lymphoma. Genes Cells. 2000;5:277–287. doi: 10.1046/j.1365-2443.2000.00325.x. [DOI] [PubMed] [Google Scholar]
- 115.Hirst CL, Pace A, Pickersgill TP, Jones R, McLean BN, et al. Campath 1-H treatment in patients with aggressive relapsing remitting multiple sclerosis. J Neurol. 2008;255:231–238. doi: 10.1007/s00415-008-0696-y. [DOI] [PubMed] [Google Scholar]
- 116.Jones JL, Coles AJ. Campath-1H treatment of multiple sclerosis. Neurodegener Dis. 2008;5:27–31. doi: 10.1159/000109935. [DOI] [PubMed] [Google Scholar]
- 117.Muraro PA, Bielekova B. Emerging therapies for multiple sclerosis. Neurotherapeutics. 2007;4:676–692. doi: 10.1016/j.nurt.2007.07.003. [DOI] [PMC free article] [PubMed] [Google Scholar]
- 118.Simpson BS, Coles AJ. Rationale for cytotoxic monoclonal antibodies in MS. Int MS J. 2007;14:48–56. [PubMed] [Google Scholar]
- 119.Coles AJ, Wing M, Smith S, Coraddu F, Greer S, et al. Pulsed monoclonal antibody treatment and autoimmune thyroid disease in multiple sclerosis. Lancet. 1999;354:1691–1695. doi: 10.1016/S0140-6736(99)02429-0. [DOI] [PubMed] [Google Scholar]
- 120.Coles AJ, Wing MG, Molyneux P, Paolillo A, Davie CM, et al. Monoclonal antibody treatment exposes three mechanisms underlying the clinical course of multiple sclerosis. Ann Neurol. 1999;46:296–304. doi: 10.1002/1531-8249(199909)46:3<296::aid-ana4>3.0.co;2-#. [DOI] [PubMed] [Google Scholar]
- 121.Coles AJ, Wing MG, Compston DA. Disease activity and the immune set in multiple sclerosis: blood markers for immunotherapy. Mult Scler. 1998;4:232–238. doi: 10.1177/135245859800400327. [DOI] [PubMed] [Google Scholar]
- 122.Moreau T, Coles A, Wing M, Thorpe J, Miller D, et al. CAMPATH-IH in multiple sclerosis. Mult Scler. 1996;1:357–365. doi: 10.1177/135245859600100616. [DOI] [PubMed] [Google Scholar]
- 123.Moreau T, Thorpe J, Miller D, Moseley I, Hale G, et al. Preliminary evidence from magnetic resonance imaging for reduction in disease activity after lymphocyte depletion in multiple sclerosis. Lancet. 1994;344:298–301. doi: 10.1016/s0140-6736(94)91339-0. [DOI] [PubMed] [Google Scholar]
- 124.Coles AJ, Compston DA, Selmaj KW, Lake SL, Moran S, et al. Alemtuzumab vs. interferon beta-1a in early multiple sclerosis. N Engl J Med. 2008;359:1786–1801. doi: 10.1056/NEJMoa0802670. [DOI] [PubMed] [Google Scholar]
- 125.Rosenberg HF. RNase A ribonucleases and host defense: an evolving story. J Leukoc Biol. 2008;83:1079–1087. doi: 10.1189/jlb.1107725. [DOI] [PMC free article] [PubMed] [Google Scholar]
- 126.Rosenberg HF. Eosinophil-derived neurotoxin/RNase 2: connecting the past, the present and the future. Curr Pharm Biotechnol. 2008;9:135–140. doi: 10.2174/138920108784567236. [DOI] [PMC free article] [PubMed] [Google Scholar]
- 127.Durack DT, Ackerman SJ, Loegering DA, Gleich GJ. Purification of human eosinophil-derived neurotoxin. Proc Natl Acad Sci U S A. 1981;78:5165–5169. doi: 10.1073/pnas.78.8.5165. [DOI] [PMC free article] [PubMed] [Google Scholar]
- 128.Patwardhan S, Gashler A, Siegel MG, Chang LC, Joseph LJ, et al. EGR3, a novel member of the Egr family of genes encoding immediate-early transcription factors. Oncogene. 1991;6:917–928. [PubMed] [Google Scholar]
- 129.Crosby SD, Veile RA, Donis-Keller H, Baraban JM, Bhat RV, et al. Neural-specific expression, genomic structure, and chromosomal localization of the gene encoding the zinc-finger transcription factor NGFI-C. Proc Natl Acad Sci U S A. 1992;89:4739–4743. doi: 10.1073/pnas.89.10.4739. [DOI] [PMC free article] [PubMed] [Google Scholar]
- 130.Xi H, Kersh GJ. Early growth response gene 3 regulates thymocyte proliferation during the transition from CD4-CD8- to CD4+CD8+. J Immunol. 2004;172:964–971. doi: 10.4049/jimmunol.172.2.964. [DOI] [PubMed] [Google Scholar]
- 131.Safford M, Collins S, Lutz MA, Allen A, Huang CT, et al. Egr-2 and Egr-3 are negative regulators of T cell activation. Nat Immunol. 2005;6:472–480. doi: 10.1038/ni1193. [DOI] [PubMed] [Google Scholar]
- 132.Collins S, Lutz MA, Zarek PE, Anders RA, Kersh GJ, et al. Opposing regulation of T cell function by Egr-1/NAB2 and Egr-2/Egr-3. Eur J Immunol. 2008;38:528–536. doi: 10.1002/eji.200737157. [DOI] [PMC free article] [PubMed] [Google Scholar]
- 133.Zheng Y, Zha Y, Gajewski TF. Molecular regulation of T-cell anergy. EMBO Rep. 2008;9:50–55. doi: 10.1038/sj.embor.7401138. [DOI] [PMC free article] [PubMed] [Google Scholar]
- 134.Fukuyama T, Kasper LH, Boussouar F, Jeevan T, van Deursen J, et al. Histone acetyltransferase CBP is vital to demarcate conventional and innate CD8+ T-cell development. Mol Cell Biol. 2009;29:3894–3904. doi: 10.1128/MCB.01598-08. [DOI] [PMC free article] [PubMed] [Google Scholar]
- 135.Jones EA, Jang SW, Mager GM, Chang LW, Srinivasan R, et al. Interactions of Sox10 and Egr2 in myelin gene regulation. Neuron Glia Biol. 2007;3:377–387. doi: 10.1017/S1740925X08000173. [DOI] [PMC free article] [PubMed] [Google Scholar]
- 136.Jessen KR, Mirsky R. Negative regulation of myelination: relevance for development, injury, and demyelinating disease. Glia. 2008;56:1552–1565. doi: 10.1002/glia.20761. [DOI] [PubMed] [Google Scholar]
- 137.Ramagopalan SV, Maugeri NJ, Handunnetthi L, Lincoln MR, Orton SM, et al. Expression of the multiple sclerosis-associated MHC class II Allele HLA-DRB1*1501 is regulated by vitamin D. PLoS Genet. 2009;5:e1000369. doi: 10.1371/journal.pgen.1000369. [DOI] [PMC free article] [PubMed] [Google Scholar]
- 138.Kida E, Palminiello S, Golabek AA, Walus M, Wierzba-Bobrowicz T, et al. Carbonic anhydrase II in the developing and adult human brain. J Neuropathol Exp Neurol. 2006;65:664–674. doi: 10.1097/01.jnen.0000225905.52002.3e. [DOI] [PubMed] [Google Scholar]
- 139.Cammer W. Glial-cell cultures from brains of carbonic anhydrase II-deficient mutant mice: delay in oligodendrocyte maturation. Neurochem Res. 1998;23:407–412. doi: 10.1023/a:1022421920265. [DOI] [PubMed] [Google Scholar]
- 140.Cammer W, Zhang H, Tansey FA. Effects of carbonic anhydrase II (CAII) deficiency on CNS structure and function in the myelin-deficient CAII-deficient double mutant mouse. J Neurosci Res. 1995;40:451–457. doi: 10.1002/jnr.490400404. [DOI] [PubMed] [Google Scholar]
- 141.Sigurdsson S, Goring HH, Kristjansdottir G, Milani L, Nordmark G, et al. Comprehensive evaluation of the genetic variants of interferon regulatory factor 5 (IRF5) reveals a novel 5 bp length polymorphism as strong risk factor for systemic lupus erythematosus. Hum Mol Genet. 2008;17:872–881. doi: 10.1093/hmg/ddm359. [DOI] [PubMed] [Google Scholar]
- 142.Awano T, Johnson GS, Wade CM, Katz ML, Johnson GC, et al. Genome-wide association analysis reveals a SOD1 mutation in canine degenerative myelopathy that resembles amyotrophic lateral sclerosis. Proc Natl Acad Sci U S A. 2009;106:2794–2799. doi: 10.1073/pnas.0812297106. [DOI] [PMC free article] [PubMed] [Google Scholar]
- 143.Gerstner B, DeSilva TM, Genz K, Armstrong A, Brehmer F, et al. Hyperoxia causes maturation-dependent cell death in the developing white matter. J Neurosci. 2008;28:1236–1245. doi: 10.1523/JNEUROSCI.3213-07.2008. [DOI] [PMC free article] [PubMed] [Google Scholar]
- 144.Avossa D, Grandolfo M, Mazzarol F, Zatta M, Ballerini L. Early signs of motoneuron vulnerability in a disease model system: Characterization of transverse slice cultures of spinal cord isolated from embryonic ALS mice. Neuroscience. 2006;138:1179–1194. doi: 10.1016/j.neuroscience.2005.12.009. [DOI] [PubMed] [Google Scholar]
- 145.Sasaki S, Warita H, Abe K, Iwata M. Slow component of axonal transport is impaired in the proximal axon of transgenic mice with a G93A mutant SOD1 gene. Acta Neuropathol. 2004;107:452–460. doi: 10.1007/s00401-004-0838-y. [DOI] [PubMed] [Google Scholar]
- 146.Tajouri L, Mellick AS, Ashton KJ, Tannenberg AE, Nagra RM, et al. Quantitative and qualitative changes in gene expression patterns characterize the activity of plaques in multiple sclerosis. Brain Res Mol Brain Res. 2003;119:170–183. doi: 10.1016/j.molbrainres.2003.09.008. [DOI] [PubMed] [Google Scholar]
- 147.Ince PG, Tomkins J, Slade JY, Thatcher NM, Shaw PJ. Amyotrophic lateral sclerosis associated with genetic abnormalities in the gene encoding Cu/Zn superoxide dismutase: molecular pathology of five new cases, and comparison with previous reports and 73 sporadic cases of ALS. J Neuropathol Exp Neurol. 1998;57:895–904. doi: 10.1097/00005072-199810000-00002. [DOI] [PubMed] [Google Scholar]
- 148.Azzouz M, Leclerc N, Gurney M, Warter JM, Poindron P, et al. Progressive motor neuron impairment in an animal model of familial amyotrophic lateral sclerosis. Muscle Nerve. 1997;20:45–51. doi: 10.1002/(sici)1097-4598(199701)20:1<45::aid-mus6>3.0.co;2-h. [DOI] [PubMed] [Google Scholar]
- 149.Guy J. Optic nerve degeneration in experimental autoimmune encephalomyelitis. Ophthalmic Res. 2008;40:212–216. doi: 10.1159/000119879. [DOI] [PubMed] [Google Scholar]
- 150.Roth TM, Ramamurthy P, Ebisu F, Lisak RP, Bealmear BM, et al. A mouse embryonic stem cell model of Schwann cell differentiation for studies of the role of neurofibromatosis type 1 in Schwann cell development and tumor formation. Glia. 2007;55:1123–1133. doi: 10.1002/glia.20534. [DOI] [PubMed] [Google Scholar]
- 151.Rosenbaum T, Kim HA, Boissy YL, Ling B, Ratner N. Neurofibromin, the neurofibromatosis type 1 Ras-GAP, is required for appropriate P0 expression and myelination. Ann N Y Acad Sci. 1999;883:203–214. [PubMed] [Google Scholar]
- 152.Gutmann DH, Tennekoon GI, Cole JL, Collins FS, Rutkowski JL. Modulation of the neurofibromatosis type 1 gene product, neurofibromin, during Schwann cell differentiation. J Neurosci Res. 1993;36:216–223. doi: 10.1002/jnr.490360212. [DOI] [PubMed] [Google Scholar]
- 153.Habib AA, Marton LS, Allwardt B, Gulcher JR, Mikol DD, et al. Expression of the oligodendrocyte-myelin glycoprotein by neurons in the mouse central nervous system. J Neurochem. 1998;70:1704–1711. doi: 10.1046/j.1471-4159.1998.70041704.x. [DOI] [PubMed] [Google Scholar]
- 154.Kim HA, Ling B, Ratner N. Nf1-deficient mouse Schwann cells are angiogenic and invasive and can be induced to hyperproliferate: reversion of some phenotypes by an inhibitor of farnesyl protein transferase. Mol Cell Biol. 1997;17:862–872. doi: 10.1128/mcb.17.2.862. [DOI] [PMC free article] [PubMed] [Google Scholar]
- 155.Perini P, Gallo P. The range of multiple sclerosis associated with neurofibromatosis type 1. J Neurol Neurosurg Psychiatry. 2001;71:679–681. doi: 10.1136/jnnp.71.5.679. [DOI] [PMC free article] [PubMed] [Google Scholar]
- 156.Ferner RE, Hughes RA, Johnson MR. Neurofibromatosis 1 and multiple sclerosis. J Neurol Neurosurg Psychiatry. 1995;58:582–585. doi: 10.1136/jnnp.58.5.582. [DOI] [PMC free article] [PubMed] [Google Scholar]
- 157.Habib AA, Gulcher JR, Hognason T, Zheng L, Stefansson K. The OMgp gene, a second growth suppressor within the NF1 gene. Oncogene. 1998;16:1525–1531. doi: 10.1038/sj.onc.1201683. [DOI] [PubMed] [Google Scholar]
- 158.Wang M, Windgassen D, Papoutsakis ET. Comparative analysis of transcriptional profiling of CD3+, CD4+ and CD8+ T cells identifies novel immune response players in T-cell activation. BMC Genomics. 2008;9:225. doi: 10.1186/1471-2164-9-225. [DOI] [PMC free article] [PubMed] [Google Scholar]
- 159.Fischer A, de Saint Basile G, Le Deist F. CD3 deficiencies. Curr Opin Allergy Clin Immunol. 2005;5:491–495. doi: 10.1097/01.all.0000191886.12645.79. [DOI] [PubMed] [Google Scholar]
- 160.de Saint Basile G, Geissmann F, Flori E, Uring-Lambert B, Soudais C, et al. Severe combined immunodeficiency caused by deficiency in either the delta or the epsilon subunit of CD3. J Clin Invest. 2004;114:1512–1517. doi: 10.1172/JCI22588. [DOI] [PMC free article] [PubMed] [Google Scholar]
- 162.Plumb J, McQuaid S, Cross AK, Surr J, Haddock G, et al. Upregulation of ADAM-17 expression in active lesions in multiple sclerosis. Mult Scler. 2006;12:375–385. doi: 10.1191/135248506ms1276oa. [DOI] [PubMed] [Google Scholar]
- 163.Reimand J, Kull M, Peterson H, Hansen J, Vilo J. g:Profiler–a web-based toolset for functional profiling of gene lists from large-scale experiments. Nucleic Acids Res. 2007;35:W193–200. doi: 10.1093/nar/gkm226. [DOI] [PMC free article] [PubMed] [Google Scholar]
- 164.Steinman L. Multiple sclerosis: a two-stage disease. Nat Immunol. 2001;2:762–764. doi: 10.1038/ni0901-762. [DOI] [PubMed] [Google Scholar]
- 165.Wucherpfennig KW, Catz I, Hausmann S, Strominger JL, Steinman L, et al. Recognition of the immunodominant myelin basic protein peptide by autoantibodies and HLA-DR2-restricted T cell clones from multiple sclerosis patients. Identity of key contact residues in the B-cell and T-cell epitopes. J Clin Invest. 1997;100:1114–1122. doi: 10.1172/JCI119622. [DOI] [PMC free article] [PubMed] [Google Scholar]
- 166.Olson JK, Croxford JL, Calenoff MA, Dal Canto MC, Miller SD. A virus-induced molecular mimicry model of multiple sclerosis. The Journal of Clinical Investigation. 2001;108:311–318. doi: 10.1172/JCI13032. [DOI] [PMC free article] [PubMed] [Google Scholar]
- 167.Sibley WA, Bamford CR, Clark K. CLINICAL VIRAL-INFECTIONS AND MULTIPLE-SCLEROSIS. Lancet. 1985;1:1313–1315. doi: 10.1016/S0140-6736(85)92801-6. [DOI] [PMC free article] [PubMed] [Google Scholar]
- 168.Andersen O, Lygner PE, Bergstrom T, Andersson M, Vahlne A. VIRAL-INFECTIONS TRIGGER MULTIPLE-SCLEROSIS RELAPSES - A PROSPECTIVE SEROEPIDEMIOLOGICAL STUDY. Journal of Neurology. 1993;240:417–422. doi: 10.1007/BF00867354. [DOI] [PubMed] [Google Scholar]
- 169.Panitch HillelS. Influence of infection on exacerbations of multiple sclerosis. Annals of Neurology. 1994;36:S25–S28. doi: 10.1002/ana.410360709. [DOI] [PMC free article] [PubMed] [Google Scholar]
- 170.Edwards S, Zvartau M, Clarke H, Irving W, Blumhardt LD. Clinical relapses and disease activity on magnetic resonance imaging associated with viral upper respiratory tract infections in multiple sclerosis. J Neurol Neurosurg Psychiatry. 1998;64:736–741. doi: 10.1136/jnnp.64.6.736. [DOI] [PMC free article] [PubMed] [Google Scholar]
- 171.Buljevac D, Flach HZ, Hop WCJ, Hijdra D, Laman JD, et al. Prospective study on the relationship between infections and multiple sclerosis exacerbations. Brain. 2002;125:952–960. doi: 10.1093/brain/awf098. [DOI] [PubMed] [Google Scholar]
- 172.Inostroza-Ponta M, Berretta R, Mendes A, Moscato P. An automatic graph layout procedure to visualize correlated data. In: IFIP International Federation for Information Processing, Volume 217, Artificial Intelligence in Theory and Practice. In: Bramer M, editor. Boston: Boston; 2006. pp. 179–188. [Google Scholar]
- 173.Inostroza-Ponta M, Mendes A, Berretta R, Moscato P. An Integrated QAP-Based Approach to Visualize Patterns of Gene Expression Similarity. LECTURE NOTES IN COMPUTER SCIENCE 2007 [Google Scholar]
- 174.Shimada M, Komatsu K. Emerging connection between centrosome and DNA repair machinery. J Radiat Res (Tokyo) 2009;50:295–301. doi: 10.1269/jrr.09039. [DOI] [PubMed] [Google Scholar]
- 175.Bond J, Roberts E, Mochida GH, Hampshire DJ, Scott S, et al. ASPM is a major determinant of cerebral cortical size. Nat Genet. 2002;32:316–320. doi: 10.1038/ng995. [DOI] [PubMed] [Google Scholar]
- 176.Ali F, Meier R. Positive selection in ASPM is correlated with cerebral cortex evolution across primates but not with whole-brain size. Mol Biol Evol. 2008;25:2247–2250. doi: 10.1093/molbev/msn184. [DOI] [PubMed] [Google Scholar]
- 177.Fish JL, Dehay C, Kennedy H, Huttner WB. Making bigger brains-the evolution of neural-progenitor-cell division. J Cell Sci. 2008;121:2783–2793. doi: 10.1242/jcs.023465. [DOI] [PubMed] [Google Scholar]
- 178.Dobson-Stone C, Gatt JM, Kuan SA, Grieve SM, Gordon E, et al. Investigation of MCPH1 G37995C and ASPM A44871G polymorphisms and brain size in a healthy cohort. Neuroimage. 2007;37:394–400. doi: 10.1016/j.neuroimage.2007.05.011. [DOI] [PubMed] [Google Scholar]
- 179.Timpson N, Heron J, Smith GD, Enard W. Comment on papers by Evans et al. and Mekel-Bobrov et al. on Evidence for Positive Selection of MCPH1 and ASPM. Science. 2007;317:1036; author reply 1036. doi: 10.1126/science.1141705. [DOI] [PubMed] [Google Scholar]
- 180.Dediu D. The role of genetic biases in shaping the correlations between languages and genes. J Theor Biol. 2008;254:400–407. doi: 10.1016/j.jtbi.2008.05.028. [DOI] [PubMed] [Google Scholar]
- 181.Dediu D, Ladd DR. Linguistic tone is related to the population frequency of the adaptive haplogroups of two brain size genes, ASPM and Microcephalin. Proc Natl Acad Sci U S A. 2007;104:10944–10949. doi: 10.1073/pnas.0610848104. [DOI] [PMC free article] [PubMed] [Google Scholar]
- 182.Frost P. The spread of alphabetical writing may have favored the latest variant of the ASPM gene. Med Hypotheses. 2008;70:17–20. doi: 10.1016/j.mehy.2007.04.039. [DOI] [PubMed] [Google Scholar]
- 183.Muhammad F, Mahmood Baig S, Hansen L, Sajid Hussain M, Anjum Inayat I, et al. Compound heterozygous ASPM mutations in Pakistani MCPH families. Am J Med Genet A. 2009;149A:926–930. doi: 10.1002/ajmg.a.32749. [DOI] [PubMed] [Google Scholar]
- 184.Bishop DV. Genes, cognition, and communication: insights from neurodevelopmental disorders. Ann N Y Acad Sci. 2009;1156:1–18. doi: 10.1111/j.1749-6632.2009.04419.x. [DOI] [PMC free article] [PubMed] [Google Scholar]
- 185.Saadi A, Borck G, Boddaert N, Chekkour MC, Imessaoudene B, et al. Compound heterozygous ASPM mutations associated with microcephaly and simplified cortical gyration in a consanguineous Algerian family. Eur J Med Genet. 2009;52:180–184. doi: 10.1016/j.ejmg.2009.03.013. [DOI] [PubMed] [Google Scholar]
- 186.Kumar A, Girimaji SC, Duvvari MR, Blanton SH. Mutations in STIL, encoding a pericentriolar and centrosomal protein, cause primary microcephaly. Am J Hum Genet. 2009;84:286–290. doi: 10.1016/j.ajhg.2009.01.017. [DOI] [PMC free article] [PubMed] [Google Scholar]
- 187.Nicholas AK, Swanson EA, Cox JJ, Karbani G, Malik S, et al. The molecular landscape of ASPM mutations in primary microcephaly. J Med Genet. 2009;46:249–253. doi: 10.1136/jmg.2008.062380. [DOI] [PMC free article] [PubMed] [Google Scholar]
- 188.Desir J, Cassart M, David P, Van Bogaert P, Abramowicz M. Primary microcephaly with ASPM mutation shows simplified cortical gyration with antero-posterior gradient pre- and post-natally. Am J Med Genet A. 2008;146A:1439–1443. doi: 10.1002/ajmg.a.32312. [DOI] [PubMed] [Google Scholar]
- 189.Morgenthaler NG, Seissler J, Achenbach P, Glawe D, Payton M, et al. Antibodies to the tyrosine phosphatase-like protein IA-2 are highly associated with IDDM, but not with autoimmune endocrine diseases or stiff man syndrome. Autoimmunity. 1997;25:203–211. doi: 10.3109/08916939708994729. [DOI] [PubMed] [Google Scholar]
- 190.Schmidli RS, Colman PG, Cui L, Yu WP, Kewming K, et al. Antibodies to the protein tyrosine phosphatases IAR and IA-2 are associated with progression to insulin-dependent diabetes (IDDM) in first-degree relatives at-risk for IDDM. Autoimmunity. 1998;28:15–23. doi: 10.3109/08916939808993841. [DOI] [PubMed] [Google Scholar]
- 191.Miao D, Yu L, Eisenbarth GS. Role of autoantibodies in type 1 diabetes. Front Biosci. 2007;12:1889–1898. doi: 10.2741/2195. [DOI] [PubMed] [Google Scholar]
- 192.Williams AJ, Aitken RJ, Chandler MA, Gillespie KM, Lampasona V, et al. Autoantibodies to islet antigen-2 are associated with HLA-DRB1*07 and DRB1*09 haplotypes as well as DRB1*04 at onset of type 1 diabetes: the possible role of HLA-DQA in autoimmunity to IA-2. Diabetologia. 2008;51:1444–1448. doi: 10.1007/s00125-008-1047-3. [DOI] [PubMed] [Google Scholar]
- 193.Lan MS, Wasserfall C, Maclaren NK, Notkins AL. IA-2, a transmembrane protein of the protein tyrosine phosphatase family, is a major autoantigen in insulin-dependent diabetes mellitus. Proc Natl Acad Sci U S A. 1996;93:6367–6370. doi: 10.1073/pnas.93.13.6367. [DOI] [PMC free article] [PubMed] [Google Scholar]
- 194.Lu J, Li Q, Xie H, Chen ZJ, Borovitskaya AE, et al. Identification of a second transmembrane protein tyrosine phosphatase, IA-2beta, as an autoantigen in insulin-dependent diabetes mellitus: precursor of the 37-kDa tryptic fragment. Proc Natl Acad Sci U S A. 1996;93:2307–2311. doi: 10.1073/pnas.93.6.2307. [DOI] [PMC free article] [PubMed] [Google Scholar]
- 195.Kim SM, Theilig F, Qin Y, Cai T, Mizel D, et al. Dense-core vesicle proteins IA-2 and IA-2{beta} affect renin synthesis and secretion through the {beta}-adrenergic pathway. Am J Physiol Renal Physiol. 2009;296:F382–389. doi: 10.1152/ajprenal.90543.2008. [DOI] [PMC free article] [PubMed] [Google Scholar]
- 196.Shimizu S, Saito N, Kubosaki A, SungWook S, Takeyama N, et al. Developmental expression and localization of IA-2 mRNA in mouse neuroendocrine tissues. Biochem Biophys Res Commun. 2001;288:165–171. doi: 10.1006/bbrc.2001.5754. [DOI] [PubMed] [Google Scholar]
- 197.Saeki K, Zhu M, Kubosaki A, Xie J, Lan MS, et al. Targeted disruption of the protein tyrosine phosphatase-like molecule IA-2 results in alterations in glucose tolerance tests and insulin secretion. Diabetes. 2002;51:1842–1850. doi: 10.2337/diabetes.51.6.1842. [DOI] [PubMed] [Google Scholar]
- 198.Roifman CM. CD3 delta immunodeficiency. Curr Opin Allergy Clin Immunol. 2004;4:479–484. doi: 10.1097/00130832-200412000-00002. [DOI] [PubMed] [Google Scholar]
- 199.Grunebaum E, Sharfe N, Roifman CM. Human T cell immunodeficiency: when signal transduction goes wrong. Immunol Res. 2006;35:117–126. doi: 10.1385/ir:35:1:117. [DOI] [PubMed] [Google Scholar]
- 200.Akl H, Badran B, Dobirta G, Manfouo-Foutsop G, Moschitta M, et al. Progressive loss of CD3 expression after HTLV-I infection results from chromatin remodeling affecting all the CD3 genes and persists despite early viral genes silencing. Virol J. 2007;4:85. doi: 10.1186/1743-422X-4-85. [DOI] [PMC free article] [PubMed] [Google Scholar]
- 201.Fernandez-Malave E, Wang N, Pulgar M, Schamel WW, Alarcon B, et al. Overlapping functions of human CD3delta and mouse CD3gamma in alphabeta T-cell development revealed in a humanized CD3gamma-mouse. Blood. 2006;108:3420–3427. doi: 10.1182/blood-2006-03-010850. [DOI] [PubMed] [Google Scholar]
- 202.Takada H, Nomura A, Roifman CM, Hara T. Severe combined immunodeficiency caused by a splicing abnormality of the CD3delta gene. Eur J Pediatr. 2005;164:311–314. doi: 10.1007/s00431-005-1639-6. [DOI] [PubMed] [Google Scholar]
- 203.Roifman CM. Studies of patients' thymi aid in the discovery and characterization of immunodeficiency in humans. Immunol Rev. 2005;203:143–155. doi: 10.1111/j.0105-2896.2005.00236.x. [DOI] [PubMed] [Google Scholar]
- 204.Pan Q, Gollapudi AS, Dave VP. Biochemical evidence for the presence of a single CD3delta and CD3gamma chain in the surface T cell receptor/CD3 complex. J Biol Chem. 2004;279:51068–51074. doi: 10.1074/jbc.M406145200. [DOI] [PubMed] [Google Scholar]
- 205.Oh SJ, Cho SB, Park SH, Piao CZ, Kwon SM, et al. Cell cycle and immune-related processes are significantly altered in chronic GVHD. Bone Marrow Transplant. 2008;41:1047–1057. doi: 10.1038/bmt.2008.37. [DOI] [PubMed] [Google Scholar]
- 206.Hjelmervik TO, Petersen K, Jonassen I, Jonsson R, Bolstad AI. Gene expression profiling of minor salivary glands clearly distinguishes primary Sjogren's syndrome patients from healthy control subjects. Arthritis Rheum. 2005;52:1534–1544. doi: 10.1002/art.21006. [DOI] [PubMed] [Google Scholar]
- 207.Doucey MA, Goffin L, Naeher D, Michielin O, Baumgartner P, et al. CD3 delta establishes a functional link between the T cell receptor and CD8. J Biol Chem. 2003;278:3257–3264. doi: 10.1074/jbc.M208119200. [DOI] [PubMed] [Google Scholar]
- 208.Hayes SM, Shores EW, Love PE. An architectural perspective on signaling by the pre-, alphabeta and gammadelta T cell receptors. Immunol Rev. 2003;191:28–37. doi: 10.1034/j.1600-065x.2003.00011.x. [DOI] [PubMed] [Google Scholar]
- 209.Schmitt SG, Aftab U, Jiang C, Redenti S, Klassen H, et al. Molecular Characterization of Human Retinal Progenitor Cells. Invest Ophthalmol Vis Sci. 2009 doi: 10.1167/iovs.08-3067. [DOI] [PubMed] [Google Scholar]
- 210.Huang M, Itahana K, Zhang Y, Mitchell BS. Depletion of guanine nucleotides leads to the Mdm2-dependent proteasomal degradation of nucleostemin. Cancer Res. 2009;69:3004–3012. doi: 10.1158/0008-5472.CAN-08-3413. [DOI] [PMC free article] [PubMed] [Google Scholar]
- 211.Leonard BW, Mastroeni D, Grover A, Liu Q, Yang K, et al. Subventricular zone neural progenitors from rapid brain autopsies of elderly subjects with and without neurodegenerative disease. J Comp Neurol. 2009;515:269–294. doi: 10.1002/cne.22040. [DOI] [PMC free article] [PubMed] [Google Scholar]
- 212.Scott LJ, Muglia P, Kong XQ, Guan W, Flickinger M, et al. Genome-wide association and meta-analysis of bipolar disorder in individuals of European ancestry. Proc Natl Acad Sci U S A. 2009;106:7501–7506. doi: 10.1073/pnas.0813386106. [DOI] [PMC free article] [PubMed] [Google Scholar]
- 213.Dai MS, Sun XX, Lu H. Aberrant expression of nucleostemin activates p53 and induces cell cycle arrest via inhibition of MDM2. Mol Cell Biol. 2008;28:4365–4376. doi: 10.1128/MCB.01662-07. [DOI] [PMC free article] [PubMed] [Google Scholar]
- 214.Seto E, Shi Y, Shenk T. YY1 is an initiator sequence-binding protein that directs and activates transcription in vitro. Nature. 1991;354:241–245. doi: 10.1038/354241a0. [DOI] [PubMed] [Google Scholar]
- 215.Xi H, Yu Y, Fu Y, Foley J, Halees A, et al. Analysis of overrepresented motifs in human core promoters reveals dual regulatory roles of YY1. Genome Res. 2007;17:798–806. doi: 10.1101/gr.5754707. [DOI] [PMC free article] [PubMed] [Google Scholar]
- 216.Perry RP. The architecture of mammalian ribosomal protein promoters. BMC Evol Biol. 2005;5:15. doi: 10.1186/1471-2148-5-15. [DOI] [PMC free article] [PubMed] [Google Scholar]
- 217.Castellano G, Torrisi E, Ligresti G, Malaponte G, Militello L, et al. The involvement of the transcription factor Yin Yang 1 in cancer development and progression. Cell Cycle. 2009;8:1367–1372. doi: 10.4161/cc.8.9.8314. [DOI] [PubMed] [Google Scholar]
- 218.Wu S, Murai S, Kataoka K, Miyagishi M. Yin Yang 1 induces transcriptional activity of p73 through cooperation with E2F1. Biochem Biophys Res Commun. 2008;365:75–81. doi: 10.1016/j.bbrc.2007.10.145. [DOI] [PubMed] [Google Scholar]
- 219.Wu S, Murai S, Kataoka K, Miyagishi M. Cooperative regulation of p73 promoter by Yin Yang 1 and E2F1. Nucleic Acids Symp Ser (Oxf) 2007:347–348. doi: 10.1093/nass/nrm174. [DOI] [PubMed] [Google Scholar]
- 220.Hiromura M, Choi CH, Sabourin NA, Jones H, Bachvarov D, et al. YY1 is regulated by O-linked N-acetylglucosaminylation (O-glcNAcylation). J Biol Chem. 2003;278:14046–14052. doi: 10.1074/jbc.M300789200. [DOI] [PubMed] [Google Scholar]
- 221.Guo J, Casolaro V, Seto E, Yang WM, Chang C, et al. Yin-Yang 1 activates interleukin-4 gene expression in T cells. J Biol Chem. 2001;276:48871–48878. doi: 10.1074/jbc.M101592200. [DOI] [PubMed] [Google Scholar]
- 222.Guo J, Lin X, Williams MA, Hamid Q, Georas SN. Yin-Yang 1 regulates effector cytokine gene expression and T(H)2 immune responses. J Allergy Clin Immunol. 2008;122:195–201, 201 e191-195. doi: 10.1016/j.jaci.2008.03.012. [DOI] [PMC free article] [PubMed] [Google Scholar]
- 223.Tone Y, Kojima Y, Furuuchi K, Brady M, Yashiro-Ohtani Y, et al. OX40 gene expression is up-regulated by chromatin remodeling in its promoter region containing Sp1/Sp3, YY1, and NF-kappa B binding sites. J Immunol. 2007;179:1760–1767. doi: 10.4049/jimmunol.179.3.1760. [DOI] [PubMed] [Google Scholar]
- 224.Oh J, Broyles SS. Host cell nuclear proteins are recruited to cytoplasmic vaccinia virus replication complexes. J Virol. 2005;79:12852–12860. doi: 10.1128/JVI.79.20.12852-12860.2005. [DOI] [PMC free article] [PubMed] [Google Scholar]
- 225.Ji HB, Gupta A, Okamoto S, Blum MD, Tan L, et al. T cell-specific expression of the murine CD3delta promoter. J Biol Chem. 2002;277:47898–47906. doi: 10.1074/jbc.M201025200. [DOI] [PubMed] [Google Scholar]
- 226.Montalvo EA, Cottam M, Hill S, Wang YJ. YY1 binds to and regulates cis-acting negative elements in the Epstein-Barr virus BZLF1 promoter. J Virol. 1995;69:4158–4165. doi: 10.1128/jvi.69.7.4158-4165.1995. [DOI] [PMC free article] [PubMed] [Google Scholar]
- 227.Zalani S, Coppage A, Holley-Guthrie E, Kenney S. The cellular YY1 transcription factor binds a cis-acting, negatively regulating element in the Epstein-Barr virus BRLF1 promoter. J Virol. 1997;71:3268–3274. doi: 10.1128/jvi.71.4.3268-3274.1997. [DOI] [PMC free article] [PubMed] [Google Scholar]
- 228.He Y, Casaccia-Bonnefil P. The Yin and Yang of YY1 in the nervous system. J Neurochem. 2008;106:1493–1502. doi: 10.1111/j.1471-4159.2008.05486.x. [DOI] [PMC free article] [PubMed] [Google Scholar]
- 229.Berndt JA, Kim JG, Tosic M, Kim C, Hudson LD. The transcriptional regulator Yin Yang 1 activates the myelin PLP gene. J Neurochem. 2001;77:935–942. doi: 10.1046/j.1471-4159.2001.00307.x. [DOI] [PubMed] [Google Scholar]
- 230.Ai W, Narahari J, Roman A. Yin yang 1 negatively regulates the differentiation-specific E1 promoter of human papillomavirus type 6. J Virol. 2000;74:5198–5205. doi: 10.1128/jvi.74.11.5198-5205.2000. [DOI] [PMC free article] [PubMed] [Google Scholar]
- 231.Pande S, Jain N, Prusty BK, Bhambhani S, Gupta S, et al. Human papillomavirus type 16 variant analysis of E6, E7, and L1 genes and long control region in biopsy samples from cervical cancer patients in north India. J Clin Microbiol. 2008;46:1060–1066. doi: 10.1128/JCM.02202-07. [DOI] [PMC free article] [PubMed] [Google Scholar]
- 232.Knutson BA, Oh J, Broyles SS. Downregulation of vaccinia virus intermediate and late promoters by host transcription factor YY1. J Gen Virol. 2009 doi: 10.1099/vir.0.006924-0. [DOI] [PubMed] [Google Scholar]
- 233.Khalil MI, Hay J, Ruyechan WT. Cellular transcription factors Sp1 and Sp3 suppress varicella-zoster virus origin-dependent DNA replication. J Virol. 2008;82:11723–11733. doi: 10.1128/JVI.01322-08. [DOI] [PMC free article] [PubMed] [Google Scholar]
- 234.Le May N, Mansuroglu Z, Leger P, Josse T, Blot G, et al. A SAP30 complex inhibits IFN-beta expression in Rift Valley fever virus infected cells. PLoS Pathog. 2008;4:e13. doi: 10.1371/journal.ppat.0040013. [DOI] [PMC free article] [PubMed] [Google Scholar]
- 235.Mai RT, Yeh TS, Kao CF, Sun SK, Huang HH, et al. Hepatitis C virus core protein recruits nucleolar phosphoprotein B23 and coactivator p300 to relieve the repression effect of transcriptional factor YY1 on B23 gene expression. Oncogene. 2006;25:448–462. doi: 10.1038/sj.onc.1209052. [DOI] [PubMed] [Google Scholar]
- 236.Liu H, Schmidt-Supprian M, Shi Y, Hobeika E, Barteneva N, et al. Yin Yang 1 is a critical regulator of B-cell development. Genes Dev. 2007;21:1179–1189. doi: 10.1101/gad.1529307. [DOI] [PMC free article] [PubMed] [Google Scholar]
- 237.Erkeland SJ, Valkhof M, Heijmans-Antonissen C, Delwel R, Valk PJ, et al. The gene encoding the transcriptional regulator Yin Yang 1 (YY1) is a myeloid transforming gene interfering with neutrophilic differentiation. Blood. 2003;101:1111–1117. doi: 10.1182/blood-2002-04-1207. [DOI] [PubMed] [Google Scholar]
- 238.He Y, Sandoval J, Casaccia-Bonnefil P. Events at the transition between cell cycle exit and oligodendrocyte progenitor differentiation: the role of HDAC and YY1. Neuron Glia Biol. 2007;3:221–231. doi: 10.1017/S1740925X08000057. [DOI] [PMC free article] [PubMed] [Google Scholar]
- 239.He Y, Dupree J, Wang J, Sandoval J, Li J, et al. The transcription factor Yin Yang 1 is essential for oligodendrocyte progenitor differentiation. Neuron. 2007;55:217–230. doi: 10.1016/j.neuron.2007.06.029. [DOI] [PMC free article] [PubMed] [Google Scholar]
- 240.Topilko P, Schneider-Maunoury S, Levi G, Baron-Van Evercooren A, Chennoufi AB, et al. Krox-20 controls myelination in the peripheral nervous system. Nature. 1994;371:796–799. doi: 10.1038/371796a0. [DOI] [PubMed] [Google Scholar]
- 241.Bhatheja K, Field J. Schwann cells: origins and role in axonal maintenance and regeneration. Int J Biochem Cell Biol. 2006;38:1995–1999. doi: 10.1016/j.biocel.2006.05.007. [DOI] [PubMed] [Google Scholar]
- 242.Murphy P, Topilko P, Schneider-Maunoury S, Seitanidou T, Baron-Van Evercooren A, et al. The regulation of Krox-20 expression reveals important steps in the control of peripheral glial cell development. Development. 1996;122:2847–2857. doi: 10.1242/dev.122.9.2847. [DOI] [PubMed] [Google Scholar]
- 243.Scherer SS. The biology and pathobiology of Schwann cells. Curr Opin Neurol. 1997;10:386–397. doi: 10.1097/00019052-199710000-00006. [DOI] [PubMed] [Google Scholar]
- 244.Schumacher M, Guennoun R, Mercier G, Desarnaud F, Lacor P, et al. Progesterone synthesis and myelin formation in peripheral nerves. Brain Res Brain Res Rev. 2001;37:343–359. doi: 10.1016/s0165-0173(01)00139-4. [DOI] [PubMed] [Google Scholar]
- 245.Guennoun R, Benmessahel Y, Delespierre B, Gouezou M, Rajkowski KM, et al. Progesterone stimulates Krox-20 gene expression in Schwann cells. Brain Res Mol Brain Res. 2001;90:75–82. doi: 10.1016/s0169-328x(01)00094-8. [DOI] [PubMed] [Google Scholar]
- 246.Mercier G, Turque N, Schumacher M. Early activation of transcription factor expression in Schwann cells by progesterone. Brain Res Mol Brain Res. 2001;97:137–148. doi: 10.1016/s0169-328x(01)00311-4. [DOI] [PubMed] [Google Scholar]
- 247.Magnaghi V, Ballabio M, Roglio I, Melcangi RC. Progesterone derivatives increase expression of Krox-20 and Sox-10 in rat Schwann cells. J Mol Neurosci. 2007;31:149–157. doi: 10.1385/jmn/31:02:149. [DOI] [PubMed] [Google Scholar]
- 248.Mirsky R, Woodhoo A, Parkinson DB, Arthur-Farraj P, Bhaskaran A, et al. Novel signals controlling embryonic Schwann cell development, myelination and dedifferentiation. J Peripher Nerv Syst. 2008;13:122–135. doi: 10.1111/j.1529-8027.2008.00168.x. [DOI] [PubMed] [Google Scholar]
- 249.Jessen KR, Mirsky R. Origin and early development of Schwann cells. Microsc Res Tech. 1998;41:393–402. doi: 10.1002/(SICI)1097-0029(19980601)41:5<393::AID-JEMT6>3.0.CO;2-R. [DOI] [PubMed] [Google Scholar]
- 250.Wakatsuki S, Yumoto N, Komatsu K, Araki T, Sehara-Fujisawa A. Roles of meltrin-beta/ADAM19 in progression of Schwann cell differentiation and myelination during sciatic nerve regeneration. J Biol Chem. 2009;284:2957–2966. doi: 10.1074/jbc.M803191200. [DOI] [PubMed] [Google Scholar]
- 251.Parkinson DB, Bhaskaran A, Arthur-Farraj P, Noon LA, Woodhoo A, et al. c-Jun is a negative regulator of myelination. J Cell Biol. 2008;181:625–637. doi: 10.1083/jcb.200803013. [DOI] [PMC free article] [PubMed] [Google Scholar]
- 252.Parkinson DB, Bhaskaran A, Droggiti A, Dickinson S, D'Antonio M, et al. Krox-20 inhibits Jun-NH2-terminal kinase/c-Jun to control Schwann cell proliferation and death. J Cell Biol. 2004;164:385–394. doi: 10.1083/jcb.200307132. [DOI] [PMC free article] [PubMed] [Google Scholar]
- 253.Salzer JL. Switching myelination on and off. J Cell Biol. 2008;181:575–577. doi: 10.1083/jcb.200804136. [DOI] [PMC free article] [PubMed] [Google Scholar]
- 254.Topilko P, Levi G, Merlo G, Mantero S, Desmarquet C, et al. Differential regulation of the zinc finger genes Krox-20 and Krox-24 (Egr-1) suggests antagonistic roles in Schwann cells. J Neurosci Res. 1997;50:702–712. doi: 10.1002/(SICI)1097-4547(19971201)50:5<702::AID-JNR7>3.0.CO;2-L. [DOI] [PubMed] [Google Scholar]
- 255.Dugas JC, Tai YC, Speed TP, Ngai J, Barres BA. Functional genomic analysis of oligodendrocyte differentiation. J Neurosci. 2006;26:10967–10983. doi: 10.1523/JNEUROSCI.2572-06.2006. [DOI] [PMC free article] [PubMed] [Google Scholar]
- 256.Larocque D, Fragoso G, Huang J, Mushynski WE, Loignon M, et al. The QKI-6 and QKI-7 RNA binding proteins block proliferation and promote Schwann cell myelination. PLoS One. 2009;4:e5867. doi: 10.1371/journal.pone.0005867. [DOI] [PMC free article] [PubMed] [Google Scholar]
- 257.Sock E, Leger H, Kuhlbrodt K, Schreiber J, Enderich J, et al. Expression of Krox proteins during differentiation of the O-2A progenitor cell line CG-4. J Neurochem. 1997;68:1911–1919. doi: 10.1046/j.1471-4159.1997.68051911.x. [DOI] [PubMed] [Google Scholar]
- 258.Harris JE, Bishop KD, Phillips NE, Mordes JP, Greiner DL, et al. Early growth response gene-2, a zinc-finger transcription factor, is required for full induction of clonal anergy in CD4+ T cells. J Immunol. 2004;173:7331–7338. doi: 10.4049/jimmunol.173.12.7331. [DOI] [PubMed] [Google Scholar]
- 259.Okamura T, Fujio K, Shibuya M, Sumitomo S, Shoda H, et al. CD4+CD25-LAG3+ regulatory T cells controlled by the transcription factor Egr-2. Proc Natl Acad Sci U S A. 2009;106:13974–13979. doi: 10.1073/pnas.0906872106. [DOI] [PMC free article] [PubMed] [Google Scholar]
- 260.Hsiao HW, Liu WH, Wang CJ, Lo YH, Wu YH, et al. Deltex1 is a target of the transcription factor NFAT that promotes T cell anergy. Immunity. 2009;31:72–83. doi: 10.1016/j.immuni.2009.04.017. [DOI] [PubMed] [Google Scholar]
- 261.Zhu B, Symonds AL, Martin JE, Kioussis D, Wraith DC, et al. Early growth response gene 2 (Egr-2) controls the self-tolerance of T cells and prevents the development of lupuslike autoimmune disease. J Exp Med. 2008;205:2295–2307. doi: 10.1084/jem.20080187. [DOI] [PMC free article] [PubMed] [Google Scholar]
- 262.Mittelstadt PR, Ashwell JD. Role of Egr-2 in up-regulation of Fas ligand in normal T cells and aberrant double-negative lpr and gld T cells. J Biol Chem. 1999;274:3222–3227. doi: 10.1074/jbc.274.5.3222. [DOI] [PubMed] [Google Scholar]
- 263.Kramer B, Meichle A, Hensel G, Charnay P, Kronke M. Characterization of an Krox-24/Egr-1-responsive element in the human tumor necrosis factor promoter. Biochim Biophys Acta. 1994;1219:413–421. doi: 10.1016/0167-4781(94)90066-3. [DOI] [PubMed] [Google Scholar]
- 264.Cron RQ, Bandyopadhyay R, Genin A, Brunner M, Kersh GJ, et al. Early growth response-1 is required for CD154 transcription. J Immunol. 2006;176:811–818. doi: 10.4049/jimmunol.176.2.811. [DOI] [PMC free article] [PubMed] [Google Scholar]
- 265.Chang X, Chen L, Wen J, Godfrey VL, Qiao G, et al. Foxp3 controls autoreactive T cell activation through transcriptional regulation of early growth response genes and E3 ubiquitin ligase genes, independently of thymic selection. Clin Immunol. 2006;121:274–285. doi: 10.1016/j.clim.2006.07.004. [DOI] [PubMed] [Google Scholar]
- 266.Wieland GD, Nehmann N, Muller D, Eibel H, Siebenlist U, et al. Early growth response proteins EGR-4 and EGR-3 interact with immune inflammatory mediators NF-kappaB p50 and p65. J Cell Sci. 2005;118:3203–3212. doi: 10.1242/jcs.02445. [DOI] [PubMed] [Google Scholar]
- 267.Decker EL, Nehmann N, Kampen E, Eibel H, Zipfel PF, et al. Early growth response proteins (EGR) and nuclear factors of activated T cells (NFAT) form heterodimers and regulate proinflammatory cytokine gene expression. Nucleic Acids Res. 2003;31:911–921. doi: 10.1093/nar/gkg186. [DOI] [PMC free article] [PubMed] [Google Scholar]
- 268.Mullin M, Lightfoot K, Clarke R, Miller M, Lahesmaa R, et al. The RhoA transcriptional program in pre-T cells. FEBS Lett. 2007;581:4309–4317. doi: 10.1016/j.febslet.2007.07.077. [DOI] [PMC free article] [PubMed] [Google Scholar]
- 269.Taghon T, Yui MA, Pant R, Diamond RA, Rothenberg EV. Developmental and molecular characterization of emerging beta- and gammadelta-selected pre-T cells in the adult mouse thymus. Immunity. 2006;24:53–64. doi: 10.1016/j.immuni.2005.11.012. [DOI] [PubMed] [Google Scholar]
- 270.Seiwa C, Kojima-Aikawa K, Matsumoto I, Asou H. CNS myelinogenesis in vitro: myelin basic protein deficient shiverer oligodendrocytes. J Neurosci Res. 2002;69:305–317. doi: 10.1002/jnr.10291. [DOI] [PubMed] [Google Scholar]
- 271.Petro TM. ERK-MAP-kinases differentially regulate expression of IL-23 p19 compared with p40 and IFN-beta in Theiler's virus-infected RAW264.7 cells. Immunol Lett. 2005;97:47–53. doi: 10.1016/j.imlet.2004.09.013. [DOI] [PubMed] [Google Scholar]
- 272.Samten B, Townsend JC, Weis SE, Bhoumik A, Klucar P, et al. CREB, ATF, and AP-1 transcription factors regulate IFN-gamma secretion by human T cells in response to mycobacterial antigen. J Immunol. 2008;181:2056–2064. doi: 10.4049/jimmunol.181.3.2056. [DOI] [PMC free article] [PubMed] [Google Scholar]
- 273.Stolt CC, Schlierf A, Lommes P, Hillgartner S, Werner T, et al. SoxD proteins influence multiple stages of oligodendrocyte development and modulate SoxE protein function. Dev Cell. 2006;11:697–709. doi: 10.1016/j.devcel.2006.08.011. [DOI] [PubMed] [Google Scholar]
- 274.Yui MA, Rothenberg EV. Deranged early T cell development in immunodeficient strains of nonobese diabetic mice. J Immunol. 2004;173:5381–5391. doi: 10.4049/jimmunol.173.9.5381. [DOI] [PubMed] [Google Scholar]
- 275.Georgescu C, Longabaugh WJ, Scripture-Adams DD, David-Fung ES, Yui MA, et al. A gene regulatory network armature for T lymphocyte specification. Proc Natl Acad Sci U S A. 2008;105:20100–20105. doi: 10.1073/pnas.0806501105. [DOI] [PMC free article] [PubMed] [Google Scholar]
- 276.David-Fung ES, Butler R, Buzi G, Yui MA, Diamond RA, et al. Transcription factor expression dynamics of early T-lymphocyte specification and commitment. Dev Biol. 2009;325:444–467. doi: 10.1016/j.ydbio.2008.10.021. [DOI] [PMC free article] [PubMed] [Google Scholar]
- 277.Rothenberg EV, Pant R. Origins of lymphocyte developmental programs: transcription factor evidence. Semin Immunol. 2004;16:227–238. doi: 10.1016/j.smim.2004.08.002. [DOI] [PubMed] [Google Scholar]
- 278.Rothenberg EV. Decision by committee: new light on the CD4/CD8-lineage choice. Immunol Cell Biol. 2009;87:109–112. doi: 10.1038/icb.2008.100. [DOI] [PubMed] [Google Scholar]
- 279.Rothenberg EV, Moore JE, Yui MA. Launching the T-cell-lineage developmental programme. Nat Rev Immunol. 2008;8:9–21. doi: 10.1038/nri2232. [DOI] [PMC free article] [PubMed] [Google Scholar]
- 280.Rothenberg EV, Scripture-Adams DD. Competition and collaboration: GATA-3, PU.1, and Notch signaling in early T-cell fate determination. Semin Immunol. 2008;20:236–246. doi: 10.1016/j.smim.2008.07.006. [DOI] [PMC free article] [PubMed] [Google Scholar]
- 281.Rothenberg EV. T-lineage specification and commitment: a gene regulation perspective. Semin Immunol. 2002;14:431–440. doi: 10.1016/s1044532302000787. [DOI] [PubMed] [Google Scholar]
- 282.Polman CH, Reingold SC, Edan G, Filippi M, Hartung HP, et al. Diagnostic criteria for multiple sclerosis: 2005 revisions to the “McDonald Criteria”. Ann Neurol. 2005;58:840–846. doi: 10.1002/ana.20703. [DOI] [PubMed] [Google Scholar]
- 283.Thompson AJ, Montalban X, Barkhof F, Brochet B, Filippi M, et al. Diagnostic criteria for primary progressive multiple sclerosis: a position paper. Ann Neurol. 2000;47:831–835. [PubMed] [Google Scholar]
- 284.Placebo-controlled multicentre randomised trial of interferon beta-1b in treatment of secondary progressive multiple sclerosis. European Study Group on interferon beta-1b in secondary progressive MS. Lancet. 1998;352:1491–1497. [PubMed] [Google Scholar]
- 285.Moscato P, Mendes A, Berretta R. Benchmarking a memetic algorithm for ordering microarray data. Biosystems. 2007;88:56–75. doi: 10.1016/j.biosystems.2006.04.005. [DOI] [PubMed] [Google Scholar]
Associated Data
This section collects any data citations, data availability statements, or supplementary materials included in this article.
Supplementary Materials
Table S1
Signature Control - MS. Heatmap and annotation for the C/MS signature. Probe Ids, expression values, hitting set annotation, and gene annotations are given.
(1.08 MB XLS)
Table S2
Signatures Control - RRMS and Control - SPMS. For each signature, the probe Ids, expression values, heatmap, hitting set annotation, and gene annotations are given.
(1.88 MB XLS)
Table S3
Signatures Control - PPMS, PPMS - SPMS, RRMS - PPMS and RRMS - SPMS. For each signature, the probe Ids, expression values, heatmap, hitting set annotation, and gene annotations are given.
(2.27 MB XLS)
Table S4
(α,β) k-feature set summary statistics. Summary statistics of the (α,β) k-feature set selection process for each of the signatures and combined listing of all signatures, showing over or under expression and signature overlap. Overlap with the signatures in the companion study are also given.
(0.52 MB XLS)
Table S5
TRANSFAC Profiles. Excel file containing the TRANSFAC profiles for the 7 signatures, 14 up/down-regulated signature subsets, and 15 star clusters.
(0.30 MB XLS)
Table S6
g:Profiler functional profiles for signatures. Functional profiles for each signature. Profiling was performed with g:PROFILER [163], which integrates several profiling resources, including Gene Ontology, KEGG and Reactome pathways, and TRANSFAC sequence motifs. Note that a group of six ribosomal protein genes (RPL10A, RPL12, RPL39, RPS17, RPS21, and RPS25P8) are responsible for over half of the significant terms (17 of the 30) in the C/MS profile, and are linked to viral and translation pathways. Similarly, there is a group of nine ribosomal genes (RPL27, RPL35, RPL35A, RPL39, RPS5, RPS14, RPS15A, RPS27A, and RPLP0P2) that are responsible for almost all the significant Reactome pathway terms in the profile for C/PP; most of these terms relate to influenza or translation pathways - principally translation initiation, translation elongation and influenza viral RNA transcription and replication.
(0.47 MB PDF)
Table S7
Members of high cardinality stars. Complete member listing of all 39 high cardinality stars.
(0.29 MB XLS)
Figure S1
Stars correlation plots. Correlation plots for all high cardinality stars.
(8.18 MB PDF)
Figure S2
Largest clusters. The seventeen largest clusters found by analysis of genes differentially co-expressed over controls and MS. Figure is in GML format.
(0.44 MB ZIP)