Hotspots of aberrant epigenomic reprogramming in human induced pluripotent stem cells (original) (raw)
. Author manuscript; available in PMC: 2011 Sep 3.
Published in final edited form as: Nature. 2011 Feb 2;471(7336):68–73. doi: 10.1038/nature09798
Abstract
Induced pluripotent stem cells (iPSCs) offer immense potential for regenerative medicine and studies of disease and development. Somatic cell reprogramming involves epigenomic reconfiguration, conferring iPSCs with characteristics similar to embryonic stem (ES) cells. However, it remains unknown how complete the reestablishment of ES-cell-like DNA methylation patterns is throughout the genome. Here we report the first whole-genome profiles of DNA methylation at single-base resolution in five human iPSC lines, along with methylomes of ES cells, somatic cells, and differentiated iPSCs and ES cells. iPSCs show significant reprogramming variability, including somatic memory and aberrant reprogramming of DNA methylation. iPSCs share megabase-scale differentially methylated regions proximal to centromeres and telomeres that display incomplete reprogramming of non-CG methylation, and differences in CG methylation and histone modifications. Lastly, differentiation of iPSCs into trophoblast cells revealed that errors in reprogramming CG methylation are transmitted at a high frequency, providing an iPSC reprogramming signature that is maintained after differentiation.
Generation of iPSCs from somatic cells offers tremendous potential for therapeutics, the study of disease states, and elucidation of developmental processes1,2. iPSC production techniques introduce active genes that are necessary for pluripotency, or their derivative RNA or protein products, into a somatic cell to induce pluripotent cellular properties that closely resemble those of ES cells3–8. Indeed, iPSCs have been used to produce viable and fertile adult mice, demonstrating their pluripotent potential to form all adult somatic and germline cell types8,9.
The reprogramming process by which a somatic cell acquires pluripotent potential is not a genetic transformation, but an epigenomic one. A recent study reported minimal differences in chromatin structure and gene expression between human ES cells and iPSCs, indicating that ES cells and iPSCs are nearly identical cell types10. On the other hand, there are recent reports indicating epigenomic differences between ES cells and iPSCs11–15 and alterations in the differentiation potential of iPSCs compared to ES cells13,16,17. Together, these findings indicate that fundamental differences between ES cells and iPSCs exist, prompting the question of how complete and variable the reestablishment of ES-cell-like DNA methylation patterns are throughout the entire genome.
Presumably, optimal reprogramming of somatic cells to a pluripotent state requires complete reversion of the somatic epigenome into an ES-cell-like state, but until now a comprehensive survey of the changes in such epigenetic marks in a variety of independent iPSC lines has not been reported. Accordingly, we have performed whole-genome profiling of the DNA methylomes of multiple human ES cell, iPSC and somatic progenitor lines, encompassing reprogramming performed in different laboratories, using different iPSC-inducing technologies and cells derived from distinct germ layers. We show that although on a global scale ES cell and iPSC methylomes are very similar, every iPSC line shows significant reprogramming variability compared to both ES cells and other iPSCs, including both somatic ‘memory’ and iPSC-specific differential DNA methylation. Further, all iPSC lines share numerous non-randomly distributed megabase-scale regions that are aberrantly methylated in the non-CG context, associated with alterations in CG methylation, histone modifications and gene expression. Lastly, we show that differentially methylated regions in iPSCs are transmitted to differentiated cells at a high frequency.
Globally similar ES cell and iPSC methylomes
To assess the degree to which a somatic cell DNA methylome is reprogrammed into an ES-cell-like state by induction of a pluripotent state, we generated whole-genome, single-base resolution DNA methylomes of a range of human cell types using the shotgun bisulphite-sequencing method, MethylC-Seq18. Our central focus was a high-efficiency, feeder-free reprogramming system19, in which female adipose-derived stem cells (ADS) were reprogrammed into a pluripotent state by retroviral transformation with the OCT4, SOX2, KLF4 and MYC genes (ADS-iPSCs), satisfying the criteria for pluripotency in human cells20. Additionally, we analysed the DNA methylome of adipocytes derived from the ADS cells (ADS-adipose) through adipogenic differentiation conditions. Further, to explore the variation between independent iPSC lines potentially due to stochastic reprogramming events, progenitor somatic cell type, reprogramming technique and laboratory-specific effects, we generated full DNA methylomes for four additional iPSC lines that were isolated in an independent laboratory: an iPSC line generated by lentiviral integration of the OCT4, SOX2, NANOG and LIN28A genes into IMR90 lung fibroblasts (IMR90-iPSCs)5, and three iPSC lines generated by reprogramming of foreskin fibroblasts (FF) by non-integrating episomal vectors (FF-iPSC 6.9, FF-iPSC 19.7, FF-iPSC 19.11), as described previously7. We also sequenced the DNA methylome of the somatic FF progenitor line. Lastly, to study the effects of cellular differentiation on the DNA methylomes of ES cells and iPSCs, we differentiated cells of each to trophoblast lineage cells by growth in the presence of bone morphogenic protein 4 (BMP4)21. High-sequence coverage of the 11 new base-resolution DNA methylomes allowed interrogation of 75.7–94.5% of the genomic cytosines (Fig. 1a and Supplementary Table 1).
Figure 1. Global trends of human iPSC and ES cell DNA methylomes.
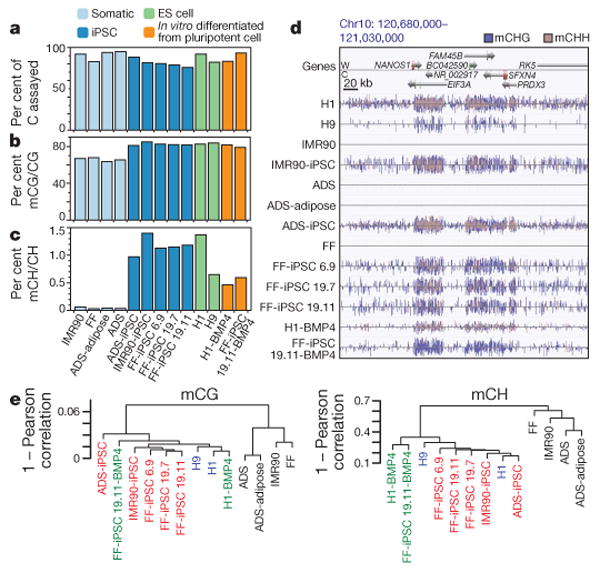
a, Per cent of all cytosines on each strand of the human genome assayed for each sample. b, c, The per cent of all sequencing base calls that were methylated (C, resistant to bisulphite conversion) at covered C bases in the CG (b) and CH contexts (c) (where H = A, C, or T) throughout the genome, minus the bisulphite non-conversion frequency. d, AnnoJ data browser representation of the restoration of non-CG methylation in all iPSC and ES cell lines. e, Dendrogram of the analysed cell lines based on Pearson correlation of mCG or mCH levels in 1-kb windows throughout the genome.
The genome-wide frequency of DNA methylation at both CG and non-CG (mCH, where H = A, C or T) sites indicated that iPSCs resemble ES cells and are distinct from somatic cells. All ES cell and iPSC lines were methylated at CG dinucleotides at a higher frequency compared to the somatic cell lines (Fig. 1b), consistent with the global partially methylated state previously observed in the IMR90 fibroblast genome18. Similarly, whereas somatic cells contained negligible levels of cytosine methylation in the non-CG context, all pluripotent cells harboured significant mCH at a similar frequency (Fig. 1c), accounting for 20–30% of detected DNA methylation events in the genome. As observed in ES cells18, all iPSC genomes showed enrichment for mCH in genes (Fig. 1d). On a genome scale the DNA methylomes of ES cells and iPSCs are similar to one another and highly distinct from the primary somatic cell lines, including the adult stem cell ADS line, and this relationship agrees with clustering of cell types based on transcriptional activity (Fig. 1e and Supplementary Fig. 1a, b). Analysis of DNA methylation patterns at enhancers, transcription-factor-binding sites and pluripotency-related genes confirmed the previously reported methylation patterns18 (Supplementary Figs 2–6). Taken together, these data indicate that, on the genome scale and at these crucial genomic regions, iPSC and ES cell DNA methylomes closely resemble one another.
We discovered previously that 40% of the genome of IMR90 fibroblasts was in a partially methylated state, termed partially methylated domains (PMDs)18. The DNA methylomes of the primary somatic cell lines we have profiled here also contain PMDs in a similar proportion of the genome to IMR90 cells (Fig. 2a). As observed previously in IMR90 cells, the transcript abundance associated with genes located within PMDs was lower than the average for all other genes (Fig. 2b). Notably, these PMDs were transformed to a fully methylated state in the CG context by induction of a pluripotent state (Fig. 2a and Supplementary Fig. 7). Lastly, the reprogramming process was able to reverse the transcriptional repression associated with the PMD state (Fig. 2b).
Figure 2. Partially methylated domains become highly methylated on induction of pluripotency.

a, Total length of PMDs identified in each cell line and overlap of PMDs identified in the four somatic cell types. b, mRNA-Seq RPKM (reads per kilobase of exon per million reads) values for all RefSeq genes outside PMDs, and all RefSeq genes within genomic regions defined as PMDs. For ADS-iPSC and H1 the ADS PMD genomic regions were used as PMDs. P value is from two-tailed Wilcoxon test between ADS PMDs and ADS-iPSC PMDs.
mCG somatic memory and aberrant reprogramming
Although global patterns of DNA methylation in the CG context appeared very similar between ES cells and iPSCs (Figs 1 and 2), a comprehensive analysis of CG DNA methylation between all ES cell and iPSC lines identified 1,175 differentially methylated regions (CG-DMRs) that were differentially methylated in at least one iPSC or ES cell line (1% false discovery rate (FDR); Fig. 3a and Supplementary Table 2) and in total comprised 1.68 Mb ranging from 1–11 kb in length. Importantly, identification of CG-DMRs between the H1 and H9 ES cells with the same criteria (1% FDR) provided no results (see Supplementary Methods for details). Whereas mCG patterns within each category of cells (ES cell, iPSC, somatic) were generally consistent and distinct from the cells in each other category, individual cell lines showed some variability.
Figure 3. CG-DMRs identified between pluripotent cells.
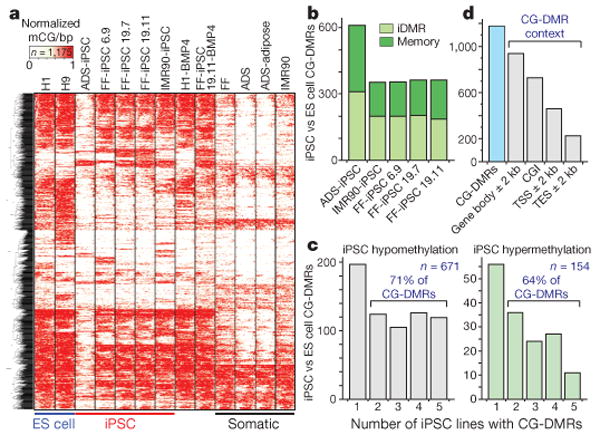
a, Complete linkage hierarchical clustering of mCG density within CG-DMRs identified between all ES cell and iPSC DNA methylomes. Each CG-DMR was profiled over 20 equally sized bins. b, The CG-DMRs for each iPSC line with respect to H1 and H9 ES cells were categorized as having methylation patterns like the progenitor somatic cell line (memory) or iPSC-specific (iDMR). c, Number of iPSC hypomethylated and hypermethyated CG-DMRs aberrant in the indicated number of iPSC lines. d, Number of all CG-DMRs coincident with indicated genomic and genic features. CGI, CG island; TES, transcriptional end site; TSS, transcriptional start site.
DNA methylation at CG islands proximal to gene promoters and transcriptional start sites is inhibitory to transcriptional activity22. To address whether highly methylated CG islands in differentiated cells can be demethylated during iPSC reprogramming, we analysed CG-DMRs between the ES cells and somatic cells (1% FDR, twofold enrichment) that overlapped with CG islands. Of 3,507 CG-DMRs coincident with CG islands (CGI-DMRs), 1,904 and 374 were hypermethylated in ES cells and somatic cells, respectively. Of the 374 CGI-DMRs hypermethylated in somatic cells, 94% were hypomethylated in the iPSCs and were similar to ES cells (Supplementary Fig. 8). Of the 1,904 CGI-DMRs hypermethylated in ES cells, 83% were hypermethylated, similar to ES cells, in the iPSCs (Supplementary Fig. 9). Together, these results indicate that CG islands in iPSCs are predominantly reprogrammed to an ES-cell-like state and, in particular, hypermethylated CG islands are not especially resistant to reprogramming.
CG-DMRs identified between iPSCs and ES cells may be categorized as either a failure to reprogram the progenitor somatic cell methylation patterns (somatic ‘memory’) or iPSC-specific DMRs (iDMRs) that are not observed in the progenitor somatic cells and ES cells. A recent study reported the retention of somatic cell DNA methylation patterns in early-passage (passage 4) mouse iPSCs that was sufficient to distinguish between iPSC lines derived from different progenitor cell types, and which was subsequently attenuated after further passages (10–16 in total)14. However, the iPSCs analysed here included relatively late-passage iPSC lines (15–65 passages; Supplementary Table 1), indicating that we are able to discriminate somatic DNA methylation patterns in iPSCs that are resistant to resetting to an ES-cell-like state. Comparison of iPSC lines to their respective progenitors revealed that 44–49% of CG-DMRs were aberrant with respect to ES cells (P value = 0.05) and reflected memory of the progenitor methylation state (Fig. 3b and Supplementary Fig. 10). Accordingly, 51–56% of the iPSC CG-DMRs could be classified as iDMRs, reflecting a methylation state dissimilar to the respective progenitor somatic cell and both ES cell lines (Fig. 3b and Supplementary Fig. 10).
Inspection of the concordance of methylation states in the five iPSC lines showed that 69% of the CG-DMRs were aberrant with respect to the ES cells in at least two iPSC lines, with 16% being confirmed in all five iPSC lines (Fig. 3c and Supplementary Table 3). The majority of CG-DMRs (80%) occurred at CG islands, and to a lesser extent near or within genes (62%), with 29% and 19% located within 2 kb of transcriptional start and end sites, respectively (Fig. 3d). Analysis of biological processes attributed to genes proximal to CG-DMRs in each line or common to all iPSC lines did not identify any enrichment of specific processes, indicating that disruption of the normal regulation of these genes could affect many aspects of cellular function. Closer inspection of the CG-DMRs confirmed in all five iPSC lines revealed that the vast majority of them (119 of 130, or 92%) were hypomethylated in the iPSC lines, indicating that the general deficiency in resetting DNA methylation patterns during reprogramming is insufficient methylation. Notably, the remaining 11 CG-DMRs hypermethylated in all iPSC lines were iDMRs, as they are not differentially methylated in the progenitor cells compared to the ES cells. In addition, they were associated with transcriptional repression and the absence of the heterochromatic H3K27me3 histone modification, compared to H1 ES cells (Fig. 4a, b).
Figure 4. Characterization of CG-DMRs in iPSCs.
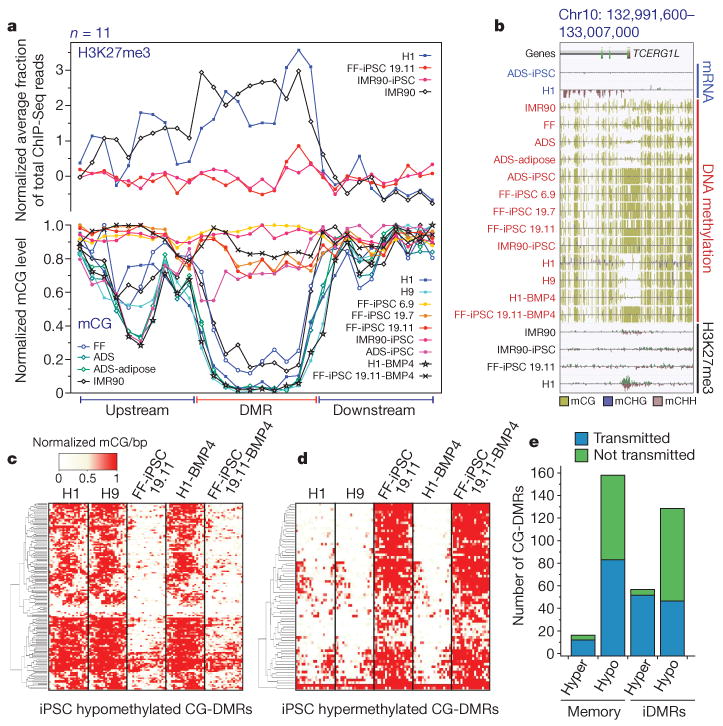
a, Normalized mCG levels (lower _y_-axis) and normalized H3K27me3 ChIP-Seq read density (upper _y_-axis) over CG-DMRs hypermethylated in all iPSC lines and flanking genomic regions. b, Data browser representation of mRNA, DNA methylation and H3K27me3 density for a CG-DMR identified in all iPSC lines. c, Complete linkage hierarchical clustering of mCG density within the CG-DMRs hypomethylated in both FF-iPSC 19.11 and FF-iPSC 19.11-BMP4 relative to H1, H9 and H1-BMP4 cell lines. Each CG-DMR was profiled over 20 equally sized bins. d, Same as c for hypermethylated CG-DMRs. e, FF-iPSC 19.11 CG-DMR transmission through differentiation to trophoblast cells. CG-DMRs were categorized by methylation state relative to the ES cells (hyper, hypermethylated; hypo, hypomethylated), similarity to somatic progenitor methylation (memory: like progenitor; iDMR: unlike progenitor), and whether the CG-DMR was present in FF-iPSC 19.11 differentiated into trophoblast cells with BMP4 (transmitted) or not (not transmitted).
The genome sequences at the CG-DM Rs present in all iPSC lines were analysed to identify motifs that could be associated with the altered DNA methylation states. Binding sites for two human transcription factors were identified in sequences conserved over the DMRs, corresponding to the reprogramming factor KLF4 and the chromatin-remodelling factor FOXL1 (Supplementary Fig. 11). Given that KLF4 has previously been found to bind to the promoter of FAM19A5 in H1 ES cells at precisely the same genomic position as one of the 11 hypermethylated iDMRs shared between all iPSC lines18, it is tempting to speculate that development of the conserved aberrant methylation states in the iPSC lines may be related to altered expression of the endogenous and/or introduced copy of KLF4 during the reprogramming process.
By differentiation of both H1 and FF-iPSC 19.11 cells into trophoblast lineage cells with BMP4, we were able to determine the frequency at which CG-DMRs in iPSCs were transmitted through differentiation. We identified 140 hypomethylated (Fig. 4c) and 70 hypermethylated (Fig. 4d) CG-DMRs present in both FF-iPSC 19.11 cells and FF-iPSC 19.11-BMP4 trophoblasts with respect to H1 and H9 ES cells, and H1-BMP4 trophoblasts. A high proportion of the CG-DMRs in FF-iPSC 19.11 cells relative to both ES cell lines were transmitted through the differentiation process, with 88% and 46% of hypermethylated and hypomethylated CG-DMRs, respectively, still present in FF-iPSC 19.11-BMP4 trophoblasts but not in H1-BMP4 trophoblasts (Fig. 4e). These transmitted CG-DMRs were comprised of both somatic memory (Fig. 4e and Supplementary Fig. 12) and iDMR (Fig. 4e and Supplementary Fig. 13) classes. Notably, 9 of 11 hypermethylated and 57 of 119 hypomethylated CG-DMRs present in all iPSC lines were transmitted to the FF-iPSC 19.11-BMP4 trophoblast cells.
The 1,175 CG-DMRs identified between iPSCs and ES cells and the iPSC conserved CG-DMRs were profiled and confirmed in two previously reported ES cell DNA methylomes, HSF1 (ref. 23) and H9-Laurent (ref. 24) (Supplementary Fig. 14). Hierarchical clustering of the 1,175 CG-DMRs indicated that HSF1 and H9-Laurent ES cells are similar to H1 and H9. Lastly, we find that all of the iPSC hypermethylated CG-DMRs and 75% of the iPSC hypomethylated CG-DMRs are confirmed with respect to the two additional ES cell lines (P value < 0.05, as for H1 and H9).
Several conclusions can be made from this catalogue of CG-DMRs. First, reprogramming a somatic cell to a pluripotent state generates hundreds of aberrantly methylated loci, predominantly at CG islands and associated with genes. Second, whereas insufficient reprogramming manifested as a memory of the progenitor somatic cell methylation state is common, a high incidence of iDMRs unlike both the progenitor somatic cell and ES cells indicates that aberrant methylation patterns dissimilar to both the start and endpoints of the reprogramming process are frequently generated. Third, although there is variability in the loci that are differentially methylated between iPSC lines, a high proportion of CG-DMRs are found in multiple independent iPSC lines, indicating that these regions have a strong propensity to be insufficiently or aberrantly reprogrammed. Fourth, a core set of CG-DMRs was present in every iPSC line, representing hotspots of failed epigenomic reprogramming common to iPSCs. Fifth, both memory CG-DMRs and iDMRs are transmitted through differentiation of the iPSCs at a high frequency, indicating that the disrupted DNA methylation states are not simply a transient aberration during the pluripotent state. The identification of hundreds of CG-DMRs that cannot be erased by passaging and are frequently transmitted through cellular differentiation has immediate consequences for the derivation and use of iPSCs.
Megabase-scale regions of aberrant non-CG methylation
Although non-CG DNA methylation levels and distribution were very similar between ES cells and iPSCs on a whole-genome and chromosomal scale (Fig. 1), a systematic comparison of non-CG methylation levels between the H1 and the ADS-iPSC lines throughout the autosomes revealed the presence of 29 large, non-CG differentially methylated regions (FDR = 1%; Supplementary Table 4). These non-CG ‘mega’-DMRs tended to be very large, with half greater than 1 Mb in length, the longest ∼4.8 Mb, and in total all 29 made up 32.4 Mb (Fig. 5a, inset). The majority of non-CG mega-DMRs were hypomethylated in the mCH context in the ADS-iPSC line (22 of 29, total length = 29.1 Mb; Supplementary Fig. 15a, b). The H1 hypomethylated non-CG mega-DMRs contained 36 genes enriched for biological processes related to epidermal cell differentiation (54% of 36 genes; P value =1.5 × 10⁻³⁵), and that predominantly were not expressed in H1 cells but were transcribed at a low level in ADS-iPSCs (Supplementary Table 5). Focusing subsequent analysis on the 22 non-CG mega-DMRs hypomethylated in the ADS-iPSC line compared to the H1 line, we discovered that non-CG mega-DMR localization was strongly biased towards close proximity to centromeres and telomeres (Fig. 5a; Poisson P value = 1 × 10⁻¹²), indicating that somatic cell reprogramming may be susceptible to DNA methylation abnormalities in these chromosomal regions. We did not find evidence that the retroviral insertions used to introduce the pluripotency factors in ADS-iPSCs was associated with the altered reprogramming of DNA methylation (Supplementary Fig. 16 and Supplementary Table 6).
Figure 5. Failure to restore megabase-scale regions of non-CG methylation is a hallmark of iPSC reprogramming.
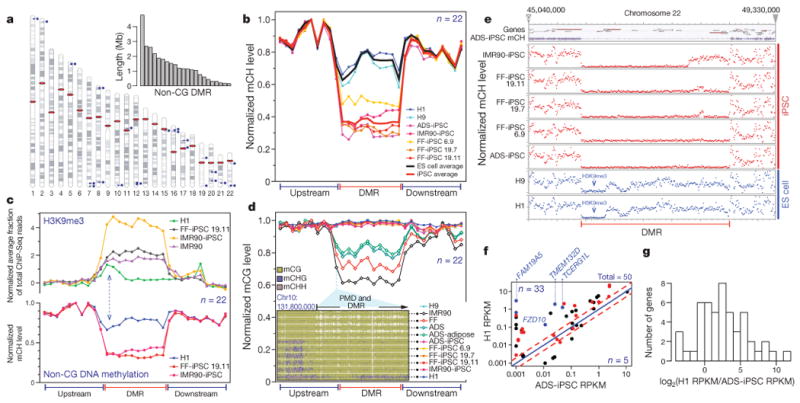
a, Chromosome ideograms and length distribution (inset) of the 22 ADS-iPSC non-CG mega-DMRs. Blue circles and lines indicate location of individual DMRs. Red ellipses indicate the location of centromeres. b, Normalized mCH levels over all non-CG mega-DMRs and flanking genomic regions. c, Lower _y_-axis as in b for the cell lines indicated. Upper _y_-axis shows normalized H3K9me3 ChIP-Seq read density throughout the non-CG mega-DMRs and flanking genomic regions. Dashed blue arrows indicate the inverse relationship between mCH and H3K9me3. d, Plot shows normalized mCG levels over the non-CG mega-DMRs and flanking genomic regions. Inset is a data browser representation of DNA methylation where vertical bar height indicates mC level at the 5′ of a non-CG mega-DMR and PMD. e, Normalized mCH levels over a non-CG mega-DMR on chromosome 22 and flanking regions. Top panel shows gene models and ADS-iPSC mCH. f, Comparison of transcript abundance between H1 and ADS-iPSC. Each dot represents a RefSeq gene within the 22 non-CG mega-DMRs. Red dots indicate genes that have a CG-DMR within 2 kb of the transcriptional start site. Blue dots indicate genes that have a CG-DMR within 2 kb of the transcriptional start site, are hypermethylated in all iPSC lines and are associated with loss of H3K27me3. Red dashed lines represent twofold difference. g, The number of genes with a given transcript abundance ratio between H1 and ADS-iPSCs for all RefSeq genes within the non-CG mega-DMRs.
Profiling non-CG DNA methylation levels throughout the 22 ADS-iPSC hypomethylated mega-DMRs for each ES cell and iPSC line, we found that depletion of non-CG methylation was a common feature of the independent iPSC lines (Fig. 5b, Supplementary Figs 1b, 17 and Supplementary Table 4). We proposed that the localized failure to restore non-CG methylation in these large regions could be mechanistically linked to the presence of particular covalent histone modifications that impart a regional chromatin conformation that is refractive to remethylation at CH sites during reprogramming. Indeed, we identified significant regional enrichment of trimethylation of histone H3 lysine 9 (H3K9me3) in two iPSC lines25 that was spatially concordant with the non-CG mega-DMRs, and absent in H1 ES cells (Fig. 5c). The IMR90 genome also showed enrichment of H3K9me3 highly spatially correlated with the non-CG mega-DMRs. Additionally, we found that the non-CG mega-DMRs tend to be partially methylated in the CG context in non-pluripotent cells (99.5% of non-CG mega-DMR bases are partially methylated in ADS cells; Fig. 5d). Taken together, these data indicate that specific large regions of somatic cell genomes proximal to centromeres and telomeres that are in the partially methylated mCG state, and that bear the heterochromatin modification H3K9me3, may often be resistant to complete reprogramming of non-CG methylation to the embryonic state, remaining in a somatic configuration after induction of pluripotency (exemplified for one DMR in Fig. 5e).
To determine if the non-CG mega-DMRs affected disruption of transcriptional activity, we compared the transcript abundance between ADS-iPSCs and H1 ES cells of genes located within these regions (Fig. 5f). Of the 50 RefSeq genes within the non-CG mega-DMRs, 33 showed ≥ 2-fold lower transcript abundance in ADS-iPSCs compared to H1 ES cells (Supplementary Table 7). This indicates that non-CG mega-DMRs are associated with transcriptional disruption in the iPSCs (Fig. 5g). Notably, 10 of the 11 iDMRs that were consistently hypermethylated in every iPSC line (Fig. 4a, b) were located within the non-CG mega-DMRs (P = 8.5 × 10−39), but this was not true of any of the common hypomethylated CG-DMRs. Further, 9 of these 10 consistently hypermethylated iDMRs located in non-CG mega-DMRs were transmitted to the trophoblast cells derived from the FF-iPSC 19.11 line. Lastly, 64% of genes with lower transcript abundance in ADS-iPSCs in non-CG mega-DMRs also showed dense CG hypermethylation at the transcriptional start site (Fig. 5f, red circles), a subset of which were consistently hypermethylated at the transcriptional start site in all iPSC lines analysed and associated with aberrant loss of H3K27me3 (Fig. 5f, blue circles, Fig. 4b) providing potential molecular markers for determination of complete reprogramming in iPSC lines. Several of these suppressed genes showing transcriptional start site CG hypermethylation encode proteins that may be pertinent to neural processes: TMEM132D26, FAM19A527, TCERG1L28 and FZD10. Notably, TCERG1L and FAM19A5 were reported to be consistently expressed significantly higher in ES cells compared to iPSCs29 (J.A.T., personal communication).
Concluding remarks
Through generation of the first unbiased, whole-genome, single-base-resolution DNA methylomes for a variety of human iPSCs and ES cells we have gained several new insights into the epigenomic reprogramming process. Reprogramming induces a remarkable reconfiguration of the DNA methylation patterns throughout the somatic cell genome, returning PMDs to a fully methylated state, reinstating non-CG methylation, and reprogramming most unmethylated and methylated CG islands to an ES-cell-like state. Overall, this process generates an iPSC methylome that, in general, is very similar to that of ES cells.
On closer inspection we identified numerous differences in DNA methylation between ES cells and iPSCs. In terms of mCG, reprogramming generated hundreds of differentially methylated regions, most associated with CG islands and genes, and seeming to represent both memory of the somatic cell DNA methylation patterns as well as iPSC-specific DNA methylation patterns. Notably, many of the CG-DMRs were shared between independent iPSC lines, indicating that these loci are inherently susceptible to aberrant methylation in the reprogramming process. Further, the presence of unique CG-DMRs in each iPSC line indicates that in addition to the aforementioned susceptible regions, there may be a stochastic element to reprogramming that results in interclone variability. Lastly, both somatic memory and iDMRs can be transmitted at high frequency through differentiation.
We also identified megabase-scale genomic regions that were repeatedly resistant to reprogramming of non-CG methylation, and were associated with altered H3K9me3 and transcriptional activity, constituting phenotypic differences at the transcriptional level that could have downstream consequences for iPSC or derived somatic cell function. The close proximity of the non-CG mega-DMRs to centromeres and telomeres indicates that there could be distinct molecular properties of these chromosomal regions—for example particular histone variants—which impede the reprogramming process. Together, the non-CG mega-DMRs, common CG-DMRs in all iPSC lines, transmitted CG-DMRs and differentially expressed genes are potentially useful as diagnostic markers for incomplete iPSC reprogramming, characterization of the efficacy of different reprogramming techniques, and potential propagation of altered methylation states into derivative differentiated cells. From these first comprehensive whole-genome, base-resolution methylome maps it seems clear that iPSCs are fundamentally distinct from ES cells, insofar as they manifest common, quantifiable epigenomic differences. Continued study of a wide variety of ES cells is needed to understand the full range of epigenomic variability, and to potentially identify factors that enable complete reprogramming to occur.
Methods Summary
Biological materials and sequencing libraries
Strand-specific mRNA-Seq libraries were produced as described previously18. MethylC-Seq libraries were generated by ligation of methylated sequencing adapters to fragmented genomic DNA followed by purification, sodium bisulphite conversion and 4–8 cycles of polymerase chain reaction (PCR) amplification as described previously18 with minor modifications (see Supplementary Materials). ChIP-Seq libraries were prepared following Illumina protocols with minor modifications (see Supplementary Materials). Sequencing was performed using the Illumina Genome Analyser IIx and HiSeq2000 instruments as per the manufacturer's instructions.
Read processing and alignment
MethylC-Seq sequencing data was processed using the Illumina analysis pipeline and FastQ format reads were aligned to the human reference genome (hg18) using the Bowtie algorithm30 as described previously18 with minor modifications (see Supplementary Materials). mRNA-Seq reads were uniquely aligned to the human reference (hg18) and quantified using the TopHat31 and Cufflinks32 algorithms. Base calling and mapping of Chip-Seq reads was performed using the Illumina analysis pipeline.
Methods
Cell culture
ADS cells were obtained from Invitrogen (catalogue no. R7788110) and cultured under recommended conditions. ADS cells were grown in 10-cm2 dishes (5,000 cells cm−2). For making iPSCs, ADS cells (3,000 cm−2) were plated in six-well plates. The cells were infected with the combination of human reprogramming retroviruses (MYC, KLF4, OCT4, or SOX2 in pMXs; Addgene) that had been produced in 293T cells co-transfected with gag/pol and VSV-Gas described earlier. On day 5, cells were passed onto 6-cm dishes without MEFs. Cells were cultured in DMEM/F12 plus 20% knockout serum replacement (KSR) medium supplemented with β-mercaptoethanol (0.1%), non-essential amino acids (NEAA) (1×), Glutamax (1%), and 10 ng ml−1 FGF2. Medium was changed every day. On days 18–28, individual colonies were picked and cultured feeder-free in defined mTeSR1 medium on plates coated with Matrigel (BD Biosciences). The profiled ADS-iPSC clone was assayed for pluripotency by analysis of the transcript abundance of pluripotency markers, and in vitro and in vivo (teratoma) differentiation into three germ layers, as described previously19. For differentiation from ADS cells to mature adipocytes in vitro, ADS cells (10,000 cm−2) were plated on 10-cm2 dishes with growth media. Differentiation was induced for 14 days using medium consisting of DMEM/F12, 10% KSR, and an adipogenic cocktail (0.5 mM IBMX, 0.25 μM dexamethasone, 1 μg ml−1 insulin, 0.2 mM indomethacin and 1 μM pioglitazone). For collecting mature adipocytes, the cells were detached with trypsin, then neutralized. After centrifuging detached cells, floated fat cells were transferred into new tubes. H9 cells were passage 42 including several passages in mTeSR1. IMR90-iPSCs were derived by lentiviral integration as reported previously5, and were passage 65, with 33 passages in mTeSR1. FF-iPSC lines were derived using non-integrating episomal vectors as described previously7. FF-iPSC 19.7 (DF19-9-7) and FF-iPSC 19.11 (DF19-9-11) cells were subclones isolated from a single reprogrammed iPSC line (DF19-9), and were cultured independently for at least 20 passages. Before cell harvest aliquots of cells were assayed for OCT4 expression by flow cytometry as described previously33,34. Cells were also submitted to the WiCell Cytogenetics Laboratory to confirm normal karyotype. For BMP4 differentiation, H1 or FF-iPSC 19.11 cells were grown in 10-cm2 dishes (approximately 1 × 10⁷ cells per dish) in feeder-free conditions on Matrigel using mTeSR1 media containing 50 ng ml−1 BMP4 for 5 days (RND systems).
MethylC-Seq library generation
Five micrograms of genomic DNA was extracted from frozen cell pellets using the DNeasy Mini Kit (Qiagen) and spiked with 25 ng unmethylated Lambda _c_l857 Sam7 DNA (Promega). The DNA was fragmented with a Covaris S2 (Covaris) to 75–175 bp or 100–400 bp for single-read or paired-read libraries, respectively, followed by end repair and addition of a 39 A base. Cytosine-methylated adapters provided by Illumina were ligated to the sonicated DNA as per the manufacturer's instructions for genomic DNA library construction. For single-read libraries, adaptor-ligated DNA was isolated by two rounds of purification with AMPure XP beads (Beckman Coulter Genomics). For paired-read libraries, adaptor-ligated DNA of 275–375 bp (150–250 bp insert) was isolated by 2% agarose gel electrophoresis. Adaptor-ligated DNA (≤450 ng) was subjected to sodium bisulphite conversion using the MethylCode kit (Life Technologies) as per the manufacturer's instructions. The bisulphite-converted, adaptor-ligated DNA molecules were enriched by 4–8 cycles of PCR with the following reaction composition: 2.5 U of uracil-insensitive PfuTurboCx Hotstart DNA polymerase (Stratagene), 5 μl 10× PfuTurbo reaction buffer, 31 μM dNTPs, 1 μl Primer 1, 1 μl Primer 2 (50 μl final). The thermocycling parameters were: 95 °C for 2 min, 98 °C for 30 s, then 4–8 cycles of 98 °C for 15 s, 60 °C for 30 s and 72 °C for 4 min, ending with one 72 °C for 10 min step. The reaction products were purified using AMPure XP beads. Up to two separate PCR reactions were performed on subsets of the adaptor-ligated, bisulphite-converted DNA, yielding up to two independent libraries from the same biological sample. Final sequence coverage was obtained by sequencing all libraries for a sample separately, thus reducing the incidence of ‘clonal’ reads that share the same alignment position and probably originate from the same template molecule in each PCR. The sodium bisulphite non-conversion rate was calculated as the percentage of cytosines sequenced at cytosine reference positions in the Lambda genome.
Directional RNA-Seq library generation
Total RNA was isolated from cell pellets treated with RNAlater using the RNA mini kit (Qiagen) and treated with DNaseI (Qiagen) for 30 min at room temperature (22 °C). After ethanol precipitation, biotinylated LNA oligonucleotide ribosomal RNA (rRNA) probes complementary to the 5S, 5.8S, 12S, 18S and 28S rRNAs were used to deplete the rRNA from 5 μg of total RNA by RiboMinus (Life Technologies) as per the manufacturer's instructions. Purified RNA (50 ng) was fragmented by metal hydrolysis in 1× fragmentation buffer (Life Technologies) for 15 min at 70 °C, stopping the reaction by addition of 2 ml fragmentation stop solution (Life Technologies). Fragmented RNA was used to generate strand-specific RNA-Seq libraries as per the Directional mRNA-Seq Library Preparation Protocol (Illumina).
Chromatin immunoprecipitation and ChIP-Seq library generartion
Chromatin immunoprecipitation (ChIP) and Illumina sequencing for H3K9me2 and H3K27me3 was performed as described previously25.
Mapping retroviral insertion sites
MMLV retroviral insertion sites in ADS-iPSC genomic DNA were identified by an adaptor ligation-mediated method for genome-wide mapping of insertions, as described previously35, except with the following modifications. Genomic DNA was fragmented by sonication with a Covaris S2, followed by ligation of modified 5′ or 3′ long terminal repeat (LTR)-specific Illumina adapters: 5′-LTR (5′-3′): CAAGCAGAAGACGGCATACGAG ATCGGTCTCGGCATTCCTGCTGAACCGCTCTTCCGATCTTCAGTGCAG CTGTTCCATCTGTTCTTGGCCC; 3′-LTR (5′-3′): CAAGCAGAAGACGG CATACGAGATCGGTCTCGGCATTCCTGCTGAACCGCTCTTCCGATCTT CAGTGGCCAGTCCTCCGATTGACTGAGTCG. A single mapping library was made for each of the 5′ and 3′ LTRs, and each library was sequenced on the Illumina Genome Analyser IIx. Each valid read contained the barcode sequence ‘TCAGTG’ prepended to the 5′ of the genomic DNA read sequence. Retroviral insertion sites were identified by localized enrichment of greater than 300 reads within a 2-kb window, in both the 5′ LTR and 3′ LTR mapping libraries, and located on opposite genome strands between the two libraries. Cloning and Sanger sequencing of library molecules from the 3′ LTR mapping library confirmed genomic DNA retroviral insertion sites for a representative fraction of the 17 insertion sites identified by high-throughput sequencing.
High-throughput sequencing
Single-read MethylC-Seq and RNA-Seq libraries were sequenced for up to 85 cycles using the Illumina Genome Analyser IIx. Paired-read MethylC-Seq libraries were sequenced for up to 75 cycles for each read using the Illumina HiSeq2000. Image analysis and base calling were performed with the standard Illumina pipeline, performing automated matrix and phasing calculations on a control library that was sequenced in a single lane of each flowcell.
Processing and alignment of MethylC-Seq data to identify methylated cytosines
All sequence alignments were performed against the NCBI36/hg18 human reference. Single-read MethylC-Seq sequences were processed and aligned as described previously18, except an additional filter was added to remove any mapped reads in which a read-C base was aligned to a reference-T base. Paired-read MethylC-Seq data was mapped and processed as described previously18 with the following modifications to accommodate the paired-read data-type. Both reads in a pair were trimmed of any low-quality sequence at their 3′ ends and mapped to the reference genome with Bowtie v. 0.12.530 in paired-read mode, using the following parameters: -e 90 -l 20 -n 0 -k 10 -o 4 -I 0 -X 550 -pairtries 100 -nomaqround -solexa1.3-quals. Mapped reads in a read pair that overlapped were trimmed from their respective 3′ ends until the reads no longer overlapped, leaving a 1-bp gap.
Mapped reads were filtered as follows: any read with more than three mismatches was trimmed from the 3′ end to contain three mismatches, any read pair that contained a cytosine mapped to a reference sequence thymine was removed, and any read pairs that had more than three cytosines in the non-CG context within a single read was removed (possible non-conversion in bisulphite reaction). Read pairs were then collapsed to remove clonal reads potentially produced in the PCR amplification from the same template molecule, based on a common start position of read 1. The total uniquely mapped, non-clonal read number for each library, average coverage and total sequence yield are detailed in Supplementary Table 1.
For all MethylC-Seq data sets, methylated cytosines were identified from the mapped and processed read data as described previously18. The bisulphite conversion rates for all samples were over 99% (Supplementary Table 1). Correction of any DNA methylation sites incorrectly categorized as non-CG owing to SNPs in the sample versus reference genomes was performed as described previously18.
For the previously published HSF123 and H9-Laurent24 data sets, the GEO sequence read data were mapped using the MethylC-Seq pipeline (H9-Laurent) and BS Seeker (HSF1)36 (settings: -e ≤ 55, -m 3), and post-processing and methylcytosine identification was performed using MethylC-Seq pipeline as described earlier.
Genome annotation
Genomic regions and CG islands were defined based on NCBI build 36/hg18 coordinates downloaded from the UCSC website. Promoters were arbitrarily defined as transcriptional start site ± 500 bp or 2,000 bp for each Ref Seq transcript (as indicated in the text). According to the UCSC annotation many Ref Seq transcripts can be associated with a given gene, and they can have the same or alternative transcriptional start site. Gene bodies are defined as the transcribed regions, from the start to the end of transcription sites for each Ref Seq.
mC and histone profiles
In Fig. 3a each CG-DMR was divided into 20 equally sized bins. The average methylation for all cytosines in the CG context within a bin in one sample was determined and normalized by the bin size. Lastly, the whole data set was divided by its 70th percentile, and values higher then 1 were forced to 1. This was performed to produce a meaningful mapping between values and colours in the heatmap key, and to avoid extreme values masking the methylation levels of other CG-DMRs. CG-DMRs were then reorganized based on their similarity by means of complete linkage hierarchical clustering, using the heatmap.2 R function.
In Fig. 4a each of the 11 CG-DMRs consistently hypermethylated in the 5 iPSC lines was profiled for both mCG and the H3K27me3 histone mark throughout the CG-DMR and equivalent upstream and downstream genomic regions divided into 30 equal-length bins. For DNA methylation, for each bin in each sample the total number of methylated/(methylated+unmethylated) reads was determined over the whole set of considered CG-DMRs. Final profiles were normalized by dividing them by their maximum value. For the H3K27me3 histone modification ChIP-Seq reads, RPKM values were determined in each CG-DMR and normalized to the average of the upstream/downstream flanking region RPKM values.
Figure 5b is as in Fig. 4a lower axis, but based on the mC in the CH sequence context profiled over the non-CG mega-DMRs and upstream/downstream flanking regions, minus the non-conversion frequency. The final profiles were normalized to their maximum level.
Figure 5c is as in Fig. 4a lower axis, but based on the mC in the CH sequence context profiled over non-CG mega-DMRs and upstream/downstream flanking regions minus the non-conversion frequency. In the upper axis the H3K9me3 histone modification ChIP-Seq reads were profiled as described for the H3K27me3 profiles in Fig. 4a.
Figure 5d is as in Fig. 4a lower axis, but based on the mC on the mCG sequence context profiled over non-CG mega-DMRs and upstream/downstream flanking regions. Profiles were normalized to their maximum levels.
Figure 5e is as in Fig. 4a lower axis for one example non-CG mega-DMR using 10-kb bins.
Clustering of mC profiles and chromosome 10 smoothed profiles
The methylation level for each C in the CG, CHG and CHH sequence context was summed in adjacent 10-kb windows over all autosomal chromosomes. Non-CG DNA methylation profiles were determined by adding mCHG and mCHH profiles. Clustering was performed based on the Pearson correlation over all 10-kb windows transformed into a distance measure (as 1 – Pearson correlation) and using the hclust R function. Data for smoothing of non-CG mC on chromosome 10 were retrieved as for the clustering. In addition, smoothing with cubic splines was determined before plotting using the smooth. spline R function with spar argument set to 0.3.
Identification of DMRs
Non-CG mega-DMRs (Fig. 5) were identified by comparing H1 to ADS-iPSC mCHG and mCHH smoothed methylation profiles. The average methylation level of mC called (1% FDR) in the mCHG and mCHH sequence context was determined in 5-kb windows (sW). The genome was scanned considering groups of 10 adjacent windows sW over a distance less than 50 kb. The set of 10 smoothed values for mCHG in the H1 sample was compared to the set of set of 10 smoothed values in the ADS-iPSC sample using the Wilcoxon test. For both sets, at least 4 non-missing data points (that is, with sequence coverage) were required. Resulting P values were corrected with the Benjamini-Hochberg method. Regions with P value < 0.01 (1% FDR) and 8-fold enrichment of methylation level were identified, and regions closer than 100 bp were joined. This was repeated for the mC in the CHH sequence context. Lastly, mCHG and mCHH DMRs overlapping or closer than 100 kb were joined and the final set of regions was checked for having mCHG+mCHH fold enrichment of at least 2-fold between H1 and ADS-iPSCs. This set of 78 DMRs hypomethylated in ADS-iPSCs (Supplementary Fig. 15c–f) was further refined, considering the size and overlap with repressive histone marks. The final set of 22 regions reported in Fig. 5 includes all the DMRs larger than 1 Mb (17) and a range of smaller ones. Also, the 22 final non-CG mega-DMRs encompass ∼92% of the initial set of 78 DMRs, based on size in bp.
CG-DMRs (Fig. 3) were identified similarly to non-CG mega-DMRs. Smoothed average methylation level was performed in 100-bp windows sW, and regions comprising a set of 10 adjacent windows sW over a distance less than 1,100 bp were considered. The Kruskall–Wallis test was used to score each region based on the methylation levels from the two ES cell and five iPSC lines. Regions with corrected P value, < 0.01 (1% FDR) and 4-fold enrichment of methylation level (max/min over the 7 cell lines for each region) were identified, and regions closer than 100 bp were joined, resulting in a final set of 1,175 CG-DMRs. Regarding the H1 versus H9 comparison, the non parametric Wilcoxon test was applied: at 1% FDR and minimum 4-fold enrichment no CG-DMRs could be identified, while only at 10% FDR and 4-fold enrichment could H1 versus H9 CG-DMRs be identified. This 10% FDR set has an overlap of 131 kb with the final set of 1,175 CG-DMRs. For these reasons the set of DMRs that visually appear different between H1 and H9 in the Fig. 3 heatmap are either above the 1% FDR threshold (H1 versus H9) or with insufficient sequence coverage in one of the two samples. (Regions without sequence coverage are not indicated in the heatmap, but are considered in the DMR selection. White spots in the heatmap are indicative of missing mCG; this can be due to either lack of sequence coverage or sufficient coverage and absence of mCG.) These regions are included in the list of the 1,175 CG-DRMs at the 1% FDR level based on inclusion of the iPSC data.
For the analysis of CG island reprogramming, the CG-DMRs were identified as for the Fig. 3 CG-DMRs (minimum enrichment 2-fold) but including the IMR90, ADS-adipose, ADS and FF differentiated cell lines in addition to the two ES cell and the five iPSC lines.
CG island reprogramming analysis was carried out as follows. CG-DMRs different between ES cells and differentiated cells were defined within the set of CG-DMRs identified comparing all analysed methylomes (see earlier), considering only CG-DMRs overlapping with CG islands. In particular, for each of these CG-DMR the mCG/bp levels in 20 equally sized bins was profiled in all cell types. DMRs with pooled mCG/bp levels different from differentiated and ES cell lines were identified (Wilcoxon test P value, < 0.01, and _P_ value. > 0.05 between H1 and H9). Similarly, the set of reprogrammed CG-DMRs was identified by comparing pooled iPSC mCG profiles with the ES cell samples (Wilcoxon test P value. > 0.05).
CG-DMR reprogramming analysis was carried out as follows. CG-DMRs aberrant in iPSCs and like or unlike parental cells were defined within the set of 1,175 CG-DMRs identified comparing all ES cell and iPSC samples. In particular, for each of these CG-DMR the mCG/bp levels in 20 equally sized bins was profiled in all cell types. CG-DMRs aberrant in each iPSC line were identified comparing their mCG/bp to both H1 and H9 ES cell lines (two-tailed Wilcoxon test P value < 0.05 for both, and _P_ value. > 0.01 between H1 and H9). Hypermethylated and hypomethylated CG-DMRs were identified in the same way but using a one-tailed test. Memory and iPSC-specific (iDMR) CG-DMRs were identified comparing the mCG/bp density between each iPSC and its parental line (Wilcoxon test P value > 0.01 and P value < 0.01, respectively).
Maintained CG-DMRs were identified in the FF 19.11 iPSC line comparing the mCG/bp density of H1+BMP4 with both H1 and H9 (one-tailed Wilcoxon test P value > 0.01 for both) and FF 19.11 BMP4 to both H1 and H9 (one-tailed Wilcoxon test P value < 0.05 for both).
Identification of PMDs
A sliding window approach was used to find regions of the genome that were partially methylated in each cell type, as described previously18.
Mapping RNA-Seq reads
RNA-Seq read sequences produced by the Illumina analysis pipeline were aligned with the TopHat software31 to the NCBI build 36/hg18 reference sequence. Reads that aligned to multiple positions were discarded. Reads per kilobase of transcript per million reads (RPKM) values were calculated with the Cufflinks software32 using human RefSeq gene models.
Mapping and enrichment analysis of ChIP-Seq reads
Following sequencing cluster imaging, base calling and mapping were conducted using the Illumina pipeline. Clonal reads were removed from the total mapped tags, retaining only the non-clonal unique tags that mapped to one location in the genome, where each sequence is represented once. Regions of tag enrichment were identified as described previously25.
Data visualization in the AnnoJ browser
MethylC-Seq, RNA-Seq and ChIP-Seq sequencing reads and positions of methylcytosines with respect to the NCBI build 36/hg18 reference sequence, gene models and functional genomic elements were visualized in the AnnoJ 2.0 browser, as described previously37. The data mentioned above can be viewed in the AnnoJ browser at http://neomorph.salk.edu/ips_methylomes.
Supplementary Material
nature09798-s1
nature09798-s2
Acknowledgments
We thank L. Zhang and G. Schroth for assistance with MethylC-Seq library sequencing. R.L. is supported by a California Institute for Regenerative Medicine Training Grant. M.P. is supported by a Catharina Foundation postdoctoral fellowship. R.D.H. is supported by an American Cancer Society Postdoctoral Fellowship. Y.K. is supported by the Japan Society for the Promotion of Science. This work was supported by grants from the following: Mary K. Chapman Foundation, the National Science Foundation (NSF) (NSF 0726408), the National Institutes of Health (NIH) (U01 ES017166, U01 1U01ES017166-01, DK062434), the California Institute for Regenerative Medicine (RB2-01530), the Morgridge Institute for Research and the Howard Hughes Medical Institute. We thank the NIH Roadmap Reference Epigenome Consortium (http://www.roadmapepigenomics.org/). This study was carried out as part of the NIH Roadmap Epigenomics Program.
Footnotes
Author Contributions Experiments were designed by R.L., J.R.E., R.M.E., B.R., J.A.T., Y.S.K., R.Y., M.D. and R.D.H. Cells were grown by J.A.-B. and Y.S.K. MethylC-Seq and RNA-Seq experiments were conducted by R.L. and J.R.N. ChIP-Seq experiments were conducted by R.D.H. ChIP-Seq data analysis was performed by G.H., S.K. and R.D.H. Retroviral insertion site localization experiments were performed by R.O'M. and R.C. Sequencing data processing was performed by R.L. and G.H. Bioinformatic and statistical analyses were conducted by M.P., R.L. and G.H. R.S. performed data interpretation analyses. The manuscript was prepared by R.L., M.P. and J.R.E.
Author Information Analysed datasets can be browsed and downloaded from http://neomorph.salk.edu/ips_methylomes. Sequence data for MethylC-Seq, RNA-Seq and Chip-Seq experiments have been submitted to the NCBI SRA database under the accession numbers SRA023829.2 and SRP000941.
The authors declare no competing financial interests.
Readers are welcome to comment on the online version of this article at www.nature.com/nature.
References
- 1.Soldner F, et al. Parkinson's disease patient-derived induced pluripotent stem cells free of viral reprogramming factors. Cell. 2009;136:964–977. doi: 10.1016/j.cell.2009.02.013. [DOI] [PMC free article] [PubMed] [Google Scholar]
- 2.Yamanaka S. A fresh look at iPS cells. Cell. 2009;137:13–17. doi: 10.1016/j.cell.2009.03.034. [DOI] [PubMed] [Google Scholar]
- 3.Takahashi K, Yamanaka S. Induction of pluripotent stem cells from mouse embryonic and adult fibroblast cultures by defined factors. Cell. 2006;126:663–676. doi: 10.1016/j.cell.2006.07.024. [DOI] [PubMed] [Google Scholar]
- 4.Takahashi K, et al. Induction of pluripotent stem cells from adult human fibroblasts by defined factors. Cell. 2007;131:861–872. doi: 10.1016/j.cell.2007.11.019. [DOI] [PubMed] [Google Scholar]
- 5.Yu J, et al. Induced pluripotent stem cell lines derived from human somatic cells. Science. 2007;318:1917–1920. doi: 10.1126/science.1151526. [DOI] [PubMed] [Google Scholar]
- 6.Park I, et al. Reprogramming of human somatic cells to pluripotency with defined factors. Nature. 2008;451:141–146. doi: 10.1038/nature06534. [DOI] [PubMed] [Google Scholar]
- 7.Yu J, et al. Human induced pluripotent stem cells free of vector and transgene sequences. Science. 2009;324:797–801. doi: 10.1126/science.1172482. [DOI] [PMC free article] [PubMed] [Google Scholar]
- 8.Zhao XY, et al. iPS cells produce viable mice through tetraploid complementation. Nature. 2009;461:86–90. doi: 10.1038/nature08267. [DOI] [PubMed] [Google Scholar]
- 9.Boland MJ, et al. Adult mice generated from induced pluripotent stem cells. Nature. 2009;461:91–94. doi: 10.1038/nature08310. [DOI] [PubMed] [Google Scholar]
- 10.Guenther MG, et al. Chromatin structure and gene expression programs of human embryonic and induced pluripotent stem cells. Cell Stem Cell. 2010;7:249–257. doi: 10.1016/j.stem.2010.06.015. [DOI] [PMC free article] [PubMed] [Google Scholar]
- 11.Deng J, et al. Targeted bisulfite sequencing reveals changes in DNA methylation associated with nuclear reprogramming. Nature Biotechnol. 2009;27:353–360. doi: 10.1038/nbt.1530. [DOI] [PMC free article] [PubMed] [Google Scholar]
- 12.Doi A, et al. Differential methylation of tissue- and cancer-specific CpG island shores distinguishes human induced pluripotent stem cells, embryonic stem cells and fibroblasts. Nature Genet. 2009;41:1350–1353. doi: 10.1038/ng.471. [DOI] [PMC free article] [PubMed] [Google Scholar]
- 13.Kim K, et al. Epigenetic memory in induced pluripotent stem cells. Nature. 2010;467:285–290. doi: 10.1038/nature09342. [DOI] [PMC free article] [PubMed] [Google Scholar]
- 14.Polo JM, et al. Cell type of origin influences the molecular and functional properties of mouse induced pluripotent stem cells. Nature Biotechnol. 2010;28:848–855. doi: 10.1038/nbt.1667. [DOI] [PMC free article] [PubMed] [Google Scholar]
- 15.Stadtfeld M, et al. Aberrant silencing of imprinted genes on chromosome 12qF1 in mouse induced pluripotent stem cells. Nature. 2010;465:175–181. doi: 10.1038/nature09017. [DOI] [PMC free article] [PubMed] [Google Scholar]
- 16.Miura K, et al. Variation in the safety of induced pluripotent stem cell lines. Nature Biotechnol. 2009;27:743–745. doi: 10.1038/nbt.1554. [DOI] [PubMed] [Google Scholar]
- 17.Hu BY, et al. Neural differentiation of human induced pluripotent stem cells follows developmental principles but with variable potency. Proc Natl Acad Sci USA. 2010;107:4335–4340. doi: 10.1073/pnas.0910012107. [DOI] [PMC free article] [PubMed] [Google Scholar]
- 18.Lister R, et al. Human DNA methylomes at base resolution show widespread epigenomic differences. Nature. 2009;462:315–322. doi: 10.1038/nature08514. [DOI] [PMC free article] [PubMed] [Google Scholar]
- 19.Sugii S, et al. Human and mouse adipose-derived cells support feeder-independent induction of pluripotent stem cells. Proc Natl Acad Sci USA. 2010;108:3558–3563. doi: 10.1073/pnas.0910172106. [DOI] [PMC free article] [PubMed] [Google Scholar]
- 20.Daley G, et al. Broader implications of defining standards for the pluripotency of iPSCs. Cell Stem Cell. 2009;4:200–201. doi: 10.1016/j.stem.2009.02.009. [DOI] [PubMed] [Google Scholar]
- 21.Xu RH, et al. BMP4 initiates human embryonic stem cell differentiation to trophoblast. Nature Biotechnol. 2002;20:1261–1264. doi: 10.1038/nbt761. [DOI] [PubMed] [Google Scholar]
- 22.Cedar H, Bergman Y. Linking DNA methylation and histone modification: patterns and paradigms. Nature Rev Genet. 2009;10:295–304. doi: 10.1038/nrg2540. [DOI] [PubMed] [Google Scholar]
- 23.Chodavarapu RK, et al. Relationship between nucleosome positioning and DNA methylation. Nature. 2010;466:388–392. doi: 10.1038/nature09147. [DOI] [PMC free article] [PubMed] [Google Scholar]
- 24.Laurent L, et al. Dynamic changes in the human methylome during differentiation. Genome Res. 2010;20:320–331. doi: 10.1101/gr.101907.109. [DOI] [PMC free article] [PubMed] [Google Scholar]
- 25.Hawkins RD, et al. Distinct epigenomic landscapes of pluripotent and lineage-committed human cells. Cell Stem Cell. 2010;6:479–491. doi: 10.1016/j.stem.2010.03.018. [DOI] [PMC free article] [PubMed] [Google Scholar]
- 26.Erhardt A, et al. TMEM132D, a new candidate for anxiety phenotypes: evidence from human and mouse studies. Mol Psychiatry advance online publication. 2010 April 6; doi: 10.1038/mp.2010.4. [DOI] [PubMed] [Google Scholar]
- 27.Yilmaz G, Alexander JS, Erkuran Yilmaz C, Granger DN. Induction of neuro-protective/regenerative genes in stem cells infiltrating post-ischemic brain tissue. Exp Transl Stroke Med. 2010;2:11. doi: 10.1186/2040-7378-2-11. [DOI] [PMC free article] [PubMed] [Google Scholar]
- 28.Li MZ, et al. Molecular mapping of developing dorsal horn-enriched genes by microarray and dorsal/ventral subtractive screening. Dev Biol. 2006;292:555–564. doi: 10.1016/j.ydbio.2006.01.033. [DOI] [PubMed] [Google Scholar]
- 29.Chin MH, et al. Induced pluripotent stem cells and embryonic stem cells are distinguished by gene expression signatures. Cell Stem Cell. 2009;5:111–123. doi: 10.1016/j.stem.2009.06.008. [DOI] [PMC free article] [PubMed] [Google Scholar]
- 30.Langmead B, Trapnell C, Pop M, Salzberg SL. Ultrafast and memory-efficient alignment of short DNA sequences to the human genome. Genome Biol. 2009;10:R25. doi: 10.1186/gb-2009-10-3-r25. [DOI] [PMC free article] [PubMed] [Google Scholar]
- 31.Trapnell C, Pachter L, Salzberg SL. TopHat: discovering splice junctions with RNA-Seq. Bioinformatics. 2009;25:1105–1111. doi: 10.1093/bioinformatics/btp120. [DOI] [PMC free article] [PubMed] [Google Scholar]
- 32.Trapnell C, et al. Transcript assembly and quantification by RNA-Seq reveals unannotated transcripts and isoform switching during cell differentiation. Nature Biotechnol. 2010;28:511–515. doi: 10.1038/nbt.1621. [DOI] [PMC free article] [PubMed] [Google Scholar]
- 33.Ludwig T, et al. Feeder-independent culture of human embryonic stem cells. Nature Methods. 2006;3:637–646. doi: 10.1038/nmeth902. [DOI] [PubMed] [Google Scholar]
- 34.Ludwig T, et al. Derivation of human embryonic stem cells in defined conditions. Nature Biotechnol. 2006;24:185–187. doi: 10.1038/nbt1177. [DOI] [PubMed] [Google Scholar]
- 35.O'Malley RC, Alonso JM, Kim CJ, Leisse TJ, Ecker JR. An adapter ligation-mediated PCR method for high-throughput mapping of T-DNA inserts in the Arabidopsis genome. Nature Protocols. 2007;2:2910–2917. doi: 10.1038/nprot.2007.425. [DOI] [PubMed] [Google Scholar]
- 36.Chen P, Cokus SJ, Pellegrini MBS. Seeker: precise mapping for bisulfite sequencing. BMC Bioinformatics. 2010;11:203. doi: 10.1186/1471-2105-11-203. [DOI] [PMC free article] [PubMed] [Google Scholar]
- 37.Lister R, et al. Highly integrated single-base resolution maps of the epigenome in Arabidopsis. Cell. 2008;133:523–536. doi: 10.1016/j.cell.2008.03.029. [DOI] [PMC free article] [PubMed] [Google Scholar]
Associated Data
This section collects any data citations, data availability statements, or supplementary materials included in this article.
Supplementary Materials
nature09798-s1
nature09798-s2