FragSeq: transcriptome-wide RNA structure probing using high-throughput sequencing (original) (raw)
. Author manuscript; available in PMC: 2011 Dec 28.
Published in final edited form as: Nat Methods. 2010 Nov 7;7(12):995–1001. doi: 10.1038/nmeth.1529
Abstract
Previous efforts to determine structures of non-coding RNA (ncRNA) probed only one RNA at a time with enzymes and chemicals, using gel electrophoresis to identify reactive positions. To accelerate RNA structure inference, we have developed FragSeq, a high-throughput RNA structure probing method that uses high-throughput RNA sequencing on fragments generated by nuclease P1, which specifically cleaves single stranded nucleic acids. In experiments probing the entire mouse nuclear transcriptome, we show that we can accurately and simultaneously map single-stranded regions (ssRNA) in multiple ncRNAs with known structure. We carried out probing in two cell types to demonstrate reproducibility. We also identified and experimentally validated structured regions in ncRNAs never previously probed.
Introduction
Many RNAs function as folded, structured molecules rather than as protein-encoding messengers. In fact, highly conserved, structured non-coding RNAs (ncRNAs) essential to basic cellular processes represent the majority of a cell's RNA. Such ncRNAs are responsible for translation, pre-mRNA splicing, histone mRNA maturation, guiding RNA modifications, and other essential cellular processes1. Recent genome-wide transcriptome analyses in multiple organisms indicate that many regions of the genome are transcribed into ncRNAs, leading to discoveries of low-abundance, functional RNAs that were previously missed2, 3. Several new classes have emerged in the last decade, such as microRNAs, large intergenic non-coding RNAs (lincRNAs), and promoter- or termini-associated short RNAs3-5. The functions of most of these ncRNAs remain undiscovered. Because many abundant ncRNAs function as folded structures, it is likely that some of these less abundant ncRNAs also fold to perform their cognate functions.
Determination of RNA structure is largely performed by biochemical experiments that probe one RNA sequence in solution. Chemical agents or nucleases that react with RNA bases depending on their structural context can help distinguish between bases that participate in base pairing and other stabilizing interactions versus bases that do not6. Recent advances in probing by selective 2′-hydroxyl acylation analyzed by primer extension (SHAPE)7 enable faster, higher-quality probing, but still focus on just one RNA sequence per experiment.
In contrast, computational structure prediction methods allow rapid, large-scale analyses of many RNA sequences. In addition to methods rooted in comparative sequence analysis, which require several RNA sequences with a conserved structure, there exist methods that predict structure from a single sequence and are useful for RNAs for which structural homologs are not known or that undergo lineage-specific structure changes and thus lack structure conservation. Such methods provide theoretical folds for a RNA sequence, usually using thermodynamic models8. While generally powerful, they often suffer from ambiguity since they can predict several different structures for a sequence, necessitating biochemical data to choose amongst candidate folds.
To draw on both the speed of computational methods and the quality of RNA probing experiments, we developed FragSeq (“fragmentation sequencing”), a method that uses a nuclease specific for single stranded RNA on a complex RNA mixture followed by high-throughput sequencing and bioinformatic analysis to deduce cut sites (phosphate backbone scissions). This analysis provides an “RNA accessibility profile,” akin to DNase hypersensitivity assays on chromatin9. We apply FragSeq to naked RNAs from the mouse nuclear transcriptome and deduce structure data for known and novel ncRNAs.
Results
FragSeq methodology
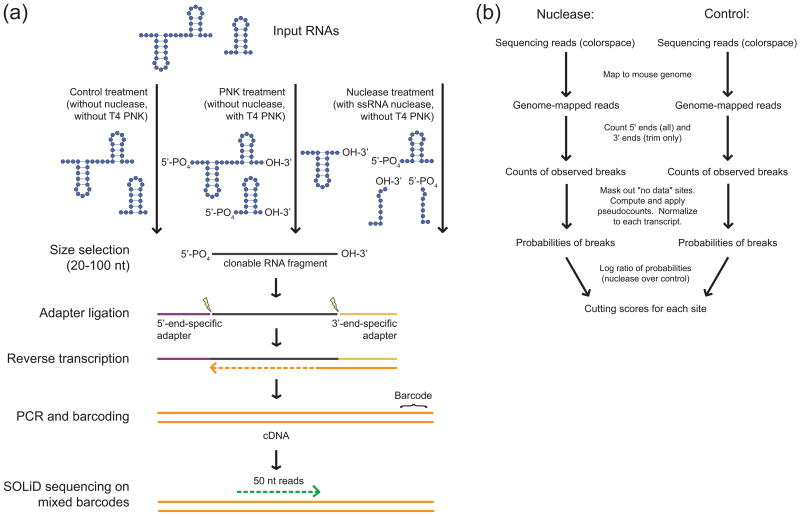
We chose nuclear RNA from undifferentiated mouse embryonic stem cells (UNDIFF) or cells differentiated into neural precursors (D5NP)10 to assess whether our method gave reproducible results for RNAs present in both samples. The nucleus contains many RNAs in the 70-300 nucleotide range; nuclease treatment yielded fragments in the 20-100 nucleotide range required for the high-throughput sequencing protocol used (Fig. 1a). To specifically clone RNA fragments derived from nuclease cuts and not those derived from random hydrolysis, we used endonuclease P1 (EC 3.1.30.1), which has preference for single-stranded DNA and RNA and yields 5′ monophosphate and 3′ OH products11. In our buffer conditions, P1 specifically cut single-stranded regions of well-characterized RNAs (U1a snRNA and 5S rRNA). Importantly, we tested whether addition of mouse total nuclear RNA to U1a or 5S rRNA in vitro transcripts would influence the pattern of digestion, implying trans interactions. When performing the reactions at dilute RNA concentrations, both RNAs had an identical pattern of digestion whether probed in homogenous or complex mixture (Supplementary Fig. 1).
Figure 1. Overview of the FragSeq method.
a, Preparation of FragSeq libraries for sequencing. RNA 5′ and 3′ end chemistry is specifically shown to highlight PNK and nuclease products; when RNA end chemistry is not shown, it denotes any possible end chemistry. Only clonable RNA fragments are shown at and after the size-selection step. Lightning bolts represent the specific ligation events at each end of the RNA fragment. b, Overview of the FragSeq algorithm.
We either gel-isolated intact nuclear RNAs of 20-100 nucleotides directly or first performed a limited P1 nuclease digestion before gel isolation. The control treatment without nuclease digestion allowed us to estimate the occurrence of fragments with an endogenous 5′ phosphate, as opposed to fragments with a 5′ phosphate produced by nuclease cleavage. Additionally, we treated an equal mass of input 20-100 nucleotide RNAs with polynucleotide kinase (“PNK” treatment) and ATP, catalyzing 5′ phosphorylation and 3′ cyclic phosphate removal12, which allowed us to examine endogenous breaks that do not leave a 5′ phosphate and 3′ OH. After gel isolation of these three parallel treatments, adapters were ligated directly to RNA fragments in a manner requiring both a 5′ phosphate and 3′ OH on each RNA, thus preserving orientation information for each fragment. After subsequent reverse transcription, the libraries were individually barcoded during PCR, pooled and sequenced using the ABI SOLiD3 platform, then mapped to the mouse genome using the ABI Small RNA Analysis Pipeline (http://solidsoftwaretools.com).
Sequencing summary statistics of the barcoded samples (Supplementary Table 1) show that we obtained ∼2.4 to ∼5.9 million genome-mapped reads per sample. The distribution of read mappings by annotation type (Supplementary Fig. 2) and the coverage of individual RNAs in nuclease versus control treatment (Supplementary Fig. 3) are consistent with our experimental design and show that we obtained good coverage of ncRNAs. Most known ncRNAs longer than 100 bases have higher coverage in the nuclease sample than in the control because their native form is too long to sequence and does not contain an endogenous 5′ phosphate; whereas a single nuclease cleavage creates the 5′ phosphate required for cloning and brings the RNA into sequencing size range (Supplementary Fig. 3). The exceptions are short C/D box snoRNAs, which tend to have native 5′ phosphates and fall within our sequencing size range; indeed, they occupy a greater fraction of read mappings in the control sample than in the nuclease or PNK samples, indicating we are correctly enriching for 5′ phosphate products.
The FragSeq algorithm (Fig. 1b) takes genome-mapped reads from the nuclease and control treatments, as well as a set of transcript coordinates, and outputs cutting scores for each site within each transcript. A “site” is the phosphate backbone between two adjacent bases where scissions can occur; a “cutting score” is a value (greater than zero) that reflects the preference of the nuclease for catalyzing scissions at that site relative to other sites in the same RNA. Briefly, the cutting score is the log ratio of probabilities of observing a break in the nuclease treatment versus the control treatment, after correcting for abundance differences and missing/low-valued data (see Supplementary Note 1 for the exact algorithm definition and Supplementary Note 2 for design rationale). Because P1 cuts 3′ of an unpaired base, a high cutting score at a site indicates that the upstream base is unlikely to be involved in base pairing or tertiary interactions13. These cutting scores form the basis of our subsequent analysis (see also Supplementary Discussion).
Cutting scores locate ssRNA in known ncRNA structures
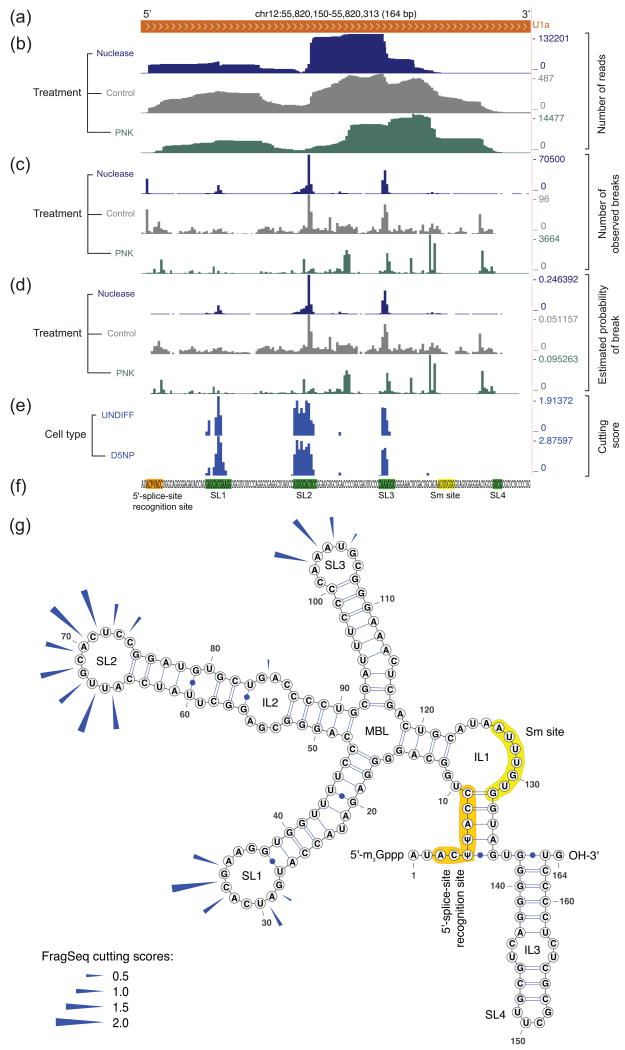
We show the flow of data through the algorithm, from genome-mapped reads to cutting scores, for the example RNA U1a (Fig. 2a-f), a highly abundant mouse homolog of spliceosomal snRNA U1. For each site along the transcript, we counted how many reads begin there, and how many trim reads (defined in Supplementary Notes 1 and 2) end there, summing them to get counts of observed breaks in each sample (Fig. 2c, Supplementary Fig. 4). We corrected these counts for missing data and normalized to get probabilities of observing breaks at each site in each RNA in each sample (Fig. 2d), which are used to compute cutting scores for each site (Fig. 2e).
Figure 2. Visual representation of data at progressive stages in the FragSeq algorithm, from genome-mapped reads to cutting scores.
a-e, Data tracks in the UCSC Genome Browser (mm9 mouse genome assembly) showing spliceosomal snRNA U1a (a); data from mouse undifferentiated embryonic stem cell samples (UNDIFF) (b-d) is processed to get cutting scores, which are compared to cutting scores from D5NP cells (e). Ignored sites (Supplementary Note 1) are denoted in (e) as areas for which no data is shown (e.g. the sequence GUG in the Sm region). f, Sequence of U1a, highlighting regions shown in (g) using the same color code; green and yellow subsequences are expected to be single-stranded. g, Cutting scores (blue arrows) from UNDIFF sample (e) superimposed on the known secondary structure. Non-canonical base pairs in interior loops of stem 2 are shown as unpaired. 2′-_O_-methylated positions are not depicted. SL, stem-loop; IL, interior loop; MBL, multibranch loop. U1a structure is from several sources (Supplementary Note 3).
High cutting scores tend to occur only in regions of single-stranded RNA (Figs. 2e-g, 3, 4a). Moreover, cutting scores obtained from UNDIFF versus D5NP cells correlate well (Fig. 2e) with Pearson correlation coefficients of 0.889, 0.813, and 0.817 for U1a, C/D box snoRNA U3b, and spliceosomal snRNA U5, respectively (Supplementary Fig. 5). This indicates that our method obtains similar structure data in biological samples with different transcriptional profiles.
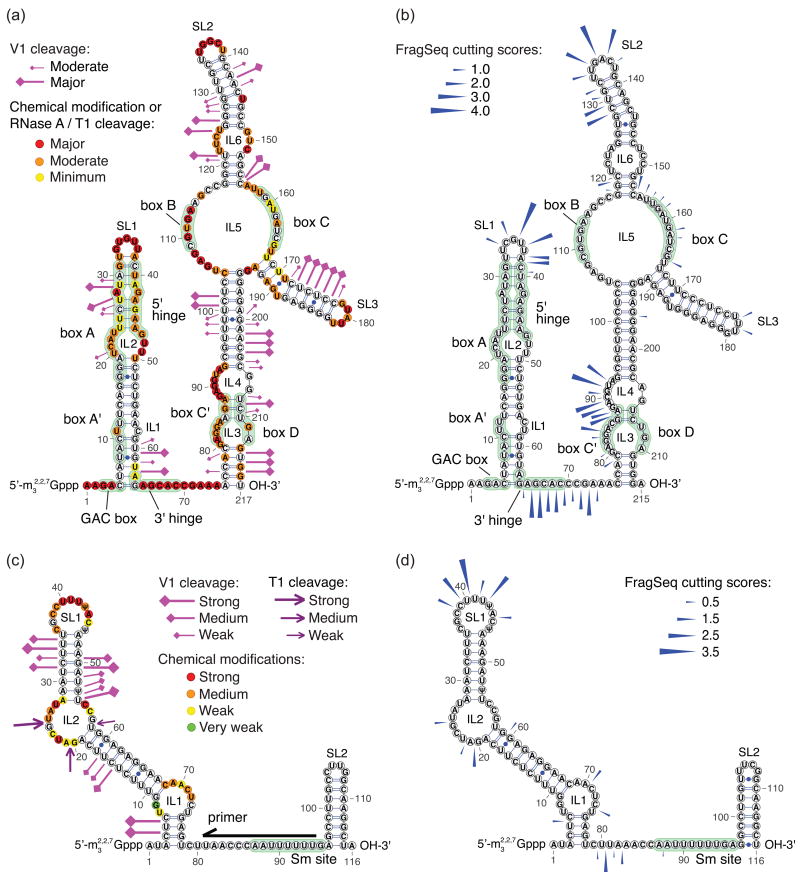
Figure 3. Comparison of FragSeq with previous probing experiments.
a-b, Probing results for human U3 purified from HeLa cells15 (a) and FragSeq cutting scores for mouse U3b (b). c-d, Probing results for human U5 purified from HeLa cells16 (c) and FragSeq cutting scores for mouse U5 (d). Black arrow shows priming position for primer extension; only bases downstream of the primer were probed in that study (c). Reactivities in (a) and (c) are taken verbatim from ref. 15 and ref. 16, respectively; structures and other annotations were compiled from multiple sources (Supplementary Note 3). 2′-_O_-methylated positions are not depicted.
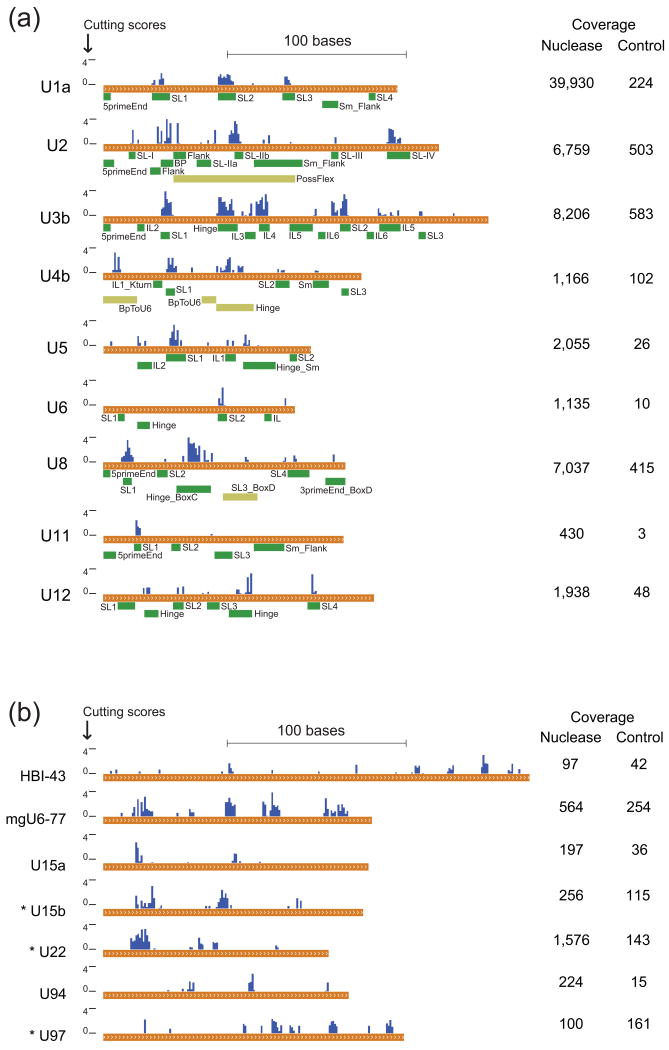
Figure 4. FragSeq cutting scores and coverage for ncRNAs with known structures and long C/D box snoRNAs.
Coverage (mean reads per nucleotide) is shown at right for nuclease and control treatments. a, Cutting scores compared to ssRNA regions greater than three bases long (green boxes) for ncRNAs with published structure models (Supplementary Note 3). Regions exist where the in vitro structure of a single, naked RNA is uncertain (olive boxes). SL, stem-loop; Sm, Sm protein binding site; BP, splicing branch-point binding site; Flank, flanking ssRNA region of a nearby motif; IL, interior loop; Hinge, ssRNA region connecting two RNA domains; Kturn, kink-turn RNA motif containing non-canonical base pairs. b, Cutting scores for all long (> 120nt) C/D box snoRNAs considered for follow-up probing. RNAs with an asterisk (*) were chosen for follow-up probing.
FragSeq cutting scores are in good agreement with known secondary structures of U1a (Fig. 2g), U3b, and U5 (Fig. 3), as well as several other ncRNAs whose secondary structures have been examined (Fig. 4a). Our method is particularly good at locating stem-loops and hinge regions, producing consecutive high cutting scores in those areas. However, it generally does not reveal small interior loops or bulges. This is expected, as P1 has been shown to prefer a minimum of 3 consecutive ssDNA bases to catalyze scission, but operates most optimally on runs of 4-6 bases of ssDNA14, and likely has the same preference for ssRNA. We occasionally observe weak cutting scores in regions believed to be dsRNA, but this signal is generally not above the spurious level of other probing agents observed in conventional probing experiments.
Cutting scores correlate with reactivity to probing agents
We examined whether the extent of P1 cutting as inferred by our assay correlates with susceptibility to ssRNA probing chemicals and enzymes in previous studies, to show that FragSeq can capture information about the susceptibility of a site uncovered by conventional methods, but in a high-throughput manner. We compared our cutting scores to probing performed on human U315 and human U516 which are sufficiently similar to the mouse homologues (U3b: 87% identity, U5: 95% identity). Like our study, these studies probed naked RNA in solution after purification from cell lysate, so they contained endogenous base editing and modifications. For U3, we focused on the mouse U3b homolog, which has 3.3 to 5.4 times more reads than homolog U3a across our samples and treatments.
We find that for both RNAs, previously determined regions of high reactivity towards probes specific for unpaired bases (Fig. 3a for U3b, 3c for U5) correlate with high FragSeq cutting scores (Fig. 3b for U3b, 3d for U5). Stem-loops SL1 and SL2 and the hinge region in U3b and stem-loop SL1 in U5 have strong reactivity in all studies including ours. For large interior loops, moderate to strong reactivity in prior studies is also seen in our studies, except for IL5 in U3b; however, it contains B and C boxes that may form base-pairs and non-canonical K-turn interactions17 that could prevent cleavage by P1. It should also be mentioned that P1 is a far larger enzyme (45-50 kDa) than other single stranded ribonucleases like RNase A and T1 (14 and 11 kDa, respectively). This difference could account for reactivity at certain internal sites where steric clashes may play a role.
Validation of FragSeq results on novel structures
We wanted to validate FragSeq results on previously unprobed RNAs using conventional techniques to ensure that our algorithm was not over-fit towards RNAs with previously known structures. We chose long (> 120nt) C/D box snoRNAs. Unlike canonical C/D box snoRNAs that guide 2′-_O_-methylation in a RNP complex and are therefore thought to lack structure in the absence of protein partners, the long C/D box snoRNAs U3 (Fig. 3a) and U8 (Fig. 4a) are structured and function in rRNA processing18, 19. The boxes, guides, and other features of a canonical C/D box snoRNA generally do not comprise more than 80 bases, so it is unclear what structural role the remaining sequence performs in uncharacterized long snoRNAs. We examined cutting scores for all C/D box snoRNAs over 120 bases (Fig. 4b), and selected U15b which has a predicted 2′-_O_-methylation target, U22, required for processing of 18S rRNA by an unknown mechanism20, and U97, which has no predicted target, for follow-up probing with conventional methods. These examples also span a wide range of read coverage in our data, which allowed us to examine how well FragSeq performs at different coverage levels.
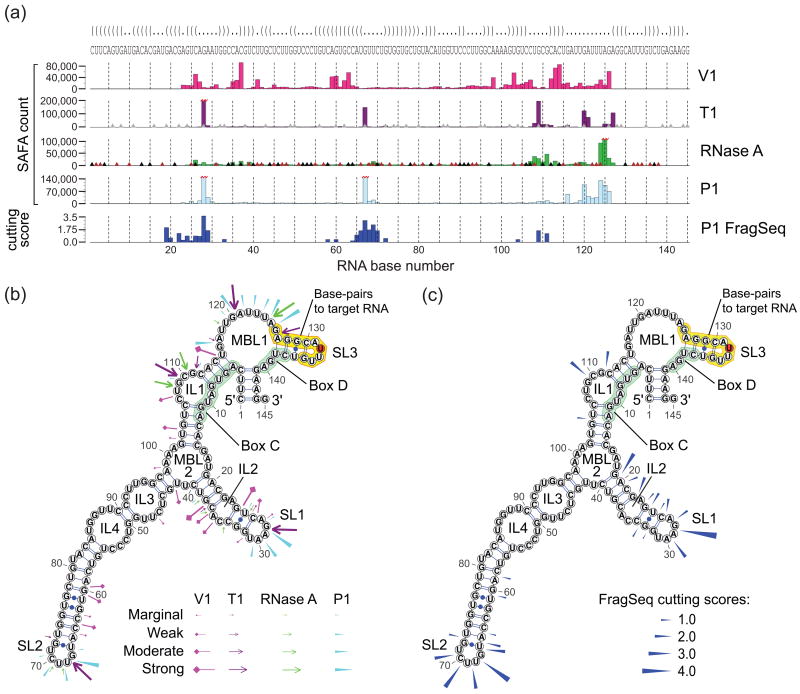
We carried out enzymatic probing of these RNAs, transcribed in vitro, with RNases V1, which prefers stacked bases, and T1, A, and P1, which prefer ssRNA (Supplementary Fig. 6). We see (Fig. 5a, Supplementary Fig. 7a, and Supplementary Fig. 8a) that regions that behave as ssRNA on the FragSeq assay also tend to behave as ssRNA in our follow-up probing, indicating that moderate to high cutting scores are accurate evidence of ssRNA (Supplementary Note 3). When compared to follow-up probing, U15b and U22 have more reliable cutting scores than U97, probably because the coverage for U97 is the lowest (see Supplementary Discussion). However, some ssRNA regions are not picked up by FragSeq. For example, we did not detect breaks at U15b bases 116 to 126 in any samples (data not shown), although they are highly reactive in follow-up probing. This is probably because cuts in that region would produce fragments that are outside of the 20-100 base size selection range.
Figure 5. FragSeq probing versus conventional nuclease probing of U15b C/D box snoRNA.
a, FragSeq ssRNA cutting scores (bottom, dark blue) and band quantification readouts (SAFA counts) based on the gel resolving 5′-end-labeled probing products. X-axis shows nucleotide numbering; gridlines appear every five nucleotides. Gray nucleotides in sequence show areas that were outside of the reliably quantifiable area on the gel. Parentheses denote Watson/Crick base pairs and dots denote ssRNA. Triangles denote bases where a nuclease can cut: T1, gray triangles at G; RNase A, black triangles for C and red triangles for U. Outlier values were truncated and marked with red zigzag lines. b, Follow-up probing data superimposed on our structure model, with probing enzymes color-coded as in (a). Marginal, weak, moderate, or strong enzyme activity was inferred from manual inspection of the gel and Safa quantification from (a) (Supplementary Note 3). c, FragSeq cutting scores superimposed on the same structure model as (a) and (b). Boxes (green) and the putative region that base-pairs with target rRNA (orange) are highlighted, with the base opposite of the methylated position26 in red. Highlighting is as in (b).
We constructed structure models for these three snoRNAs using computational methods, phylogeny information, and data from our follow-up probing (Fig. 5b, Supplementary Fig. 7b, Supplementary Fig. 8b, Supplementary Note 3). Superimposing the cutting scores on these secondary structure models (Fig. 5c, Supplementary Fig. 7c, Supplementary Fig. 8c) shows that FragSeq data agrees with models derived using conventional techniques because high cutting scores tend to occur in ssRNA regions.
Discussion
Due to read length limitations, most RNA-Seq studies turn to random hydrolysis of the sample before sequencing21. Instead, we fragmented RNA in a structure-specific manner, reporting on nuclease susceptibility along each transcript. FragSeq will not generate the uniform coverage across a transcript needed for accurate abundance estimates or alternative splicing characterization. Instead, quantitative comparisons along each transcript, expressed as cutting scores, are made between enzyme-treated samples versus control samples, yielding information about RNA structure. For analysis of a novel transcriptome, the FragSeq preparation can be done in parallel with other preparations that quantify abundance, barcoding the samples for analysis in a single sequencing run.
By using nuclease P1, we were able to specifically enrich for its products and avoid products of spontaneous or canonical RNase degradation. Using the parallel PNK treatment where these latter products were converted to clonable RNAs showed how sequencing multiple treatments yields insights into naturally labile sites.
In parallel with this manuscript, a similar technique for high-throughput RNA structure probing was introduced22. That study utilized nuclease S1, which has similar properties to P1, and RNase V1, which cleaves stacked bases. Their readout of structure is reported as a ratio of susceptibilities of each RNA site to the two nucleases, whereas FragSeq monitors one nuclease with respect to a control run without nuclease. We favor cutting scores that are log ratios of data from nuclease versus control treatments because they describe, for each site, its nuclease susceptibility relative to its natural degradation susceptibility in the cell or during the preparation. Cut counts per site in the nuclease-treated sample alone do not provide data as informative as cutting scores (compare Fig. 2g with Supplementary Fig. 4).
We provide configurable software to compute cutting scores from mapped sequencing reads, outputting them and intermediate analysis data in formats compatible with the UCSC Genome Browser (http://genome.ucsc.edu), allowing visualization of structure data in a genomic context. This allows straightforward application of our analysis tools to future sequencing runs. We also modified the well-established RNAstructure software23 to allow input of FragSeq data to guide computational structure prediction (Supplementary Discussion).
We do not observe single-hit kinetics for which probing studies generally aim, as many ncRNA reads do not contain the native 3′ ends of the RNA from which they originate (Supplementary Fig. 9). We also do not observe native 5′ ends for those RNAs, but that is due to the trimethylguanosine cap blocking adapter ligation. We have not determined whether multiple cuts by P1 in solution are indeed the general case, or whether our size selection step enriches for products of multiple hits. Perhaps calibrating P1 for single-hit kinetics on in vitro transcribed test RNAs did not translate to single-hit kinetics in the nuclear transcriptome where many ncRNAs are highly modified. In addition, the test RNAs in our probing experiment were all intact at the beginning of digestion, whereas a portion of the ncRNAs in the nuclear sample may be partially degraded. In any case, it is clear that reads produced by multiple cuts are providing reliable structure data. This is likely because P1 prefers to cut in stem-loops or hinge regions and these cuts are unlikely to cause the closing helix to denature under our salt conditions, so the original structure may not change before subsequent cuts. As hinge regions often connect domains that fold separately, cuts there would not lead to refolding of those independent domains. This may not be true for larger structured RNAs with long-range tertiary interactions, but these RNAs fall outside of the scope of our current method. Rather than comparing to conventional single-hit probing, it is more fitting to liken FragSeq nuclease data to DNase hypersensitivity assays on chromatin in that it gives a global perspective of RNA structure (e.g. stem-loop positions) rather than fine details (e.g. bulges in a helix).
We envision several areas of RNA biology where refinement of a FragSeq protocol might prove fruitful. One topic of particular interest is riboswitches, RNA molecules that change structure upon the binding of a metabolite ligand24. Using parallel sequencing runs with and without the ligand of interest could yield a differential pattern of cutting scores along such RNAs that would serve as a signature of a conformational change.
Additionally, nuclease protection assays25 could be scaled up to whole transcriptomes by performing parallel nuclease digestions with and without an RNA-binding protein pre-incubated with the whole-cell RNA. Identifying differentially protected regions would hone in on the RNA binding protein's specificity for sequence or structural context. Likewise, such digestions could be carried out on whole cell or nuclear extracts with proteins still bound. Nuclease P1 would be a good candidate for these digestions since the buffer conditions for extracts are usually similar to the relatively physiological pH and salt concentrations used in this study.
Nuclease P1 is also stable at high temperatures so we envision that FragSeq could be another way to monitor thermal denaturation of RNA domains. By parallel sequencing from nuclease reactions performed at different temperatures, the single-stranded character of a given transcript could be monitored and act as a proxy for unfolding.
Though we focused on one enzyme here, our experimental pipeline and software could be easily adapted to other enzymatic or chemical probes, so long as a proper control is carried out in parallel. FragSeq, combined with methods developed in previous RNA-Seq studies, enables researchers to take high-throughput transcriptome analysis beyond one-dimensional sequence to reveal structural features of RNAs and provide clues to their underlying biology.
Supplementary Material
1
2
Acknowledgments
A.V.U. was supported in part by NIH bioinformatics training grant 1 T32 GM070386-01 and by an NSF Graduate Research Fellowship. S.K. was supported in part by NIH/NHGRI grant U41 HG004568-01. C.S.O. was supported by California Institute for Regenerative Medicine Training Grant #T3-00006. This study was funded in part by NIH R01HG004002 to D.H.M. and NIH 1R03DA026061-01 to S.R.S. D.H. is an investigator of the Howard Hughes Medical Institute.
We thank D. Bernick, S. Kuersten, and O. Uhlenbeck for helpful discussions and Y. Ponty for adding the feature to display enzymatic/chemical modifications to VARNA, the program used to visualize our probing data. We thank E. Farias-Hesson and N. Pourmand of the UCSC Genome Sequencing Center for preparing samples and Applied Biosystems, Inc. (ABI) for carrying out the sequencing. We thank M. Storm and F. Ng of ABI for facilitating that sequencing run.
Footnotes
Author Contributions: J.G.U. designed and carried out the experiments. A.V.U. designed and carried out the bioinformatics analysis, except for preparing the read mappings, which were done by S.K., with C.S.O. contributing data. J.E.M. programmed additional features in the RNAstructure software. J.G.U. and A.V.U. wrote the manuscript. S.R.S., D.H.M., T.M.L., and D.H. directed the research. All authors read and edited the manuscript.
Competing Financial Interests: The authors declare no competing financial interests.
Accession code. Gene Expression Omnibus GSE24622 (sequencing reads and their genome mappings).
References
- 1.Gesteland R, Cech T, Atkins J, editors. The RNA World. 3rd. Cold Spring Harbor Laboratory Press; Cold Spring Harbor, New York: 2005. [Google Scholar]
- 2.Affymetrix/Cold Spring Harbor Laboratory ENCODE Transcriptome Project. Post-transcriptional processing generates a diversity of 5′-modified long and short RNAs. Nature. 2009;457:1028–1032. doi: 10.1038/nature07759. [DOI] [PMC free article] [PubMed] [Google Scholar]
- 3.Guttman M, et al. Chromatin signature reveals over a thousand highly conserved large non-coding RNAs in mammals. Nature. 2009;458:223–227. doi: 10.1038/nature07672. [DOI] [PMC free article] [PubMed] [Google Scholar]
- 4.Ambros V. microRNAs: tiny regulators with great potential. Cell. 2001;107:823–826. doi: 10.1016/s0092-8674(01)00616-x. [DOI] [PubMed] [Google Scholar]
- 5.Kapranov P, et al. RNA maps reveal new RNA classes and a possible function for pervasive transcription. Science. 2007;316:1484–1488. doi: 10.1126/science.1138341. [DOI] [PubMed] [Google Scholar]
- 6.Knapp G. Enzymatic approaches to probing of RNA secondary and tertiary structure. Methods Enzymol. 1989;2:192–212. doi: 10.1016/0076-6879(89)80102-8. [DOI] [PubMed] [Google Scholar]
- 7.Low JT, Weeks KM. SHAPE-directed RNA secondary structure prediction. Methods. 2010;52:150–158. doi: 10.1016/j.ymeth.2010.06.007. [DOI] [PMC free article] [PubMed] [Google Scholar]
- 8.Machado-Lima A, del Portillo HA, Durham AM. Computational methods in noncoding RNA research. J Math Biol. 2008;56:15–49. doi: 10.1007/s00285-007-0122-6. [DOI] [PubMed] [Google Scholar]
- 9.Crawford GE, et al. Genome-wide mapping of DNase hypersensitive sites using massively parallel signature sequencing (MPSS) Genome Res. 2006;16:123–131. doi: 10.1101/gr.4074106. [DOI] [PMC free article] [PubMed] [Google Scholar]
- 10.Ying QL, Stavridis M, Griffiths D, Li M, Smith A. Conversion of embryonic stem cells into neuroectodermal precursors in adherent monoculture. Nat Biotechnol. 2003;21:183–186. doi: 10.1038/nbt780. [DOI] [PubMed] [Google Scholar]
- 11.Desai NA, Shankar V. Single-strand-specific nucleases. FEMS Microbiol Rev. 2003;26:457–491. doi: 10.1111/j.1574-6976.2003.tb00626.x. [DOI] [PubMed] [Google Scholar]
- 12.Cameron V, Uhlenbeck OC. 3′-Phosphatase activity in T4 polynucleotide kinase. Biochemistry. 1977;16:5120–5126. doi: 10.1021/bi00642a027. [DOI] [PubMed] [Google Scholar]
- 13.Romier C, Dominguez R, Lahm A, Dahl O, Suck D. Recognition of single-stranded DNA by nuclease P1: high resolution crystal structures of complexes with substrate analogs. Proteins. 1998;32:414–424. [PubMed] [Google Scholar]
- 14.Naik AK, Raghavan SC. P1 nuclease cleavage is dependent on length of the mismatches in DNA. DNA Repair (Amst) 2008;7:1384–1391. doi: 10.1016/j.dnarep.2008.04.010. [DOI] [PubMed] [Google Scholar]
- 15.Parker KA, Steitz JA. Structural analyses of the human U3 ribonucleoprotein particle reveal a conserved sequence available for base pairing with pre-rRNA. Mol Cell Biol. 1987;7:2899–2913. doi: 10.1128/mcb.7.8.2899. [DOI] [PMC free article] [PubMed] [Google Scholar]
- 16.Mougin A, Gottschalk A, Fabrizio P, Lührmann R, Branlant C. Direct probing of RNA structure and RNA-protein interactions in purified HeLa cell's and yeast spliceosomal U4/U6.U5 tri-snRNP particles. J Mol Biol. 2002;317:631–649. doi: 10.1006/jmbi.2002.5451. [DOI] [PubMed] [Google Scholar]
- 17.Granneman S, et al. Role of pre-rRNA base pairing and 80S complex formation in subnucleolar localization of the U3 snoRNP. Mol Cell Biol. 2004;24:8600–8610. doi: 10.1128/MCB.24.19.8600-8610.2004. [DOI] [PMC free article] [PubMed] [Google Scholar]
- 18.Kass S, Tyc K, Steitz JA, Sollner-Webb B. The U3 small nucleolar ribonucleoprotein functions in the first step of preribosomal RNA processing. Cell. 1990;60:897–908. doi: 10.1016/0092-8674(90)90338-f. [DOI] [PubMed] [Google Scholar]
- 19.Peculis BA, Steitz JA. Disruption of U8 nucleolar snRNA inhibits 5.8S and 28S rRNA processing in the Xenopus oocyte. Cell. 1993;73:1233–1245. doi: 10.1016/0092-8674(93)90651-6. [DOI] [PubMed] [Google Scholar]
- 20.Tycowski K, Shu M, Steitz J. Requirement for intron-encoded U22 small nucleolar RNA in 18S ribosomal RNA maturation. Science. 1994;266:1558. doi: 10.1126/science.7985025. [DOI] [PubMed] [Google Scholar]
- 21.Wang Z, Gerstein M, Snyder M. RNA-Seq: a revolutionary tool for transcriptomics. Nat Rev Genet. 2009;10:57–63. doi: 10.1038/nrg2484. [DOI] [PMC free article] [PubMed] [Google Scholar]
- 22.Kertesz M, et al. Genome-wide measurement of RNA secondary structure in yeast. Nature. 2010;467:103–107. doi: 10.1038/nature09322. [DOI] [PMC free article] [PubMed] [Google Scholar]
- 23.Reuter JS, Mathews DH. RNAstructure: software for RNA secondary structure prediction and analysis. BMC Bioinformatics. 2010;11:129. doi: 10.1186/1471-2105-11-129. [DOI] [PMC free article] [PubMed] [Google Scholar]
- 24.Mandal M, Breaker RR. Gene regulation by riboswitches. Nat Rev Mol Cell Biol. 2004;5:451–463. doi: 10.1038/nrm1403. [DOI] [PubMed] [Google Scholar]
- 25.Maroney P, Romfo C, Nilsen T. Nuclease protection of RNAs containing site-specific labels: a rapid method for mapping RNA-protein interactions. RNA. 2000;6:1905–1909. doi: 10.1017/s1355838200001308. [DOI] [PMC free article] [PubMed] [Google Scholar]
- 26.Kiss-László Z, Henry Y, Bachellerie JP, Caizergues-Ferrer M, Kiss T. Site-specific ribose methylation of preribosomal RNA: a novel function for small nucleolar RNAs. Cell. 1996;85:1077–1088. doi: 10.1016/s0092-8674(00)81308-2. [DOI] [PubMed] [Google Scholar]
- 27.Beard C, Hochedlinger K, Plath K, Wutz A, Jaenisch R. Efficient method to generate single-copy transgenic mice by site-specific integration in embryonic stem cells. Genesis. 2006;44:23–28. doi: 10.1002/gene.20180. [DOI] [PubMed] [Google Scholar]
- 28.Skarnes WC. Gene trapping methods for the identification and functional analysis of cell surface proteins in mice. Methods Enzymol. 2000;328:592–615. doi: 10.1016/s0076-6879(00)28420-6. [DOI] [PubMed] [Google Scholar]
- 29.Sobczak K, Michlewski G, de Mezer M, Krol J, Krzyzosiak WJ. Trinucleotide repeat system for sequence specificity analysis of RNA structure probing reagents. Anal Biochem. 2010;402:40–46. doi: 10.1016/j.ab.2010.03.021. [DOI] [PubMed] [Google Scholar]
- 30.Mortazavi A, Williams BA, Mccue K, Schaeffer L, Wold B. Mapping and quantifying mammalian transcriptomes by RNA-Seq. Nat Meth. 2008;5:621–628. doi: 10.1038/nmeth.1226. [DOI] [PubMed] [Google Scholar]
Associated Data
This section collects any data citations, data availability statements, or supplementary materials included in this article.
Supplementary Materials
1
2
