Origins and functional impact of copy number variation in the human genome (original) (raw)
. Author manuscript; available in PMC: 2012 Apr 20.
Published in final edited form as: Nature. 2009 Oct 7;464(7289):704–712. doi: 10.1038/nature08516
Abstract
Structural variations of DNA greater than 1 kilobase in size account for most bases that vary among human genomes, but are still relatively under-ascertained. Here we use tiling oligonucleotide microarrays, comprising 42 million probes, to generate a comprehensive map of 11,700 copy number variations (CNVs) greater than 443 base pairs, of which most (8,599) have been validated independently. For 4,978 of these CNVs, we generated reference genotypes from 450 individuals of European, African or East Asian ancestry. The predominant mutational mechanisms differ among CNV size classes. Retrotransposition has duplicated and inserted some coding and non-coding DNA segments randomly around the genome. Furthermore, by correlation with known trait-associated single nucleotide polymorphisms (SNPs), we identified 30 loci with CNVs that are candidates for influencing disease susceptibility. Despite this, having assessed the completeness of our map and the patterns of linkage disequilibrium between CNVs and SNPs, we conclude that, for complex traits, the heritability void left by genome-wide association studies will not be accounted for by common CNVs.
Genomes vary from one another in multifarious ways, and the totality of this genetic variation underpins the heritability of human traits. Over the past two years, the human reference sequence1 has been followed by other genome sequences from individual humans (reviewed in ref. 2) with fruitful comparisons. These studies show the landscape of genetic variation, and allow estimation of the relative contributions of sequence (base substitutions) and structural variation (indels (that is, insertions or deletions), CNVs and inversions). For simplicity, in this study we use the term CNV to describe collectively all quantitative variation in the genome, including tandem arrays of repeats as well as deletions and duplications.
Despite this growing genomic clarity, these classes of variation are not equivalently recognized in human genetic studies. To appreciate the functional impact and selective history of a variant, its correlation with nearby variants must be characterized3 allowing imputation into previously assayed genomes4, and experimental reagents and protocols are needed for the variant to be assayed in a cost-effective manner in different samples.
Genome re-sequencing studies have shown that most bases that vary among genomes reside in CNVs of at least 1 kilobase (kb)5,6. Population-based surveys have identified thousands of CNVs, most of which, due to limited resolution, are larger than 5 kb7–9. Their functional impact has been demonstrated across the full range of biology10, from cellular phenotypes, such as gene expression11, to all classes of human disease with an underlying genetic basis: sporadic, Mendelian, complex and infectious (reviewed in ref. 12). This class of variation is, nonetheless, poorly integrated into human genetic studies at all levels. Not only are CNVs—especially smaller ones—underrepresented in existing databases, but with at least one notable exception8, previous studies have tended to focus on CNV discovery and not genotyping, owing in part to the technical challenges of their assays. Nevertheless, the potential utility of a reference set of CNV genotypes is exemplified by the observation that of 67 CNVs genotyped in a previous genome-wide survey of CNV9, four have subsequently become associated with complex traits: a 20-kb deletion upstream of the IRGM gene with Crohn’s disease13, a 45-kb deletion upstream of NEGR1 with body mass index14, a 32-kb deletion that removes two late-cornified envelope genes with psoriasis15, and a 117-kb deletion of UGT2B17 with osteoporosis16.
Clinical geneticists need to discriminate pathogenic from benign CNVs in their patients, and have made extensive use of data from CNV surveys of apparently healthy individuals17. The mere presence or absence of a variant in such control data sets is only partially informative, as the determination of the pathogenicity of inherited CNVs is at present limited by the lack of information on their frequency and combination in apparently healthy individuals of a given age.
As successive surveys for CNVs have yielded higher resolution data, smaller variants have been discovered, along with increased precision of the breakpoints for each CNV8,18,19. Precise breakpoint sequences are required, not only to assess the functional content of a variant, but also to design robust genotyping assays and to identify signatures of the underlying mutational mechanisms. CNVs are generated by diverse mutational mechanisms (recently reviewed in ref. 20)—including meiotic recombination, homology-directed and non-homologous repair of double-strand breaks, and errors in replication—but the relative contribution of these different mechanisms is not well appreciated.
Here we describe a comprehensive survey to detect common CNVs larger than 1 kb in size in the human genome, and the development and application of experimental protocols to allow these CNVs to be assayed. The HapMap sample set has previously been well-characterized for other forms of variation, and we now add CNV genotypes for these samples. These unprecedented resources have allowed us to discern key features of the mutational mechanisms underlying CNVs, to investigate the effect of selection on CNVs, and to identify candidate CNVs that may be the causal variant on haplotypes associated with complex traits.
CNV discovery and genotyping
We designed an experimental strategy to discover CNVs greater than ~500 base pairs (bp) in individuals with European or West African ancestry (Fig. 1). Using a set of 20 NimbleGen arrays, each comprising ~2.1-million long oligonucleotide probes covering the assayable portion of the genome (median spacing of 56 bp), we performed 800 comparative genome hybridization (CGH) experiments with female lymphoblastoid cell-line DNA competed against a common male European reference sample (NA10851). The female test DNAs comprised 19 CEU (Utah residents with ancestry from northern and western Europe)-European HapMap individuals, 20 YRI (Yoruba from Ibadan, Nigeria)-West Africans, and a Polymorphism Discovery Resource individual (NA15510). It was estimated that 40 samples would provide 95% power to sample variants with minor allele frequencies of 5% in either population.
Figure 1. Overview of experimental strategy for CNV discovery and genotyping.

Overview of the discovery and genotyping phases of this project, with the former generating a new map of CNV locations and the latter allowing a reference set of CNV genotypes to be constructed. Data are available at the Database of Genomic Variants50 and http://www.sanger.ac.uk/humgen/cnv/42mio.
We used stringent calling criteria (minimum 10 consecutive probes) to identify 51,997 putative CNV segments in the 41 samples (40 test samples and 1 reference sample). The median numbers of segments in CEU and YRI individuals were 1,117 and 1,488, respectively, reflecting both the higher genetic diversity in Africa and the use of a CEU reference sample. CNV sizes ranged from 443 bp to 1.28 megabases (Mb), with a median size of 2.9 kb. We merged these calls across samples to identify 11,700 putative CNV loci (median size of 2.7 kb), of which 49% were called in a single individual (Supplementary Methods and Supplementary Table 1). Using quantitative PCR (qPCR) for initial validation, we confirmed 79 of 99 randomly selected loci as varying in copy number, suggesting a preliminary false-discovery rate of ~20% (Supplementary Methods).
Within the context of a CNV association study conducted by the Wellcome Trust Case Control Consortium (WTCCC), a CNV-typing array was designed by the WTCCC in collaboration with the other co-authors of this paper in which a preliminary version of our discovery data was shared at an early stage with the WTCCC. The array used the Agilent CGH platform and comprised 105,000 long oligonucleotide probes. Its targets include 10,819 out of 11,700 (92%) of the candidate CNV loci, and 375 other loci from published CNV surveys, including 292 new sequence insertions (Supplementary Methods)5,18. To perform large-scale validation of candidate CNVs, we ran each of the 41 DNA samples used in the discovery phase of this study on the CNV-typing array against a pooled reference sample to minimize reference-specific artefacts. By comparing the correlation between the discovery data and the CNV-typing data across the same samples at each locus, we could distinguish probable false-positives and true CNVs (Supplementary Methods). Using this approach we estimated the false discovery rate to be 15%, in good agreement with the estimate obtained from the much smaller set of independent validation experiments using qPCR.
We then assayed 450 HapMap samples (180 CEU, 180 YRI, 45 JPT (individuals in Tokyo, Japan) and 45 CHB (individuals in Beijing, China)) across our CNV-typing array. We used a Bayesian algorithm to genotype CNVs (more precisely: to assign individuals to diploid copy number classes), and then manually curated the selection of the optimal normalization and cluster locations for every locus (Supplementary Methods). We applied quality-control filters to identify 5,238 non-redundant CNVs (4,978 from the CNVs discovered here) that could be genotyped with high confidence in at least one HapMap population (3,320 were polymorphic in CEU, 3,985 in YRI and 1,957 in JPT+CHB), and these genotypes exhibited high concordance across replicate experiments (Supplementary Table 2 and Supplementary Methods).
We also analysed data on 242 HapMap samples on an Illumina Infinium genotyping platform (Human660W), developed in conjunction with the WTCCC 2 experiments, which incorporates probes in 8,914 of our CNVs (biased towards those with high frequency in CEU), using recently published CNV genotyping software21. We observed that 2,513 CNVs could be genotyped, 2,175 (87%) of which were also genotyped on the Agilent CGH microarrays. This high concordance suggests that the genomic properties of the CNV rather than the performance characteristics of the technology platform determine whether a CNV can be reliably typed. Given the extensive overlap, and the smaller number of HapMap samples run on the Illumina array, subsequent analyses of genotyped CNVs focus solely on data from the array-CGH CNV-typing.
We developed a new statistical method (Supplementary Methods) to estimate the absolute copy number of each genotyped CNV, allowing us to distinguish deletions (0, 1 or 2 diploid copy number), duplications (2, 3 or 4 diploid copy number) and multiallelic CNVs (greater than 3 possible diploid copy numbers). Of the 5,238 genotyped CNVs, 77% were deletions, 16% were duplications and 7% were multi-allelic (Supplementary Fig. 1.1 and Supplementary Table 1.1). The 5:1 ratio of deletions to duplications probably partly reflects the greater technical challenge of robustly genotyping duplications.
For all subsequent analyses (except where noted) we examine a set of 8,599 validated CNVs, 70% (6,024 out of 8,599) of which have not been previously characterized (Supplementary Methods).
The improved resolution of CNV breakpoints provided an opportunity to assess the extent to which distinct CNVs overlap in our data set. This is a complex problem in the absence of sequenced breakpoints for all variants, but we can use all validated CNVs, which may have some residual redundancy (that is, a single CNV could be split into two overlapping loci), to estimate an upper bound on this, and our non-redundant genotyped loci, which are probably biased against genotyping overlapping loci, to estimate a lower bound (Supplementary Methods). In this manner, we estimate the proportion of CNVs overlapping other CNVs to be in the range of 6% to 29%, which is far higher than the proportion of SNPs that are triallelic (that is, three different bases observed at the same site).
Genomic effect of CNVs
We identified an average of 1,098 validated CNVs, and a cumulative CNV locus length of 24 Mb (0.78% of the genome) when comparing two genomes by CGH. The 8,599 validated CNVs discovered in these 41 individuals cover a total of 112.7 Mb (3.7%) of the genome.
On average per comparison of two diploid genomes by CGH, we found that 445 out of 1,098 (40.5%) of the validated CNVs overlapped with 622 out of 20,174 (3.1%) RefSeq genes (including intronic CNVs), altering the structure of 835 out of 30,917 (2.7%) gene transcripts, and directly altering the coding sequence of 323 out of 27,761 (1.2%) messenger RNAs (Table 1). When all samples were considered together, we found that 3,340 (38.8%) of the validated CNVs overlapped 2,698 (13.4%) RefSeq genes (including intronic CNVs), altering the structure of 3,863 (12.5%) gene transcripts, and directly altering the coding sequence of 1,519 (5.5%) mRNAs (Table 1). Over half of the partial gene deletions that encompass exons are predicted to induce frameshifts, and combining these alleles with whole gene deletions identifies unambiguous loss of function alleles for 267 genes (Supplementary Table 1.2).
Table 1.
Number of RefSeq genes affected by CNVs
| CNV locitotal (avg sample) | Introntotal (avg/sample) | Whole-genetotal (avg/sample) | Promoter (TSS–500 bp)total (avg/sample) | Exontotal (avg/sample) | Stop codontotal (avg/sample |
|---|---|---|---|---|---|
| 8,599 validated (1,098)* | 1,236 (269) | 893 (204) | 238 (42) | 183 (38) | 270 (70) |
| 4,977 genotyped (670) | 1,036 (198) | 494 (67) | 278 (20) | 134 (18) | 163 (28) |
| 3,811 deletions (549) | 909 (177) | 222 (26) | 147 (9) | 80 (11) | 74 (10) |
| 874 duplications (97) | 203 (20) | 244 (36) | 93 (9) | 45 (7) | 90 (16) |
| 292 multi-allelic (24) | 47 (5) | 62 (5) | 49 (2) | 21 (1) | 15 (2) |
We observed a paucity of autosomal CNVs overlapping RefSeq genes, compared to random permutations (Supplementary Fig. 1.2). This impoverishment is more strongly associated with deletions than duplications or multiallelic loci (Fig. 2a), and in common CNVs (minor allele frequency (MAF) > 10%) compared to rare CNVs (MAF < 1%) (Fig. 2b). The bias of common deletions away from genes is stronger in YRI than in CEU (Fig. 2b), which is also consistent with weaker selection against deleterious base substitutions in CEU than YRI22. There was also a bias of CNVs away from enhancers and ultra-conserved elements, but not from promoters or DNaseI hypersensitive sites (Supplementary Fig. 1.2). Indeed duplications seem to be significantly enriched among promoters and stop codons, perhaps corroborating a previous observation of indel enrichment at either end of genes23.
Figure 2. Functional impact of CNVs by type, frequency and population.

a, Impact on genes of sets of CNV at different stages of characterization (candidate, validated, validated/genotyped loci). Genotyped CNVs are split into different classes (deletion, duplication and multiallelic). b, Impact on genes of CNV classes based on population frequency. Frequency classes: common (MAF ≥ 0.1 in any population), intermediate (0.1 > MAF > 0.01), rare (MAF ≤ 0.01 in all populations). ASN denotes JPT+CHB.
Gene ontology analysis showed an enrichment of genes involved in extracellular biological processes such as cell adhesion, recognition and communication in CNVs. However, genes involved in intracellular processes such as biosynthetic and metabolic pathways were underrepresented in CNV regions (Supplementary Methods and Supplementary Fig. 1.3). These findings confirm and extend previous observations that CNVs are preferentially found in genes at the periphery of cellular networks24.
We also identified 56 potential fusion genes (Supplementary Table 1.3) and experimentally validated four (AKR7L–AKR7A3, BTNL3–BTNL8, LCE1D–LCE1E and SIGLEC5–SIGLEC14) of five tested. Interestingly, 55% of the gene fusions arise between paralogous gene family members, which may be less likely to generate truly novel gene functions.
Mechanisms of CNV formation
The precision of CNV breakpoint mapping determines how reliably mutation mechanisms might be inferred. We determined the precision of our breakpoint estimates by identifying 350 CNVs in two samples (194 breakpoints in NA15510 and 156 in NA12878) for which breakpoint sequences have been published18,19,25. Comparing our breakpoint estimates to these sequences revealed excellent precision (median estimation error ~60 bp), representing an improvement of more than an order of magnitude over previous population-based CNV surveys8, with similarly accurate estimation for both samples (NA15510: 1 bp–17.1 kb, median 54 bp; NA12878: 0 bp–5.5 kb, median 62 bp). These findings were supported by high-concordance of breakpoint estimation between replicate experiments (Supplementary Methods).
CNV formation mediated by recombination between interspersed duplicated sequences by non-allelic homologous recombination (NAHR), or corresponding to tandem arrays of variable numbers of tandem repeats (VNTR), can readily be identified at the resolution afforded in our experiments by analyses of local sequence homology (Supplementary Methods). Although germline mutation processes at VNTR, like NAHR, are primarily driven by meiotic recombination, detailed mutation analyses have shown a major role for complex intra- and inter-allelic exchanges at VNTR that are not a major source of CNV at interspersed duplicated sequences26. Sequence analysis of CNV breakpoints is required to estimate the contribution to CNV formation of other mechanisms including non-homologous end joining and microhomology-mediated break-induced repair.
We found the relative contribution of NAHR and VNTR-mediated CNV formation to be largely dependent on CNV size. NAHR was estimated to be 7 times more likely than VNTR to be the underlying mechanism for CNVs in the largest size decile, whereas VNTR were 3.5 times more frequent in the bottom decile. Overall, NAHR and VNTR contribute similarly (13.5% and 11.2% of validated CNVs, respectively; Supplementary Fig. 1.4). Owing to the challenges of designing validation and genotyping assays for VNTR, these loci are probably underrepresented in our genotyping data (5.6% of genotyped CNVs), although we have PCR-validated 11 out of 12 randomly selected VNTR to demonstrate that this class of loci is genuinely polymorphic (Supplementary Table 1.4 and Supplementary Fig. 1.5).
Short sequence motifs thought to form non-B-DNA structures may predispose to chromosomal rearrangements27. We tested the hypothesis that primary DNA sequence can predict CNV formation by screening CNV breakpoints for enrichment of 13 published motifs and genomic annotations (Fig. 3a and Supplementary Methods). Two motifs forming non-B-DNA structures were strongly overrepresented at CNV breakpoints (G-quadruplexes P < 10−3, slipped DNA P < 10−3), as were CpGs and a 13-bp motif predictive of recombination hotspots and genome instability in humans28. In the latter case the association seems to be due solely to VNTR containing the hotspot motif (Fig. 3c). Our results indicate that the previous observations of recombination hotspots flanking a few well-characterized highly polymorphic VNTR29, probably reflects a genome-wide association between hotspots and a large subset of VNTR. The known enrichment of G-quadruplexes and CpGs in gene promoters30 may partly explain the enrichment of CNVs we observed in promoters (Supplementary Figs 1.6 and 1.7).
Figure 3. DNA sequence context enrichments around CNV breakpoints.

Thirty DNA sequence motifs thought to be associated with genome instability were compared to estimated CNV breakpoints. a, The proportion of CNV breakpoint regions containing each motif was plotted separately for deletions (green circles) and duplications (red circles). Motifs generated through machine-learning in the current study are indicated with green labels, and the remainder are from the literature. Asterisks denote motifs that show significant enrichment in duplication breakpoints compared to deletion breakpoints; ‘+’ denotes motifs that are significantly overrepresented in the total set of CNV breakpoint sequences compared to matched control sequence. b, Density of Alu signal recognition particle (SRP) binding motif in 50-bp bins within (red) and flanking (white) CNV breakpoints, showing significant enrichment of the motif at CNV breakpoints; bootstrap 95% confidence intervals are indicated by blue bars. c, The density of the 13-bp motif predictive of recombination hotspots seems to be increased directly adjacent to VNTR CNVs but not around non-VNTR CNVs.
As a complementary approach to testing previously described sequence motifs, we collated a large set of sequences likely to contain CNV breakpoints and used machine learning31 to discover new mutagenic motifs (Supplementary Methods and Supplementary Fig. 1.8). The motifs that we obtained, although significant, showed a modest enrichment for CNVs ranging from 1.2- to 1.5-fold. The most readily interpretable finding among these is a 14 bp CNV motif that is present in most Alu and SVA elements and has previously been shown to be associated with CNV breakpoints in Alu-Alu recombination events32 (Fig. 3b). This motif represents a binding site in the Alu secondary structure for the signal recognition particle ribonucleoprotein and is highly conserved across Alu elements.
The central role of sequence homology in the fidelity of DNA repair and replication indicates that regions of the genome with higher diversity may be more prone to replication and repair errors. Notably, we found evidence of an enrichment of small indels from the SNP database (dbSNP) (1.7-fold, P < 10−3) and microsatellites (1.24-fold, P < 10−3) near CNV breakpoints (Fig. 3a). This observation suggests that simple variation may precipitate more mutations, both substitutional and structural, as suggested by recent comparative genomic analyses33.
We assessed the statistical significance of differences in the breakpoint signatures of deletions and duplications (Supplementary Methods). We found that duplications are more likely to be formed by NAHR, VNTR and retrotransposition, and are more enriched for breakpoint-associated sequence motifs than deletions (Fig. 3a). These findings indicate that the formation of duplications is more likely to be sequence-dependent than deletions.
Next, we extended our investigation of mutation mechanisms to identify probable dispersed duplications among the CNVs. The array data themselves do not identify chromosomal location, but polymorphic dispersed duplications can be identified by considering other sources of information. We took five complementary approaches to identify dispersed duplications among our CNVs: (1) precise mapping to inter-chromosomal segmental duplications; (2) evidence for inter-chromosomal mappings from sequence data34; (3) inter-chromosomal linkage disequilibrium; (4) poly-A and target site duplication signatures of retrotransposition; and (5) in silico splicing of CNV discovery data in known transcripts to identify retroposed genes (Supplementary Methods and Supplementary Fig. 1.9). By integrating these different sources of data we identified 75 probable dispersed duplications (Fig. 4 and Supplementary Tables 1.5 and 1.6). We developed PCR assays for four of these and genotyped them across 270 HapMap samples, with complete concordance with the array-based genotypes (Supplementary Notes, Supplementary Table 1.7 and Supplementary Fig. 1.10). These dispersed duplications appear randomly distributed among chromosomes. Some of the dispersed duplications can be confidently ascribed to retrotransposition using the signatures described earlier, but other mechanisms may also generate dispersed duplications. Interestingly, a subset of these retrotransposition events does not comprise retroposed repeat elements or known RNA transcripts, some but not all of which seem likely to result from L1 transduction35.
Figure 4. Circular map showing the genomic distribution of different classes of CNVs and their population differentiation.

Chromosomes are shown colour-coded in the penultimate circle. The innermost circle shows lines connecting the origin and the new location of 58 putative inter-chromosomal duplications, coloured according to their chromosome of origin. The next circle out shows a stacked histogram representing the number of deletions (red), duplications (green) and multiallelic (blue) loci in 5-Mb bins. The next circle out shows a stacked histogram representing the number of CNVs generated by NAHR (blue), VNTR (red) and other (grey) mechanisms in each 5-Mb bin. The outermost circle shows the _V_ST measure of population differentiation between CEU and YRI discovery samples for each CNV.
Population genetics of CNV
Although rates of CNV mutation have been well characterized at a small number of loci using experimental techniques, a reliable estimate of the genome-wide mutation rate has yet to be obtained. With a set of CNVs ascertained in a consistent manner we used the Watterson estimator of the population-scaled mutation rate, _θ_W,to estimate the average per-generation rate of CNV formation, μ. The ascertainment-corrected number of segregating sites (>500 bp) leads to an estimate of μ = 3 × 10⁻² mutations per haploid genome, per generation; however at the base-pair level, heterogeneity in this rate is expected to vary by several orders of magnitude among sites (Supplementary Methods). This estimate does not account for purifying selection, and so it probably represents a lowar bound on the true rate.
A key parameter for linkage-disequilibrium-based studies of human variation is the proportion of CNVs that can be tagged well by nearby SNPs. Such ‘taggability’ depends on CNV allele frequency and local SNP density, but not on CNV size (Supplementary Methods). Overall, the taggability of biallelic CNVs genotyped with high confidence seems to be largely similar to that of frequency-matched SNPs, except that rare CNVs are more poorly tagged; in CEU, 77% of CNVs >5% MAF are captured with _r_2 = 0.8, whereas only 23% of CNVs <5% MAF are similarly tagged. These results are similar to others in a smaller data set8. Interestingly, deletions are much better tagged by nearby SNPs than by duplications (average difference in maximum _r_2 is 0.25; P < 10−16), while controlling for allele frequency and local SNP density; this may be a result of the chromosomal dispersion of some duplications and an increased frequency of reversions and repeat mutations at some duplications36.
To estimate the strength of purifying selection acting on CNVs in different functional categories, we fitted a population genetic model of demography and selection37 to the site frequency spectrum of deletions and duplications in the CEU population, corrected for incomplete ascertainment (Supplementary Methods). We observed the strongest purifying selection acting on exonic CNVs, then intronic CNVs then intergenic CNVs (Fig. 5a). Stronger purifying selection at intronic CNVs than intergenic CNVs has also been observed in Drosophila38 and intronic deletions can be pathogenic if they interfere with proper splicing39. Differences in the ascertainment and in the precision of estimates of key population genetic parameters between CNV and published base substitution data sets render direct comparison of average fitness coefficients between CNVs and substitutions potentially misleading.
Figure 5. Population properties of CNV show functional impact.
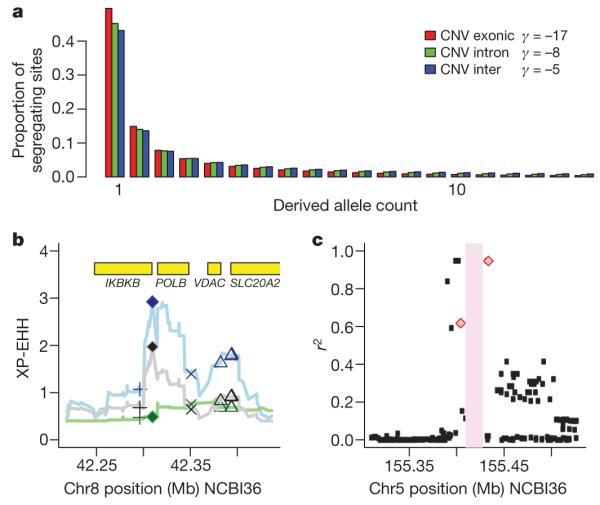
a, Expected derived allele frequency spectrum among 40 CEU chromosomes for different classes of genetic variation, on the basis of the estimated strength of purifying selection acting on each class (see text for details). The estimated value of γ, the average scaled population selection coefficient, is indicated in the legend for each class of variant: exonic (_γ_=−17, P < 10−30), intronic (_γ_=−8, _P_ < 10−10), and intergenic (_γ_=−5, _P_ < 10−30) CNVs. The _P_ values are estimated using a Likelihood Ratio Test of neutrality (_γ_ = 0). If we do not correct for incomplete ascertainment for these three classes of CNV we estimate _γ_ to be −13, −7and −4, respectively. Similarly, if we consider only sites >1 kb, which have more complete ascertainment we estimate γ to be −15, −10 and −5, thus showing this ordering of classes of CNV to be robust. b, A CNV showing increased XP-EHH in analysis of merged SNP-CNV HapMap haplotypes; blue line and symbols, CEU-YRI; grey, CEU-CHB+JPT; green, CHB+JPT-YRI. The locations of potential functional variants are indicated by symbols: filled diamond, CNV; cross, non-synonymous SNP; x, synonymous SNP; triangle, UTR SNP. c, Linkage disequilibrium between CNV2659.1 (pink bar) and multiple sclerosis GWAS hit SNPs (pink diamonds). Near perfect linkage disequilibrium (_r_2 = 0.95) was observed with the top hit SNP (rs47049). Patterns of linkage disequilibrium between the CNV and other HapMap SNPs are shown with black points.
One signal of recent positive selection is an unusually long haplotype around the selected marker, but it is difficult to fine-map the selected variant within such long haplotypes on the basis of population genetic data alone. Large CNVs, by virtue of their potential functional impact, may make a useful first screen for deconstructing such signals. Accordingly, we have surveyed our CNVs for signs of recent positive selection using population differentiation9 and two previously described approaches40,41 relying on haplotype structure (integrated haplotype score: iHS, and cross-population extended haplotype homozygosity: XP-EHH). Several of the CNVs exhibited iHS in the top 1% of the genomic distribution: 7 in CEU, 1 in CHB+JPT, 18 in YRI, all of which seem to represent population-specific signals. The most impressive signal is around CNVR8151.1 in YRI: a standardized iHS of 3.39, in the top 700 out of 2.26 million markers (top 0.03% of the genome). This deletion lies between the APOL2 and APOL4 genes involved in pathogen immunity and previously reported to have been under positive selection in primates42. The top XP-EHH signal is CNVR3685.1, a deletion at >80% frequency in CEU and CHB+JPT but almost absent from YRI, 500 bp 3′ to another immune-related gene, IKBKB (Fig. 5b).
Recent positive selection can also drive increased population differentiation. The VST statistic9 for population differentiation (Fig. 4) is distinct from haplotype-based measures of recent positive selection as it allows assessment of all loci, not just those with biallelic genotype calls (for example, unclusterable events and multiallelic CNVs). The CNV with the highest value of VST between CEU and YRI is an intronic deletion of the PDLIM3 gene, which encodes an abundant protein in skeletal and cardiac muscle. We noted that also among the top five most highly differentiated loci was an intronic VNTR of the gene encoding ACTN2, the sarcomeric protein binding-partner of PDLIM3. Four other pathways with two genes under recent selection have been identified in SNP-based selection scans40,43 (EDAR and EDA2R, SLC24A5 and SLC45A2, NRG and ERBB4, and LARGE and DMD). The possibility that these two highly differentiated CNVs in genes encoding interacting proteins contribute to population44 or individual differences in cardiac or skeletal muscle phenotypes warrants further investigation. Mutations in ACTN3, the close paralogue of ACTN2, alter muscle function in humans and mice45,and a recent study has highlighted an enrichment of genes involved in muscle development among signals of recent positive selection46.
We tested for biases of certain mutation processes or functional locations for CNVs with high _V_ST values. We noted that VNTR are significantly enriched in both tails of the _V_ST distribution (Supplementary Fig. 1.11), whereas CNVs formed by NAHR seem to be uniformly distributed across the spectrum of _V_ST. The enrichment of VNTR in the low end of the _V_ST distribution is expected given the recurrent mutation at these loci, but the enrichment at the highest decile of population differentiation suggests that among all CNVs, VNTR may be enriched for functional impact. The most differentiated CNV between CEU and YRI previously identified9 encompasses the CCL3L1 gene, and remains the most differentiated exonic CNV here. However, we identified 21 more highly differentiated loci, all of which are intronic or intergenic, suggesting a role in gene regulation might underpin any recent positive selection.
Complex trait genetics of CNV
We explored whether the CNVs from this study might be plausible candidates for causal variants for known complex trait associations from genome-wide association studies (GWAS). We examined 1,554 trait-associated SNPs from 279 publications (NHGRI GWAS website47, downloaded on 15 June 2009), In the CEU, 474 out of 1,521 polymorphic trait-associated SNPs fell within a recombination hotspot interval that also contained a CNV. We then examined whether the CNVs in these intervals were in strong linkage disequilibrium with the trait-associated SNP in the different HapMap populations. For genotyped biallelic CNVs we assessed linkage disequilibrium using correlation (_r_2) within phased haplotypes, but to include multiallelic and ungenotyped CNVs in this analysis we also considered the squared Pearson correlation coefficient between the SNP genotypes and the copy number intensity data. We identified 34 trait-associated SNP to CNV correlations with an _r_2 of greater than 0.5, at 30 loci across 22 traits (Fig. 5c, Table 2 and Supplementary Fig. 1.12), five of which were found in the HLA. These CNVs include three previously identified CNV-trait associations13–15, which represent all the positive controls for this analysis, thus the remainder represent plausible candidates for the causal variants. Further fine-mapping experiments in large sample sets are required to assess which variants on these associated haplotypes are indeed causal.
Table 2.
Trait-associated SNPs with possible causal CNVs
| SNP | CNV | Location* | _r_2† | Population‡ | Data§ | Reported gene | Trait | PMID |
|---|---|---|---|---|---|---|---|---|
| rs10492972 | CNVR65.1 | chr1: 10405137–10406094 | 0.92 | CEU | Phased | KIF1B | Multiple sclerosis | 18997785 |
| rs11809207 | CNVR118.1 | chr1: 26332157–26337219 | 0.61 | CEU | Phased | CATSPER4 | Height | 19343178 |
| rs2815752 | CNVR217.1 | chr1: 72538870–72584557 | 0.96 | CEU | Phased | NEGR1 | Body mass index | 19079261 |
| rs7553864 | CNVR240.1 | chr1: 87385827–87386846 | 0.76 | CEU | Intensities | AK002179 | Smoking behaviour | 19247474 |
| rs4085613 | CNVR358.1 | chr1: 150822234–150856715 | 0.97 | CEU | Phased | LCE3D, LCE3A | Psoriasis | 19169255 |
| rs11265260 | CNVR381.1 | chr1: 157915386–157916253 | 0.62 | CHB+JPT | Phased | CRP | C-reactive protein | 18439552 |
| rs12029454 | CNVR384.1 | chr1: 160497369–160497846 | 0.57 | CHB+JPT | Phased | NOS1AP | QT interval | 19305408 |
| rs6725887 | CNVR1111.1 | chr2: 203607766–203612122 | 1.00 | CEU | Phased | WDR12 | Myocardial infarction (early onset) | 19198609 |
| rs9311171 | CNVR1355.1 | chr3: 37953474–37961880 | 1.00 | CHB+JPT | Phased | CTDSPL | Prostate cancer | 17903305 |
| rs3772255 | CNVR1591.1 | chr3: 157574746–157576258 | 0.90 | CEU | Phased | KCNAB1 | Ageing traits | 17903295 |
| rs9291683 | CNVR1819.6 | chr4: 9783252–9843664 | 0.51 | YRI | Intensities | NR | Bone mineral density | 17903296 |
| rs9291683 | CNVR1819.1 | chr4: 9820419–9843664 | 0.51 | YRI | Intensities | NR | Bone mineral density | 17903296 |
| rs401681 | CNVR2293.1 | chr5: 1386043–1386897 | 0.68 | YRI | Intensities | CLPTM1L | Lung cancer | 18978787 |
| rs11747270 | CNVR2646.1 | chr5: 150157836–150161778 | 1.00 | CEU | Phased | IRGM | Crohn’s disease | 18587394 |
| rs11747270 | CNVR2647_full | chr5: 150183562–150203623 | 1.00 | CEU | Phased | IRGM | Crohn’s disease | 18587394 |
| rs4704970 | CNVR2659.1 | chr5: 155409234–155427600 | 0.95 | CEU | Phased | SGCD | Multiple sclerosis (age of onset) | 19010793 |
| rs12191877 | CNVR2841.6 | chr6: 31384505–31397416 | 0.79 | CEU | Phased | HLA-C | Psoriasis | 19169254 |
| rs10484554 | CNVR2841.6 | chr6: 31384505–31397416 | 0.79 | CEU | Phased | HLA-C | AIDS progression | 19115949 |
| rs3129934 | CNVR2845.21 | chr6: 32519885–32887814 | 0.87 | CEU | Phased | HLA-DRB1 | Multiple sclerosis | 18941528 |
| rs9277535 | CNVR2846.3 | chr6: 33156338–33162718 | 0.62 | CEU | Intensities | HLA-DPB1 | Hepatitis B | 19349983 |
| rs9277535 | CNVR2846.5 | chr6: 33159682–33163323 | 0.67 | CEU | Intensities | HLA-DPB1 | Hepatitis B | 19349983 |
| rs210138 | CNVR2850.1 | chr6: 33691917–33693857 | 0.55 | CEU | Phased | BAK1 | Testicular germ cell tumour | 19483681 |
| rs2301436 | CNVR3164.1 | chr6: 167408121–167409138 | 0.71 | CEU | Intensities | CCR6 | Crohn’s disease | 18587394 |
| rs2705293 | CNVR4074.1 | chr8: 138980822–138981379 | 0.51 | YRI | Intensities | AK127771 | Neuroticism | 18762592 |
| rs1602565 | CNVR5123.2 | chr11: 29095953–29096982 | 0.64 | CEU | Intensities | Intergenic | Schizophrenia | 18677311 |
| rs1602565 | CNVR5123.1 | chr11: 29096114–29096643 | 0.61 | CEU | Intensities | Intergenic | Schizophrenia | 18677311 |
| rs7395662 | CNVR5165.1 | chr11: 48557432–48560877 | 1.00 | CEU | Phased | MADD, FOLH1 | HDL cholesterol | 19060911 |
| rs9300212 | CNVR5492.1 | chr12: 33606396–33608182 | 0.84 | CEU | Phased | Intergenic | Cognitive test performance | 17903297 |
| rs1495377 | CNVR5583.1 | chr12:69818942-69819932 | 0.72 | CEU | phased | NR | Type 2 diabetes | 17554300 |
| rs3118914 | CNVR5871.1 | chr13: 49967347–49973131 | 0.69 | CEU | Phased | DLEU7 | Height | 19343178 |
| rs763014 | CNVR6576.1 | chr16: 601068–603588 | 0.68 | CEU | Intensities | RAB40C | Height | 18391950 |
| rs8049607 | CNVR6636.1 | chr16: 11591538–11592052 | 0.88 | CHB+JPT | Phased | LITAF | QT interval | 19305409 |
| rs7188697 | CNVR6746.1 | chr16: 57231107–57233858 | 0.61 | YRI | Phased | NDRG4 | QT interval | 19305409 |
| rs1805007 | CNVR6887.1 | chr16: 88423599–88425903 | 0.87 | CEU | Phased | MC1R | Skin sensitivity to sun | 18488028 |
What, if anything, does the low (<5%) proportion of trait-associated SNPs that might plausibly be tagging a causal CNV tell us about the contribution of common (MAF >5%) CNVs to complex disease susceptibility? The fact that most (77%) of our common genotyped CNVs are well-tagged by SNPs suggests that existing GWAS studies have already indirectly screened for the potential effect of these variants relatively effectively. By modelling the ascertainment of genotyped CNVs in this study (Supplementary Methods), we estimate that we have genotyped ~25–35% of all common CNVs greater than 1 kb in size. Thus, unless ungenotyped and poorly tagged common CNVs have a much higher effect on disease risk than the well-tagged common CNVs we were able to genotype, extrapolating from our incomplete ascertainment of CNV could only explain a small minority of the disease risk already accounted for existing GWAS studies, let alone the larger (for most diseases) bulk of ‘missing’ heritability that remains unaccounted for by GWASs. Further large-scale association studies that directly assay all classes of CNV are required to precisely estimate the contribution of common CNVs to the heritability of complex traits.
Conclusions and discussion
We have discovered an unprecedented number of CNVs and assembled a reference set of genotypes from new genotyping plat-forms developed from this information. These new resources will facilitate association studies of CNVs in human disease, including using imputation of CNV genotypes into the hundreds of thousands of genomes that have already been densely genotyped.
Despite being the most comprehensive population-based CNV map so far, still to be well-characterized are CNVs <500 bp, insertions of new sequences relative to the reference sequence, subtle changes in the total number of copies of high-copy number dispersed repeats such as _Alu_ elements and LINEs, and CNVs on the Y chromosome and heterochromatic regions. Notwithstanding, we estimate that in this study we have discovered about 80–90% of common CNVs (MAF > 5%) greater than 1 kb in length, and have been able to genotype approximately 40% of these (Supplementary Methods). The remaining CNVs will probably be best captured by genome sequencing experiments.
The CNVs most difficult to genotype directly were duplications and multiallelic loci (including VNTR). They are also the categories of CNVs least likely to be tagged well by SNPs, and therefore most likely to be overlooked by linkage-disequilibrium-based association testing. The observation that VNTR are enriched among loci exhibiting high population differentiation provides evidence for the functional importance of this CNV class, which highlights the need for development of genome-wide assays for incorporating this often recalcitrant class of variants into human genetic studies.
We found that the mutational mechanisms generating CNVs vary depending on the different size of the genomic alteration. NAHR has more of a role in larger CNV formation, whereas VNTR and dispersed duplications (whose role in CNV formation was previously under-appreciated) are more commonly observed with smaller CNVs. Although some sequence motifs (for example, some non-B-DNA structures) were more mutagenic than others, the sequence context was not strongly predictive of the location of CNVs, unlike the link between segmental duplications and larger CNVs mediated by NAHR.
We observed that non-B-DNA forming sequences that are enriched in promoter regions are also enriched in CNV breakpoints, suggesting that the same properties that enable regulation of transcription may also be mildly mutagenic for the formation of CNVs, and as a consequence, CNVs may influence the evolution of gene regulation. We also discovered that there are substantive differences in both the mutation mechanisms and the selection pressures of deletions and duplications.
Despite the fact that we identified several new CNVs that are potential causal variants on trait-associated haplotypes, collectively these CNVs could explain less than 5% of previously reported GWAS hits. Nonetheless, these observations emphasize the need to consider all classes of variation (SNPs and all structural variants, common and rare) when fine-mapping causal variants within association intervals. Sequence insertions relative to the reference sequence represent a particular challenge for both fine-mapping and association studies, because their presence on an associated haplotype might be easily overlooked.
Our results provide some guidance as to how resources might best be targeted to identify genetic variation underlying the ‘missing’ heritability for complex traits that remains unexplained by recent GWAS. Although common CNVs seem highly unlikely to account for much of this missing heritability, the striking strength of purifying selection acting on exonic and intronic deletions suggests that CNVs might contribute appreciably to rare variants involved in common and rare diseases, and that study designs that focus on ascertaining rare sequence and structural variants will maximise power to detect new causal variation.
METHODS SUMMARY
Samples
HapMap and Polymorphism Discovery Resource DNA samples were obtained from the Coriell Cell Repository. The reference DNA in genotyping experiments on the Agilent 105K array was a pool of 10 genomic cell-line DNAs from the European Collection of Cell Cultures.
CNV discovery experiments
Probes on the 20 array set were designed with a relaxed threshold for multiple matches to the reference genome to maximise coverage and allow screening of moderately repetitive sequences. The array data were generated at NimbleGen’s Icelandic service facility. Experiments were repeated and quality-control filters were applied to improve the data consistency. Data were normalized to minimize variation between experiments; putative CNVs were detected as chromosomal segments with unusually high or low log2 ratios of fluorescent intensity between the test and reference genomes using the genome alteration detection analysis (GADA) algorithm48. Further filtering reduced false positives.
Validation experiments
qPCR experiments were performed by Applied Biosystems. Further validation was conducted by Sequenom and the co-authors of this paper.
CNV genotyping experiments
The Agilent 105K CNV genotyping array was designed by the WTCCC in collaboration with the other co-authors of this paper. After pilot experiments, each locus was targeted with at least 10 probes. Agilent array data were generated by Oxford Gene Technologies at their UK service facility as part of the pipeline developed for the large WTCCC association experiment (pipeline to be described elsewhere). We assessed the quality of the experiments on the 450 HapMap samples and repeated 90 poorer quality experiments to improve data consistency. The Illumina 660W array data were generated by Illumina Inc.
Statistical and population analysis
We devised statistical methods for CNV genotyping, absolute copy number estimation, breakpoint enrichment testing, and estimation of discovery power. We phased CNVs and SNPs into haplotypes using BEAGLE 3.0.3 (ref. 49), and used NestedMICA31 for breakpoint motif discovery.
Supplementary Material
Supplementary methods
Supplementary notes
Acknowledgements
We would like to thank A. Boyko, J. J. Emerson, J. Pickrell, S. Kudaravalli, J. Pritchard, T. Down, S. McCarroll, J. Collins, C. Beazley, M. Dermitzakis, P. Eis, T. Richmond, M. Hogan, D. Bailey, S. Giles, G. Speight, N. Sparkes, D. Peiffer, C. Chen, K. Li, P. Oeth, D. Stetson and D. Church for advice, sharing data, sharing software and technical assistance. We are grateful for the efforts and support of our colleagues at NimbleGen, Agilent, Illumina, Applied Biosystems and Sequenom. We thank J. Barrett for comments on an earlier version of the manuscript. The Centre for Applied Genomics at the Hospital for Sick Children and Wellcome Trust Sanger Institute are acknowledged for database, technical assistance and bioinformatics support. This research was supported by the Wellcome Trust (grant no. 077006/Z/05/Z; to M.E.H., N.P.C., C.T.-S.), Canada Foundation of Innovation and Ontario Innovation Trust (to S.W.S.), Canadian Institutes of Health Research (CIHR) (to S.W.S.), Genome Canada/Ontario Genomics Institute (to S.W.S.), the McLaughlin Centre for Molecular Medicine (to S.W.S.), Ontario Ministry of Research and Innovation (to S.W.S.), the Hospital for Sick Children Foundation (to S.W.S.), the Department of Pathology at Brigham and Women’s Hospital (to C.L.) and the National Institutes of Health (NIH) (grants HG004221 and GM081533; to C.L.). K.K. is supported by the Academy of Finland. D.P. is supported by fellowships from the Royal Netherlands Academy of Arts and Sciences (TMF/DA/5801) and the Netherlands Organization for Scientific Research (Rubicon 825.06.031). S.W.S. holds theGlaxoSmithKline Pathfinder Chair in Genetics and Genomics at the University of Toronto and the Hospital for Sick Children.
Footnotes
Supplementary Information is linked to the online version of the paper at www.nature.com/nature.
Author Contributions C.T.-S., N.P.C., C.L., S.W.S. and M.E.H. are all joint senior authors, and planned and managed the project. D.F.C. and D.P. lead the data analysis. Data analyses were performed by D.F.C., D.P., R.R., L.F., O.G., Y.Z., J.A., T.D.A., C.B., P.C., T.F., M.H., C.H.I., K.K., D.G.M., J.R.M., I.O., A.W.C.P., S.R., K.S., A.V., K.W., J.W. and M.E.H. The WTCCC collaborated on array design. Validation experiments were performed by Y.Z. and M.H. D.F.C., D.P., S.W.S. and M.E.H. wrote the paper.
References
- 1.International Human Genome Sequencing Consortium Finishing the euchromatic sequence of the human genome. Nature. 2004;431:931–945. doi: 10.1038/nature03001. [DOI] [PubMed] [Google Scholar]
- 2.Levy S, Strausberg RL. Human genetics: Individual genomes diversify. Nature. 2008;456:49–51. doi: 10.1038/456049a. [DOI] [PubMed] [Google Scholar]
- 3.Frazer KA, et al. A second generation human haplotype map of over 3 million SNPs. Nature. 2007;449:851–861. doi: 10.1038/nature06258. [DOI] [PMC free article] [PubMed] [Google Scholar]
- 4.Marchini J, et al. A new multipoint method for genome-wide association studies by imputation of genotypes. Nature Genet. 2007;39:906–913. doi: 10.1038/ng2088. [DOI] [PubMed] [Google Scholar]
- 5.Levy S, et al. The diploid genome sequence of an individual human. PLoS Biol. 2007;5:e254. doi: 10.1371/journal.pbio.0050254. [DOI] [PMC free article] [PubMed] [Google Scholar]
- 6.Wheeler DA, et al. The complete genome of an individual by massively parallel DNA sequencing. Nature. 2008;452:872–876. doi: 10.1038/nature06884. [DOI] [PubMed] [Google Scholar]
- 7.Conrad DF, et al. A high-resolution survey of deletion polymorphism in the human genome. Nature Genet. 2006;38:75–81. doi: 10.1038/ng1697. [DOI] [PubMed] [Google Scholar]
- 8.McCarroll SA, et al. Integrated detection and population-genetic analysis of SNPs and copy number variation. Nature Genet. 2008;40:1166–1174. doi: 10.1038/ng.238. [DOI] [PubMed] [Google Scholar]
- 9.Redon R, et al. Global variation in copy number in the human genome. Nature. 2006;444:444–454. doi: 10.1038/nature05329. [DOI] [PMC free article] [PubMed] [Google Scholar]
- 10.Hurles ME, Dermitzakis ET, Tyler-Smith C. The functional impact of structural variation in humans. Trends Genet. 2008;24:238–245. doi: 10.1016/j.tig.2008.03.001. [DOI] [PMC free article] [PubMed] [Google Scholar]
- 11.Stranger BE, et al. Relative impact of nucleotide and copy number variation on gene expression phenotypes. Science. 2007;315:848–853. doi: 10.1126/science.1136678. [DOI] [PMC free article] [PubMed] [Google Scholar]
- 12.Buchanan JA, Scherer SW. Contemplating effects of genomic structural variation. Genet. Med. 2008;10:639–647. doi: 10.1097/gim.0b013e318183f848. [DOI] [PubMed] [Google Scholar]
- 13.McCarroll SA, et al. Deletion polymorphism upstream of IRiGM associated with altered IRGM expression and Crohn’s disease. Nature Genet. 2008;40:1107–1112. doi: 10.1038/ng.215. [DOI] [PMC free article] [PubMed] [Google Scholar]
- 14.Willer CJ, et al. Six new loci associated with body mass index highlight a neuronal influence on body weight regulation. Nature Genet. 2009;41:25–34. doi: 10.1038/ng.287. [DOI] [PMC free article] [PubMed] [Google Scholar]
- 15.de Cid R, et al. Deletion of the late cornified envelope LCE3B and LCE3C genes as a susceptibility factor for psoriasis. Nature Genet. 2009;41:211–215. doi: 10.1038/ng.313. [DOI] [PMC free article] [PubMed] [Google Scholar]
- 16.Yang TL, et al. Genome-wide copy-number-variation study identified a susceptibility gene, UGT2B17, for osteoporosis. Am. J. Hum. Genet. 2008;83:663–674. doi: 10.1016/j.ajhg.2008.10.006. [DOI] [PMC free article] [PubMed] [Google Scholar]
- 17.Lee C, Iafrate AJ, Brothman AR. Copy number variations and clinical cytogenetic diagnosis of constitutional disorders. Nature Genet. 2007;39(suppl):S48–S54. doi: 10.1038/ng2092. [DOI] [PubMed] [Google Scholar]
- 18.Kidd JM, et al. Mapping and sequencing of structural variation from eight human genomes. Nature. 2008;453:56–64. doi: 10.1038/nature06862. [DOI] [PMC free article] [PubMed] [Google Scholar]
- 19.Korbel JO, et al. Paired-end mapping reveals extensive structural variation in the human genome. Science. 2007;318:420–426. doi: 10.1126/science.1149504. [DOI] [PMC free article] [PubMed] [Google Scholar]
- 20.Gu W, Zhang F, Lupski JR. Mechanisms for human genomic rearrangements. Pathogenetics. 2008;1:4. doi: 10.1186/1755-8417-1-4. [DOI] [PMC free article] [PubMed] [Google Scholar]
- 21.Barnes C, et al. A robust statistical method for case-control association testing with copy number variation. Nature Genet. 2008;40:1245–1252. doi: 10.1038/ng.206. [DOI] [PMC free article] [PubMed] [Google Scholar]
- 22.Lohmueller KE, et al. Proportionally more deleterious genetic variation in European than in African populations. Nature. 2008;451:994–997. doi: 10.1038/nature06611. [DOI] [PMC free article] [PubMed] [Google Scholar]
- 23.Ng PC, et al. Genetic variation in an individual human exome. PLoS Genet. 2008;4:e1000160. doi: 10.1371/journal.pgen.1000160. [DOI] [PMC free article] [PubMed] [Google Scholar]
- 24.Kim PM, Korbel JO, Gerstein MB. Positive selection at the protein network periphery: evaluation in terms of structural constraints and cellular context. Proc. Natl Acad. Sci. USA. 2007;104:20274–20279. doi: 10.1073/pnas.0710183104. [DOI] [PMC free article] [PubMed] [Google Scholar]
- 25.Tuzun E, et al. Fine-scale structural variation of the human genome. Nature Genet. 2005;37:727–732. doi: 10.1038/ng1562. [DOI] [PubMed] [Google Scholar]
- 26.Jeffreys AJ, et al. Human minisatellites, repeat DNA instability and meiotic recombination. Electrophoresis. 1999;20:1665–1675. doi: 10.1002/(SICI)1522-2683(19990101)20:8<1665::AID-ELPS1665>3.0.CO;2-L. [DOI] [PubMed] [Google Scholar]
- 27.Bacolla A, Wells RD. Non-B DNA conformations, genomic rearrangements, and human disease. J. Biol. Chem. 2004;279:47411–47414. doi: 10.1074/jbc.R400028200. [DOI] [PubMed] [Google Scholar]
- 28.Myers S, et al. A common sequence motif associated with recombination hot spots and genome instability in humans. Nature Genet. 2008;40:1124–1129. doi: 10.1038/ng.213. [DOI] [PubMed] [Google Scholar]
- 29.Jeffreys AJ, et al. Meiotic recombination hot spots and human DNA diversity. Phil. Trans. R. Soc. Lond. B. 2004;359:141–152. doi: 10.1098/rstb.2003.1372. [DOI] [PMC free article] [PubMed] [Google Scholar]
- 30.Huppert JL, Balasubramanian S. G-quadruplexes in promoters throughout the human genome. Nucleic Acids Res. 2007;35:406–413. doi: 10.1093/nar/gkl1057. [DOI] [PMC free article] [PubMed] [Google Scholar]
- 31.Down TA, Hubbard TJ. NestedMICA: sensitive inference of over-represented motifs in nucleic acid sequence. Nucleic Acids Res. 2005;33:1445–1453. doi: 10.1093/nar/gki282. [DOI] [PMC free article] [PubMed] [Google Scholar]
- 32.Sen SK, et al. Human genomic deletions mediated by recombination between Alu elements. Am. J. Hum. Genet. 2006;79:41–53. doi: 10.1086/504600. [DOI] [PMC free article] [PubMed] [Google Scholar]
- 33.Tian D, et al. Single-nucleotide mutation rate increases close to insertions/ deletions in eukaryotes. Nature. 2008;455:105–108. doi: 10.1038/nature07175. [DOI] [PubMed] [Google Scholar]
- 34.Campbell PJ, et al. Identification of somatically acquired rearrangements in cancer using genome-wide massively parallel paired-end sequencing. Nature Genet. 2008;40:722–729. doi: 10.1038/ng.128. [DOI] [PMC free article] [PubMed] [Google Scholar]
- 35.Pickeral OK, Makalowski W, Boguski MS, Boeke JD. Frequent human genomic DNA transduction driven by LINE-1 retrotransposition. Genome Res. 2000;10:411–415. doi: 10.1101/gr.10.4.411. [DOI] [PMC free article] [PubMed] [Google Scholar]
- 36.Gondo Y, et al. High-frequency genetic reversion mediated by a DNA duplication: the mouse pink-eyed unstable mutation. Proc. Natl Acad. Sci. USA. 1993;90:297–301. doi: 10.1073/pnas.90.1.297. [DOI] [PMC free article] [PubMed] [Google Scholar]
- 37.Boyko AR, et al. Assessing the evolutionary impact of amino acid mutations in the human genome. PLoS Genet. 2008;4:e1000083. doi: 10.1371/journal.pgen.1000083. [DOI] [PMC free article] [PubMed] [Google Scholar]
- 38.Emerson JJ, Cardoso-Moreira M, Borevitz JO, Long M. Natural selection shapes genome-wide patterns of copy-number polymorphism in Drosophila melanogaster. Science. 2008;320:1629–1631. doi: 10.1126/science.1158078. [DOI] [PubMed] [Google Scholar]
- 39.Wang LL, et al. Intron-size constraint as a mutational mechanism in Rothmund-Thomson syndrome. Am. J. Hum. Genet. 2002;71:165–167. doi: 10.1086/341234. [DOI] [PMC free article] [PubMed] [Google Scholar]
- 40.Sabeti PC, et al. Genome-wide detection and characterization of positive selection in human populations. Nature. 2007;449:913–918. doi: 10.1038/nature06250. [DOI] [PMC free article] [PubMed] [Google Scholar]
- 41.Voight BF, Kudaravalli S, Wen X, Pritchard JK. A map of recent positive selection in the human genome. PLoS Biol. 2006;4:e72. doi: 10.1371/journal.pbio.0040072. [DOI] [PMC free article] [PubMed] [Google Scholar]
- 42.Smith EE, Malik HS. The apolipoprotein L family of programmed cell death and immunity genes rapidly evolved in primates at discrete sites of host-pathogen interactions. Genome Res. 2009;19:850–858. doi: 10.1101/gr.085647.108. [DOI] [PMC free article] [PubMed] [Google Scholar]
- 43.Pickrell JK, et al. Signals of recent positive selection in a worldwide sample of human populations. Genome Res. 2009;19:826–837. doi: 10.1101/gr.087577.108. [DOI] [PMC free article] [PubMed] [Google Scholar]
- 44.Silva AM, et al. Ethnicity-related skeletal muscle differences across the lifespan. Am. J. Hum. Biol. 2009 Jun 16; doi: 10.1002/ajhb.20956. doi:10.1002/ajhb.20956. [DOI] [PMC free article] [PubMed] [Google Scholar]
- 45.MacArthur DG, et al. Loss of ACTN3 gene function alters mouse muscle metabolism and shows evidence of positive selection in humans. Nature Genet. 2007;39:1261–1265. doi: 10.1038/ng2122. [DOI] [PubMed] [Google Scholar]
- 46.Nielsen R, et al. Darwinian and demographic forces affecting human protein coding genes. Genome Res. 2009;19:838–849. doi: 10.1101/gr.088336.108. [DOI] [PMC free article] [PubMed] [Google Scholar]
- 47.Hindorff LA, et al. Potential etiologic and functional implications of genome-wide association loci for human diseases and traits. Proc. Natl Acad. Sci. USA. 2009;106:9362–9367. doi: 10.1073/pnas.0903103106. [DOI] [PMC free article] [PubMed] [Google Scholar]
- 48.Pique-Regi R, et al. Sparse representation and Bayesian detection of genome copy number alterations from microarray data. Bioinformatics. 2008;24:309–318. doi: 10.1093/bioinformatics/btm601. [DOI] [PMC free article] [PubMed] [Google Scholar]
- 49.Browning SR, Browning BL. Rapid and accurate haplotype phasing and missing-data inference for whole-genome association studies by use of localized haplotype clustering. Am. J. Hum. Genet. 2007;81:1084–1097. doi: 10.1086/521987. [DOI] [PMC free article] [PubMed] [Google Scholar]
- 50.Iafrate AJ, et al. Detection of large-scale variation in the human genome. Nature Genet. 2004;36:949–951. doi: 10.1038/ng1416. [DOI] [PubMed] [Google Scholar]
Associated Data
This section collects any data citations, data availability statements, or supplementary materials included in this article.
Supplementary Materials
Supplementary methods
Supplementary notes