Structural basis for conformational switching and GTP loading of the large G protein atlastin (original) (raw)
Abstract
Atlastin, a member of the dynamin superfamily, is known to catalyse homotypic membrane fusion in the smooth endoplasmic reticulum (ER). Recent studies of atlastin have elucidated key features about its structure and function; however, several mechanistic details, including the catalytic mechanism and GTP hydrolysis-driven conformational changes, are yet to be determined. Here, we present the crystal structures of atlastin-1 bound to GDP·AlF4− and GppNHp, uncovering an intramolecular arginine finger that stimulates GTP hydrolysis when correctly oriented through rearrangements within the G domain. Utilizing Förster Resonance Energy Transfer, we describe nucleotide binding and hydrolysis-driven conformational changes in atlastin and their sequence. Furthermore, we discovered a nucleotide exchange mechanism that is intrinsic to atlastin’s N-terminal domains. Our results indicate that the cytoplasmic domain of atlastin acts as a tether and homotypic interactions are timed by GTP binding and hydrolysis. Perturbation of these mechanisms may be implicated in a group of atlastin-associated hereditary neurodegenerative diseases.
Keywords: endoplasmic reticulum, membrane fusion, protein structure
Introduction
Hereditary Spastic Paraplegia (HSP) is a progressive spastic weakness of the lower extremities due to the degeneration of axons in corticospinal motor neurons at their distal ends (Fink, 2006; Salinas et al, 2008). While it is a rare disease, affecting 2–7.4 in 100 000 people (Polo et al, 1991; Filla et al, 1992; Fink, 2006; Depienne et al, 2007), extensive genetic studies have revealed several hot spots associated with the disease, with >50% of cases caused by mutations in just three loci: Spastin-1, REEP-1, and atlastin-1 (Zhao et al, 2001; Depienne et al, 2007). Atlastin-1/SPG3A mutations account for ∼10% of autosomal dominant HSP cases; however, this locus is the primary site for mutations in children affected with the disease (Namekawa et al, 2006). Mutations in atlastin-1 have also been detected in patients suffering from hereditary sensory neuropathy (HSN), a related neurodegenerative disorder affecting lower motor neurons (Leonardis et al, 2012).
Atlastin-1 is found in neurons at the cis-Golgi, endoplasmic reticulum (ER), and axon growth cones, where it is part of a complex containing spastin, reticulons, and REEP proteins (Evans et al, 2006; Sanderson et al, 2006; Hu et al, 2009; Park et al, 2010). Atlastins and reticulons are involved in generating and maintaining the tubular ER network (Namekawa, 2007; Rismanchi et al, 2008; Hu et al, 2009; Orso et al, 2009; Park et al, 2010), where atlastin promotes homotypic fusion of membranes, generating three-way junctions (Hu et al, 2009; Orso et al, 2009). On a molecular level, atlastins are related to large G proteins such as dynamin, MxA, GBP1, and mitofusin, many of which are involved in membrane fission or fusion (Praefcke et al, 2004). Structural studies on near full-length dynamin, MxA, and GBP1 revealed remarkable similarities to atlastin regarding the molecular architecture of the G proteins (Prakash et al, 2000; Ghosh et al, 2006; Chappie et al, 2010; Bian et al, 2011; Byrnes and Sondermann, 2011; Chappie et al, 2011; Faelber et al, 2011; Ford et al, 2011; Gao et al, 2011). All the proteins of this family contain a globular G domain followed by an α-helical, stalk-like middle domain (Figure 1A). For dynamin, the prototypical member of this family, GTP hydrolysis is coupled to conformational changes that alter the position of the stalk-like domain (called the bundle signalling element or BSE) relative to the G domain dimer (Chappie et al, 2011; Faelber et al, 2011; Ford et al, 2011), yet full activation requires a membrane-dependent, higher order assembly (Warnock et al, 1996; Stowell et al, 1999; Zhang and Hinshaw, 2001; Bashkirov et al, 2008; Pucadyil and Schmid, 2008; Kenniston and Lemmon, 2010; Chappie et al, 2011; Faelber et al, 2011; Ford et al, 2011; Liu et al, 2011).
Figure 1.
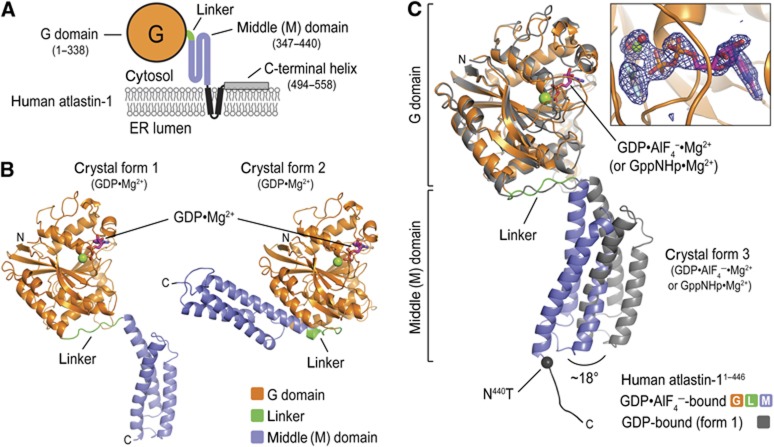
Structures of atlastin-1. (A) Topology of atlastin-1. The globular G domain (orange) is connected to the middle domain (blue) by a short linker (green). This N-terminal, cytoplasmic unit is followed by two transmembrane α helices (black) and a C-terminal amphipathic helix (grey), which has been shown to interact with the lipid membrane. (B) Protomer structures of crystal forms 1 and 2. The GDP-bound structures of atlastin-11–446 were aligned relative to their G domains (Byrnes and Sondermann, 2011). Nucleotide and Mg2+ are shown as sticks and spheres, respectively. (C) Protomer structures of crystal form 3. The GDP·AlF4−-bound form 3 structure of atlastin-11–446-N440T was superimposed on the GDP-bound form 1 structure with the G domain as the reference. The form 1 structure is shown in grey and the form 3 structure is coloured according to (A). Position of missense mutation in form 3 structure is indicated and its Cα is shown as a black sphere. An _F_o−_F_c omit map for the nucleotide (inset) is contoured at 4.0 sigma.
A prominent feature of several dynamin superfamily proteins is the oligomerization-dependent activation of their GTPase activity, which is in contrast to small GTPases that rely on the action of heterologous GTPase activating proteins (Song et al, 2004; Low and Löwe, 2006; Gasper et al, 2009; Orso et al, 2009). Recent studies yielded the first crystal structures of atlastin (forms 1 and 2 with a ‘disengaged’ and ‘engaged’ middle domain, respectively, relative to their G domain; Figure 1B), revealing two dimeric conformations that presumably represent a pre- and post-fusion states and hint at an overall conserved mechanism (Bian et al, 2011; Byrnes and Sondermann, 2011). These studies also suggested a model by which GTP binding tethers two opposing membranes via G domain dimerization, with GTP hydrolysis being coupled to intramolecular conformational changes that drive membrane fusion (Hu et al, 2011). However, the structures depict only GDP-bound states, hence, the exact catalytic mechanism for atlastin and the concurrent conformational switching upon GTP hydrolysis remained unknown. It has also been established that the middle domain is required for dimerization and GTPase activity (Morin-Leisk et al, 2011; Moss et al, 2011; Pendin et al, 2011), the reason for which is not obvious from the initial models. In addition, a recent report demonstrated, using single-particle electron microscopy, that atlastin-2 bound to the GTP-mimic GppNHp adopts both the presumed pre- and post-fusion conformations, the latter of which depends on an intramolecular salt bridge between the middle domain and the adjacent linker (Morin-Leisk et al, 2011). The authors argued that GTP hydrolysis might not be the direct trigger for conformational changes leading to fusion. While this presents an apparent contradiction to earlier studies (Bian et al, 2011; Byrnes and Sondermann, 2011), we now present an alternative model based on novel crystal structures and approaches that report on dynamic changes and kinetics within the cytoplasmic, N-terminal module of human atlastin-1. Our studies address several fundamental questions regarding the intrinsic regulation of atlastin with relevance to the mechanism of membrane fusion, in particular: (1) the molecular basis for GTP hydrolysis; (2) the conformational changes and their timing along atlastin’s GTPase cycle; and (3) the surprising discovery of an intrinsic, middle domain-mediated mechanism for GTP loading in atlastin.
Results and discussion
Crystallization of atlastin-1 bound to GppNHp and GDP·AlF4−
We determined two sets of crystal structures for the N-terminal, cytoplasmic module of human atlastin-1 comprising the G and middle domains (residues 1–446), bound to a transition state analogue GDP·AlF4− or non-hydrolysable GTP-mimic GppNHp (Supplementary Table 1). For the first set, we used the HSP disease mutant variant N440T (space group P21212; 4 molecules/asymmetric unit), while the second set made use of the wild-type protein containing a C-terminal hexahistidine tag (space group P212121; 2 molecules/asymmetric unit). Crystallization conditions differed between the mutant and wild-type proteins, but for each variant the conditions were nearly identical for both nucleotide-bound states. The different conditions and constructs resulted in unique crystal packing interactions for N440T and wild-type atlastin-1 variants, respectively (Supplementary Figures 1 and 2). Nevertheless, the conformation of the protomers and dimeric assemblies within the crystals were virtually identical in all four crystal structures (Supplementary Table 2), with the exception of the identity of the bound nucleotide and the extreme C-termini that contain either the N440T mutation or the hexahistidine tag (and are involved in specific crystal lattice contacts) (Supplementary Figures 1 and 2). The crystallographic data suggest nucleotide-bound dimers as the biologically relevant unit, which is supported by size-exclusion chromatography-coupled static multi-angle light scattering (SEC-MALS), a method for determining the absolute molecular weight of particles in solution. In these experiments, there is no evidence of higher order oligomerization beyond dimers for the soluble, wild-type protein or the N440T mutant variant when bound to GppNHp or GDP·AlF4− (Supplementary Figure 3). We chose the atlastin N440T mutant bound to GDP·AlF4− for our illustration of this particular state, yet the crystallographic results apply to all four structures considering the striking similarities between them. We refer to this state as crystal form 3.
The structures reveal several previously unseen features that provide novel insights into the catalytic mechanism of atlastin-mediated membrane fusion, which will be discussed in detail below. Notably, we observe clear density for the γ-phosphate or AlF4− moiety, in the GppNHp- and GDP·AlF4−-bound structures, respectively (Figure 1C). Dimerization in solution is only observed in the presence of GppNHp or GDP·AlF4−, but not in the apo state or when bound to GDP (Byrnes and Sondermann, 2011), indicating that we crystallized a physiologically relevant conformation. In addition, we observe conformational changes of the G domain’s switch regions and G domain dimer interface associated with GTP analogue binding. Overall, the form 3 crystal structure is most similar in conformation to the previously determined, GDP-bound form 1 structure, characterized by the middle domain being dislodged from the G domain, with one difference being an 18° rigid-body rotation of the middle domain relative to the G domain (Figure 1C).
Extensive dimerization in the GppNHp and transition state-bound structure
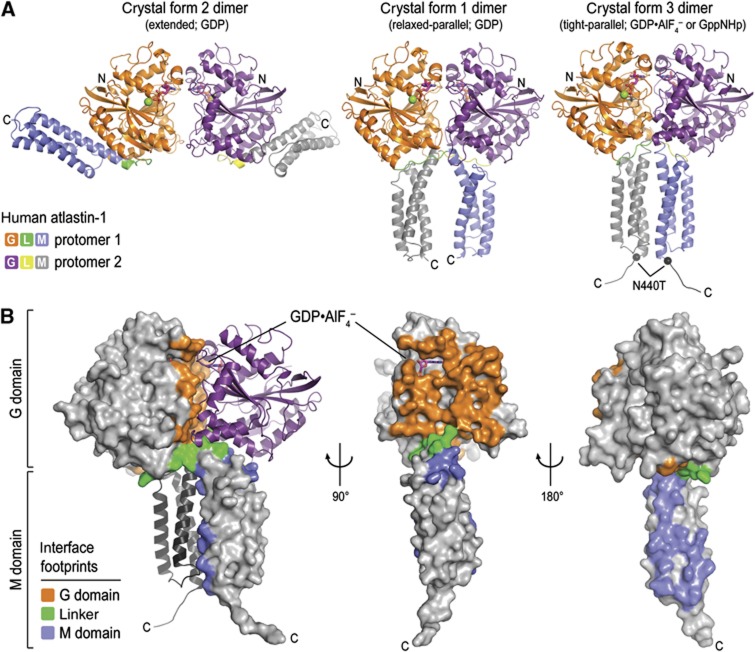
Distinct crystallographic dimers of GDP-bound atlastin-1 were apparent in the previously determined structures (form 1, ‘relaxed-parallel’; form 2, ‘extended’; Figure 2A) (Bian et al, 2011; Byrnes and Sondermann, 2011). Both had dimerized G domains, but they differed in the spatial arrangement of their middle domains. In the form 2 dimer, the middle domains fold back onto and are engaged with their respective G domains, with the C-termini pointing in opposite directions. In contrast, the protomers in the form 1 dimer are crisscrossed with the middle domains running in parallel without interacting with each other. Despite the new form 3 dimer having similar topology to the original GDP-bound form 1, the interfaces are quite different. In general, the interfacial area is larger in the structures of atlastin bound to GppNHp and GDP·AlF4− than in the GDP-bound models (3852 versus 2797 Å2), both considering the G domain dimerization as well as the interactions between the middle domains (G domain dimer: 1886 versus 1226 Å2; linker/middle domain dimer: 1257 versus 406 Å2). The middle domains in the parallel dimers interact at the crossover point, which involves the linker between the G and middle domains (Figure 2). In addition, the interfacial surface extends to the first and third helix of the middle domains in the form 3 dimer (Figure 2B), forming a tight-parallel state with respect to middle domain packing and orientation, respectively. The more extensive buried surface area in the tight-parallel form 3 dimer is consistent with atlastin’s ability to dimerize in solution in the presence of GppNHp and GDP·AlF4− (Supplementary Figure 3A; Byrnes and Sondermann, 2011).
Figure 2.
Crystallographic dimers of atlastin-11–446. (A) Atlastin-1 dimers. Crystallographic dimers observed in crystal form 2 (extended, P212121 symmetry, left), form 1 (relaxed-parallel, P6522 symmetry, middle), and form 3 (tight-parallel, P21212 symmetry, right) are shown. Bound nucleotides and metal ions are shown as sticks and spheres, respectively. (B) Crystal form 3 dimer interface. Interface residues are shown in colour on the surface of one half of the dimer.
The catalytic mechanism of atlastin-1
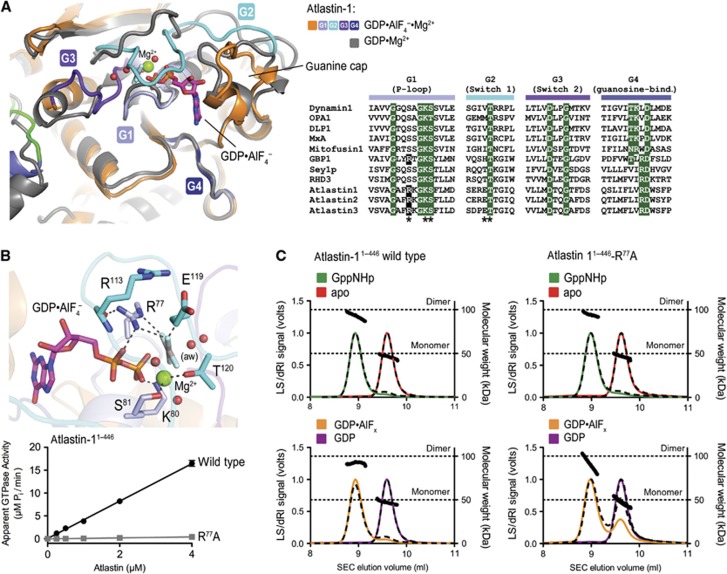
As with other G proteins, binding of GTP and transition state analogues, GppNHp or GDP·AlF4−, respectively, has profound effects on the conformation of the switch regions within the G domain of atlastin (Figure 3). While the GDP-bound G domains adopt a somewhat open conformation with regard to the nucleotide-binding pocket, switch motifs G2 (switch 1) and G3 (switch 2) in the newly determined structures undergo major conformational changes, folding over the phosphate and AlF4− moieties (Figure 3A). The conformational change positions R77 of the G1 motif (P-loop) above the phosphate moiety, with the guanidinium group interacting with the α- and γ-phosphate (or AlF4−) of the nucleotide (Figure 3B), establishing its role as a catalytic arginine finger. R77 is conserved in the atlastin and GBP families of dynamin-related proteins, but not in dynamins, mitofusins, MxA, or Sey1p, a functional atlastin paralogue in yeast (Figure 3A; Hu et al, 2009). This observation suggests that GBP and atlastin are more closely related and use an intramolecular arginine finger, whereas Sey1p employs a catalytic mechanism potentially involving an accessory metal ion and residues of an adjacent G domain within a dimeric assembly, as has been described for dynamin (Chappie et al, 2010).
Figure 3.
Catalytic mechanism of atlastin-1. (A) Conformational changes upon GTP analogue binding. The conformational changes in the nucleotide binding site between GDP-bound form 1 (grey) versus GDP·AlF4−-bound form 3 (coloured) are shown after superpositioning of the respective G domains. Nucleotide binding and switch motifs (motifs G1–G4) of the form 3 crystal structure are coloured in shades of blue. On the right, a sequence alignment of several dynamin superfamily members shows conserved regions involved in nucleotide binding and hydrolysis. Strictly conserved residues are highlighted in green. Residues shown in (B) are marked with an asterisk. (B) Residues involved in nucleotide hydrolysis. The nucleotide binding pocket of crystal form 3 (upper) is shown, with residues making direct or indirect contacts with the phosphate groups of the nucleotide analogue are shown as sticks. Mg2+ is shown as a green sphere. The attacking water molecule (labelled ‘aw’) and Mg2+-coordinating water molecules are shown as red spheres. Mutation of R77 to alanine abolishes GTPase activity (lower panel). The GTPase activity was determined by measuring the production of inorganic phosphate over time at various protein concentrations. (C) Nucleotide-dependent oligomerization of atlastin-11–446-R77A SEC-MALS data for wild-type (left panels) and mutant (R77A, right panels) atlastin-11–446 is shown. The signal from the 90°-light scattering detector and refractive index detector is shown as coloured, solid lines (apo, red; GppNHp bound, green; GDP bound, purple; GDP·AlFx bound, orange) and black, dashed lines, respectively (left Y axis). Average molecular weight calculations across the protein peak are shown as black circles (right Y axis). The theoretical molecular weight (based on primary sequence) for the monomer and dimer is shown as horizontal dashed lines. Proteins (30–40 μM) were incubated with nucleotides (2 mM) at least 30 min prior to SEC-MALS analysis.
It is worth noting that in the GDP-bound structures, the side chain of R77 is surface exposed and forms a salt bridge with a glutamate residue of an adjacent G domain, and hence is central to the G domain dimer interface in these structures (Bian et al, 2011; Byrnes and Sondermann, 2011). In our previous study, we introduced a charge-reversal mutation at position R77 (R77E) to probe its involvement in dimerization of the N-terminal, cytoplasmic module used for crystallization. We noticed a markedly destabilized GppNHp-bound dimer and no dimerization in the presence of GDP·AlFx (Byrnes and Sondermann, 2011). The mutant protein is also devoid of enzymatic activity and binds nucleotide poorly (Bian et al, 2011; Byrnes and Sondermann, 2011). Here, we introduced a more subtle mutation by replacing R77 with alanine. In contrast to the R77E mutant, simple removal of the side chain (R77A) has little effect on nucleotide-dependent dimerization in light scattering-based assays (Figure 3C). Both wild-type atlastin and the R77A mutant variant form dimers in the presence of GppNHp and GDP·AlFx, but are monomeric in GDP or in the absence of any nucleotide. Yet, R77A mutant protein has negligible GTPase activity of 0.1 μM Pi/min/μM when compared to 4.1 μM Pi/min/μM for wild type (Figure 3B), corroborating the role of R77 as atlastin’s arginine finger. Based on the structural and mutagenesis data, one cannot rule out the possibility that R77 may have a dual function as an interfacial residue as well as a catalytic residue.
Thus far, we established that crystal form 3 depicts a catalytically competent, dimeric state of atlastin. Together with the observation of form 1-like, relaxed-parallel atlastin-2 dimers bound to GppNHp in electron micrographs (Morin-Leisk et al, 2011), these new structures deviate from our modelling of small-angle X-ray scattering (SAXS) data that indicated GppNHp- and transition state analogue-bound atlastin adopting an extended conformation in solution, more similar to the crystal form 2 dimer (Byrnes and Sondermann, 2011). Yet, the fits between the crystallographic models and the solution scattering data were imperfect, suggesting either the presence of an alternative conformation or an ensemble of conformations in solution. Indeed, modelling of the SAXS data with multiple conformations (e.g., form 1, 2, and 3 dimers) improves the fits significantly, and points to a conformational heterogeneity of GppNHp- and GDP·AlFx-bound atlastin-1 (data not shown).
Measuring middle domain dimerization in atlastin via Förster Resonance Energy Transfer
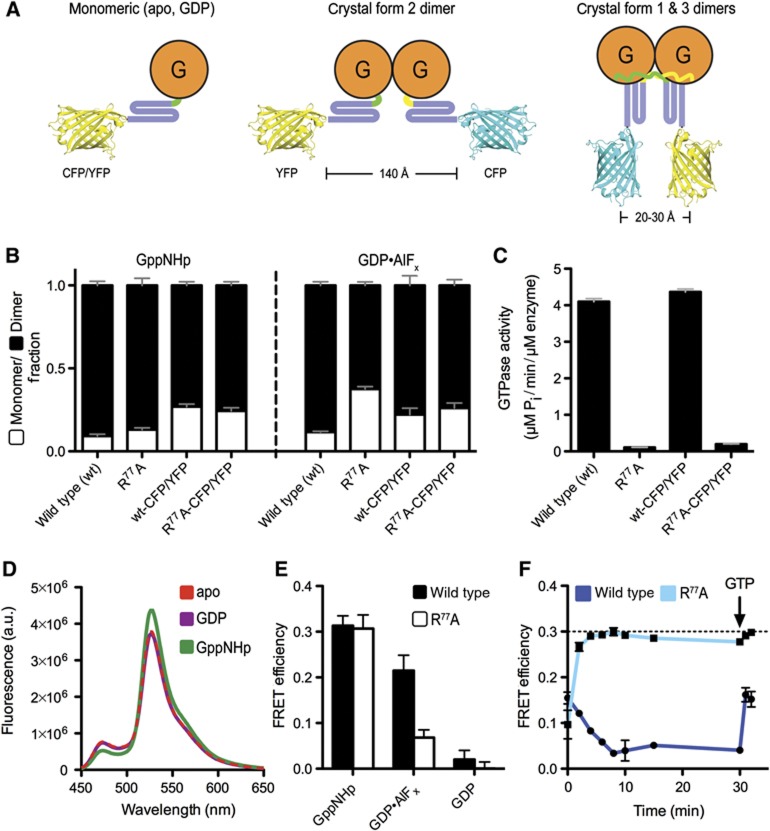
While we revealed the catalytic core of atlastin, it is less clear what functional state the new crystal form 3 structure depicts and what role GTP hydrolysis plays during membrane fusion. The aforementioned studies focused on states that were bound to non-hydrolysable nucleotide analogues, limiting the insight into the molecular consequences of catalysis. To further investigate the solution conformation of atlastin and to later measure the kinetics of conformational changes within the dimer, we developed a Förster Resonance Energy Transfer (FRET)-based assay. Based on the crystal structures, we would predict that the extended form 2 dimer would not support FRET between fluorescent probes fused to the distal tips of the middle domains, while in the parallel dimers (forms 1 and 3) the fluorophores would come into close proximity allowing FRET to occur. We fused ECFP or EYFP to the C-terminus of the middle domain using a short linker segment to increase the rotational freedom of the fluorescent proteins (human atlastin-1, residues 1–446; linker: GTSTSG). Fusion proteins showed dimerization propensity similar to the parent proteins without the fluorescent moiety when analysed by SEC-MALS, with dimerization occurring in the presence of GppNHp and GDP·AlFx, but not in GDP or in the absence of any nucleotide (Figure 4B). In addition, GTPase rates were almost identical (Figure 4C) indicating proper functionality of the proteins used in the FRET assays.
Figure 4.
Atlastin-1 middle domain FRET using C-terminal ECFP/EYFP fusions. (A) Experimental design of measuring middle domain dimerization. Cartoon depiction of fluorescent protein-labelled atlastin-11–446 in various crystallographic dimer conformations. Estimated length measurements are based on the crystal structures shown in Figure 2A. (B) Nucleotide-dependent dimerization of atlastin-11–446-ECFP/EYFP-fusion proteins. Molecular weight fractions for GppNHp- or GDP·AlF4−-bound atlastin-1 were determined by SEC-MALS and fitted using the Multipeak Fitting Package in Igor Pro. Error bars correspond to calculated errors in the fitting function parameters. (C) GTPase activity atlastin-11–446-ECFP/EYFP-fusion proteins. GTPase activity was determined by measuring the production of inorganic phosphate over time upon GTP hydrolysis at various protein concentrations. (D) Emission spectra of atlastin-11–446-ECFP/atlastin-11–446-EYFP mixtures at equilibrium. Protein (20 μM total, 1:20 ratio of donor to acceptor) was mixed with either buffer or nucleotide for at least 20 min prior to measurement, and was excited at 445 nm (apo, red dashed line; GDP, purple; GppNHp, green). (E) FRET efficiencies. FRET efficiencies of wild-type (black) and R77A mutant (white) atlastin-11–446-ECFP/EYFP in the presence of various nucleotides were calculated as stated in Materials and methods. (F) FRET efficiency versus time of wild type and mutant R77A in the presence of GTP. Either wild-type (dark blue) or mutant R77A (light blue) atlastin-11–446-ECFP/EYFP were mixed with an excess of GTP. Emission spectra were measured immediately after mixing, every 2 min up to 10 min, at 15 min, and at 30 min. The sample was then spiked with additional GTP, mixed, and measured again. Lamp shutters were closed in between measurements. A black dashed line represents the FRET efficiency of wild-type FRET pair in the presence of GppNHp at equilibrium.
First, we measured FRET at equilibrium in the presence of different nucleotides (Figures 4D and E). Based on previous data, we predicted that no FRET would occur in the presence of GDP or absence of any nucleotide and there would be an increase in FRET efficiency in the presence of GTP or GTP analogues, although it was not clear to what extent or timescale. Indeed, no change in either donor (ECFP) or acceptor (EYFP) fluorescence was detected between the apo state and the GDP-bound state (FRET efficiency of <0.02%). For incubations in the presence of GppNHp or GDP·AlFx, we observed a decrease in donor fluorescence intensity and concomitant increase in acceptor fluorescence intensity, indicating robust FRET, with the FRET efficiency being comparable in both samples (30% in GppNHp and 22% in GDP·AlFx). Using the FRET efficiencies obtained from the measurements in the presence of GppNHp and GDP·AlFx, average distances of 54 and 57 Å were determined, respectively. In general, the FRET efficiency depends on the distance between the donor and acceptor fluorophores but also on the fraction of proteins in an FRET-competent state, and we cannot distinguish between the relative contributions with the current assay. Nevertheless, the apparent distances establish that the middle domains come into close proximity, at least for a fraction of the population, within atlastin dimers in solution.
Middle domain-mediated FRET was higher in GDP·AlFx and GppNHp, or for the catalytically inactive R77A mutant in GTP than that observed for wild-type atlastin-1 in the presence of GTP (Figure 4F). Since GTP will be hydrolysed efficiently by atlastin-1 over the course of the assay, a lower FRET efficiency can be explained by sample heterogeneity and by exhaustion of the available GTP pool and a build-up of GDP, which does not support dimerization and therefore FRET. This argument was corroborated by the observation that FRET decreased over time in solution containing GTP and reached a minimum after about 10 min under the chosen conditions (Figure 4F). Addition of GTP at a later time point brought the signal up again to the initial value. The aforementioned differences in apparent FRET maxima may be due to fast rates of hydrolysis and the fact that GTP-bound wild-type atlastin likely populates different conformations than the catalytically inactive mutant. It may also indicate that the FRET-competent state is rather short-lived for a nucleotide hydrolysing system.
Kinetics of middle domain dimerization
The equilibrium FRET data suggest that at least a fraction of atlastin resides in the more compact conformation, characterized by parallel middle domains (crystal form 1 or 3), when bound to GppNHp or GDP·AlF4− (Figure 4). In addition, it appears that the states interconvert over time, suggesting that the protein may populate several conformations. To determine the kinetics of this conformational switch, we turned to rapid-mixing fluorescence measurements. An equimolar mixture of ECFP- and EYFP-fusion proteins (0.5 μM each, final concentration) was mixed with buffer or buffer containing an excess concentration of nucleotide (1 mM final concentration) using the syringe drive from a submillisecond-dead time stopped-flow instrument, and the subsequent changes in donor and acceptor fluorescence were monitored simultaneously over time.
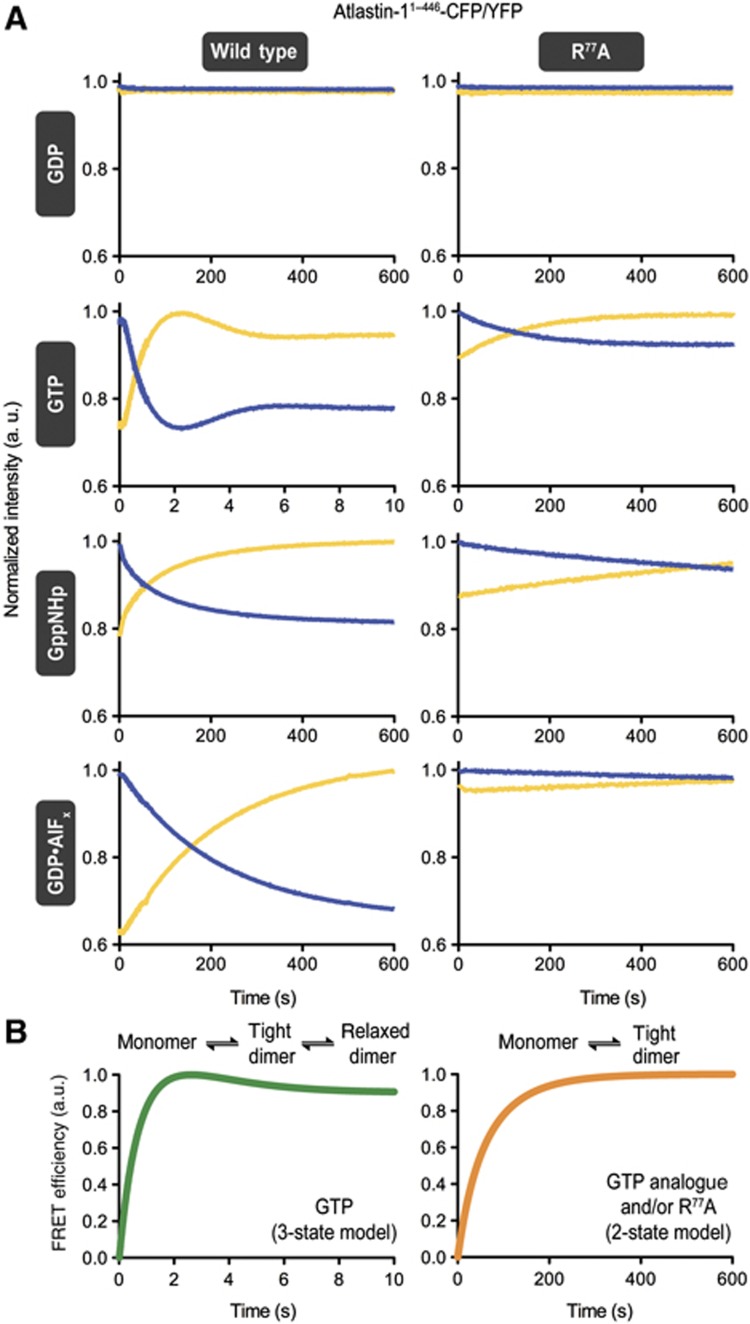
Both donor and acceptor fluorescence traces showed little to no change when the FRET pair was mixed with either buffer alone or GDP-containing buffer. However, after mixing with GTP, GppNHp, GTPγS, or the transition state analogue GDP·AlFx, the proteins exhibited concurrent, inverse changes of donor and acceptor fluorescence intensity, indicating FRET (Figure 5A; Supplementary Figure 4A). When incubated with GppNHp, GTPγS, or GDP·AlFx, fluorescence intensities change gradually over about a 10-min period. In contrast, when the FRET pair is mixed with GTP, there is a rapid decrease in donor fluorescence and simultaneous increase in acceptor fluorescence, with maximal FRET being reached after only ∼2 s. Subsequently, the system relaxes to an intermediate FRET level before it drops off after several minutes when the GTP pool is consumed (Figures 4F and 5A). Since the on-rates of nucleotide binding for both GTP and GppNHp are approximately the same (Table I), this sharp difference in timescale can be explained by a driving force incurred by GTP hydrolysis. In addition, the unique appearance of the minimum/maximum observed in the donor/acceptor time trace with GTP can possibly be rationalized by an initial synchronization of the GTP hydrolysis reaction, where the dimer takes on a very close conformation (i.e., the tight-parallel form 3 conformation; Figure 2A) followed by a more relaxed FRET state (i.e., the relaxed-parallel form 1 conformation; Figure 2A), possibly coupled with post-hydrolysis events such as phosphate release.
Figure 5.
Kinetics of atlastin-1 middle domain FRET. (A) Stopped-flow FRET measurements. A mixture of atlastin-11–446-ECFP/EYFP fusion proteins (1 μM each) was prepared in the absence of nucleotide, and mixed 1:1 with either buffer (apo) or nucleotide-containing buffer (GDP, GTP, GppNHp, or GDP·AlFx; concentration: 2 mM) using a stopped-flow apparatus. A xenon arc lamp was set to 445 nm excitation, and two photomultiplier tubes with appropriate filters in place were used to measure emission output over time. (B) Simulations of FRET data. A three-state system was used for a hydrolysis competent reaction (left, green), whereas a two-state system (right, orange) was applied to model nucleotide-dependent processes in the absence of GTP hydrolysis. Both simulations start with a monomeric assembly, which is then allowed to interconvert to a tight-parallel (form 3-like) dimer. In the hydrolysis competent case, this dimer is then allowed to interconvert to a relaxed-parallel (form 1-like) dimer.
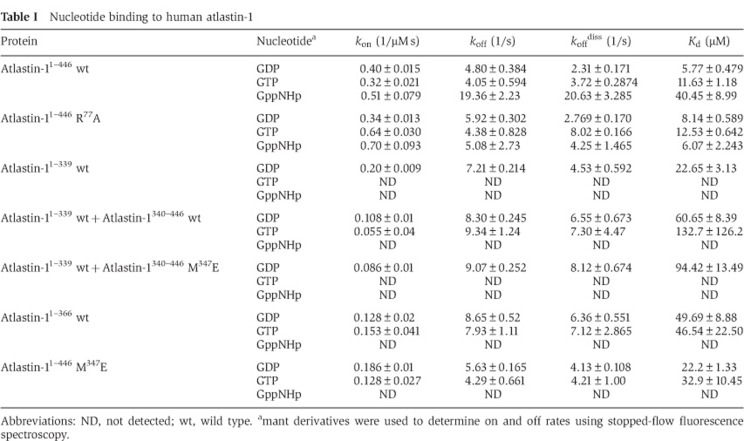
Table 1. Nucleotide binding to human atlastin-1.
Although dimerization of the catalytically inactive mutant R77A has been observed in light scattering and steady-state FRET experiments, the kinetics appear to be rather slow (Figure 5A, right panel), indicating a crucial role of the arginine finger in the catalytic mechanism and conformational switching. Interestingly, binding on-rates of fluorescently labelled nucleotides are comparable for wild-type and R77A atlastin-11–446 (Table I), and occur at a faster timescale than dimerization for reactions that do not undergo catalysis.
Using simple kinetic equations and our structural information (see Materials and methods and Supplementary Appendix), the time-resolved FRET data could be modelled using a molecular simulation, replicating the main features of the time-resolved FRET experiments (Figure 5B). A two-state model describes well the data observed in the absence of hydrolysis. Addition of a third state representing a relaxed FRET constellation reproduces the appearance of a peak in the FRET data followed by a drop-off of the signal. These simulations corroborate our experimental observations, indicating that our interpretations provide a feasible framework.
Correlation between G and middle domain dimerization kinetics
Thus far, we defined the catalytic core of atlastin-1 and showed that nucleotide hydrolysis drives middle domain dimerization. Yet, considering the structural and FRET data, the question arises as to whether G domain dimerization precedes middle domain dimerization or occurs at a similar timescale. The two different scenarios have distinct implications for the molecular mechanism of atlastin-mediated membrane fusion and the role of GTP hydrolysis in the functional cycle. In the former model, GTP binding to atlastin would tether two opposing membranes via G domain dimerization, with the middle domains contributing to the interaction only subsequently following GTP hydrolysis, bringing the opposing membranes into closer proximity. In the alternative model, GTP hydrolysis would act as the timer for the formation of a tight tethering dimer, involving G and middle domains simultaneously. Determining the sequence of G and middle domain dimerization will allow us to distinguish between these models.
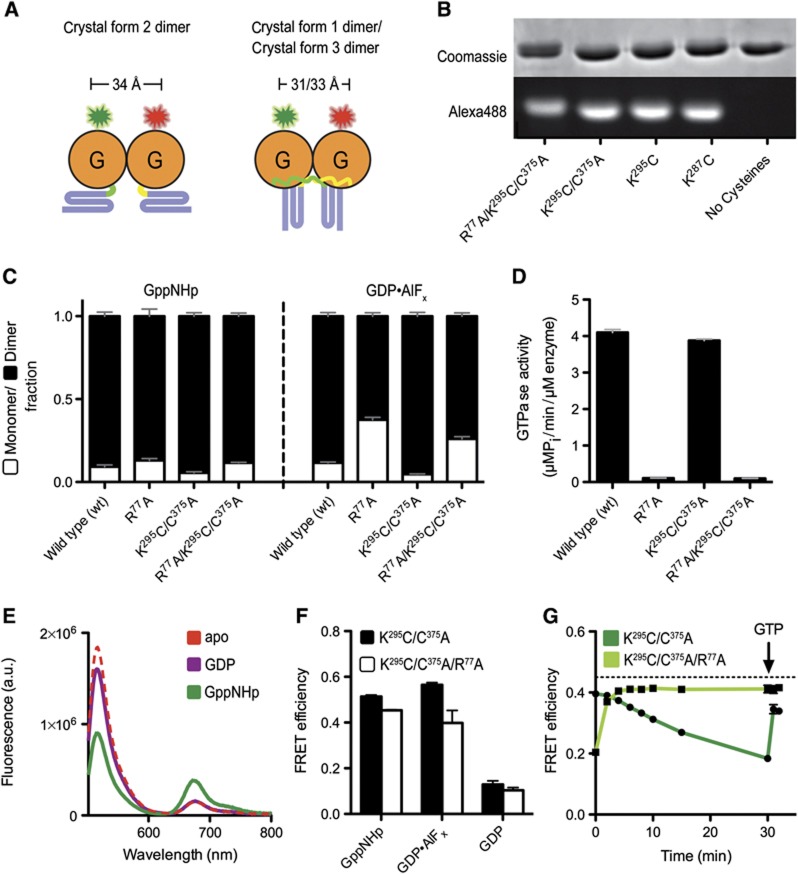
To measure G domain dimerization, we mutated the sole cysteine in the middle domain (C375A) and introduced a cysteine in the G domain at a non-conserved and solvent-exposed position (K295C), which, based on all three dimeric crystal structures, would support FRET when labelled with appropriate fluorophores (Figures 6A and B). These atlastin-1 mutants showed similar dimerization and GTPase characteristics as the wild-type proteins (Figures 6C and D). Alexa dyes 488-C5 maleimide (FRET donor) and 647-C2 maleimide (FRET acceptor) were reacted with this mutant protein. FRET efficiency was measured based on changes in the donor fluorescence. Although we report a minor FRET signal in the case of GDP (efficiency of <10%), the drop in donor fluorescence was not accompanied by a rise in acceptor fluorescence (Figure 6E). We interpret this result as a no-FRET state, consistent with the lack of dimerization in independent assays (e.g., Supplementary Figure 3). Importantly, in the presence of GppNHp and GDP·AlFx, we observed a significant drop in donor fluorescence, with a concomitant rise in acceptor emission, indicating robust FRET. The extent of FRET was comparable in both samples (51% in GppNHp and 56% in GDP·AlFx; Figure 6F), corresponding to apparent distances of 55 and 54 Å, respectively. The discrepancy to the measured distance of ∼32 Å (between Cβ positions of K295) based on the crystal structures may be rationalized considering the linker length of the fluorophore (a C5 linker for Alexa 488 and a C2 linker for Alexa 647, which correspond to an additional ∼8 and ∼3 Å, respectively) and/or a minor fraction of monomeric protein.
Figure 6.
Atlastin-1 G domain FRET using Alexa 488/647 dye-labelled proteins. (A) Experimental design of measuring G domain dimerization. Cartoon depiction of fluorescently labelled atlastin-11–446 in various crystallographic dimer conformations. Estimated distances between Cβ atoms of K295, which is mutated to a cysteine for site-specific labelling, are based on the crystal structures shown in Figure 2A. (B) SDS–PAGE of dye-labelled atlastin-11–446. Atlastin-1 mutants were first labelled with Alexa 488-C5 Maleimide as described in Materials and methods. Two gels run side-by-side were loaded with 2.5 μg of indicated atlastin-1 proteins. One gel was stained with Coomassie brilliant blue (protein dye). The second, unstained gel was imaged upon excitation of the fluorophore. (C) Nucleotide-dependent dimerization of dye-labelled atlastin-11–446 proteins. SEC-MALS experiments were carried out and analysed as in Figure 4B. (D) GTPase activity of atlastin-11–446 mutant proteins used for dye labelling. GTPase activity was determined as shown in Figure 4C. (E) Emission spectra of dye-labelled atlastin-11–446 mixtures at equilibrium. Alexa Protein (20 μM total, 1:20 ratio of donor to acceptor) was mixed with either buffer or nucleotide for at least 20 min prior to fluorescence measurement (apo, red dashed line; GDP, purple; GppNHp, green). (F) FRET efficiencies. FRET efficiencies of wild-type (black) and R77A mutant (white) calculated for dye-labelled atlastin-11–446 donor/acceptor mixtures in the presence of various nucleotides were carried out as stated in Materials and methods. (G) G domain-mediated FRET efficiency versus time of wild type and mutant R77A in the presence of GTP. Either wild-type (dark green) or mutant R77A (light green), dye-labelled atlastin-11–446 was mixed with an excess of GTP essentially as in (E). Emission spectra were measured right after mixing, every 2 min up to 10 min, at 15 min, and at 30 min. The sample was then spiked with additional GTP, mixed, and measured immediately. Lamp shutters were closed in between measurements. A black dashed line represents the FRET efficiency of wild-type FRET pair in the presence of GppNHp at equilibrium.
In contrast to middle domain-mediated FRET that never achieved the same efficiencies in the presence of GTP as it did when mixed with GppNHp or the transition-state analogue (Figures 4E and F), GTP binding to G domain-labelled atlastin-1 peaked at a comparable maximum value as all other dimerization-supporting conditions before FRET decreased again due to GTP hydrolysis (Figures 6F and G). As before, the drop-off could be reversed by the addition of GTP (Figure 6G). On the other hand, GTP-induced FRET via G domain dimerization of a catalytically inactive atlastin-1 variant (R77A) rose to a maximum value over the course of 5 min and remained unchanged, approaching the steady-state FRET efficiency of catalytically competent atlastin-1 in the presence of GppNHp (Figure 6G). Taken together, these observations suggest that G domains adopt an invariable, stable dimer, unlike the middle domains that appear to exist in equilibrium between different dimeric arrangements or populations.
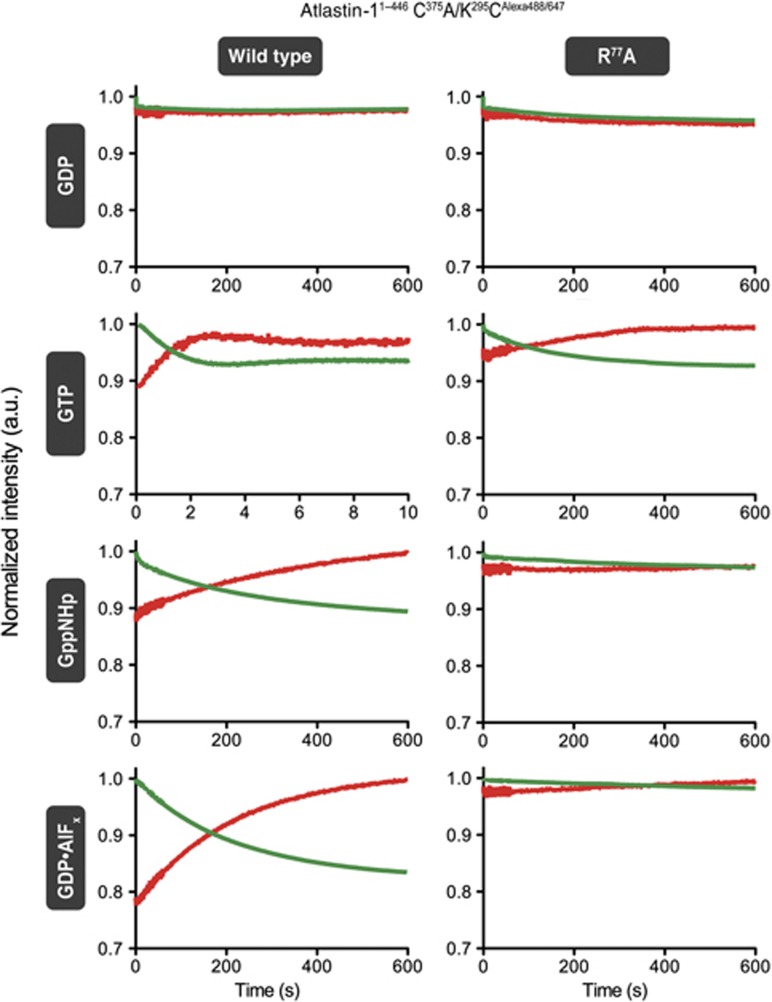
Next, we assessed the kinetics of G domain dimerization, and compared it to those of middle domain-supported FRET. Interestingly, fluorescence changes in both the G domain and middle domain FRET pairs followed similar kinetics, with fast rises in FRET when mixed with GTP (second timescale), and slower kinetics when the catalytically dead mutant was used and/or in the presence of GDP·AlFx, GppNHp, and GTP_γ_S (minute timescale) (Figure 7; Supplementary Figure 4A). Similarly to the middle domain dimerization kinetics, G domain dimerization is overall slower for the inactive R77A mutant compared to the catalytically active parent protein. Since nucleotide binding kinetics and affinities are similar for active and inactive proteins (Table I), it is likely that the arginine finger is involved in dimerization and/or allosteric switching of atlastin-1.
Figure 7.
Rapid-mixing, stopped-flow kinetics of G domain-mediated FRET. Alexa 488 and 647-labelled atlastin-11–446 mixtures were prepared in a 1:1 ratio of donor to acceptor in a nucleotide-free buffer. Samples were mixed 1:1 with either buffer (apo) or buffer containing the indicated nucleotides (2 mM) using a stopped-flow apparatus. A xenon arc lamp was set to 493 nm excitation, and two photomultiplier tubes with appropriate filters in place were used to measure emission output over time.
These results indicate that the GTPase activity of atlastin is required to drive a conformational change allowing concomitant G and middle domain dimerization. Rather than bringing opposing membranes into close proximity via sequential steps, the entire N-terminal, cytoplasmic module acts as the tethering unit. Consequently, the tight-parallel dimer structures bound to GTP analogues (crystal form 3; Figure 2) are likely depicting a post-hydrolysis state.
The middle domain promotes GTP loading at the G domain and supports dimerization
If indeed the middle domain is released from the G domain prior to or concomitant with dimerization upon GTP hydrolysis, what is the relevance of the form 2 crystal structure, in which the middle domain folds back onto the G domain? Other observations not explained by the current model include the impaired GTPase activity of the isolated G domain, its inability to dimerize in the presence of any nucleotide, and its failure to act as a competitive inhibitor in membrane fusion (Moss et al, 2011; Pendin et al, 2011). Likewise, mutations that are predicted to impact the fold of the middle domain generate a non-functional protein, yet the exact mechanism remained elusive (Morin-Leisk et al, 2011; Pendin et al, 2011).
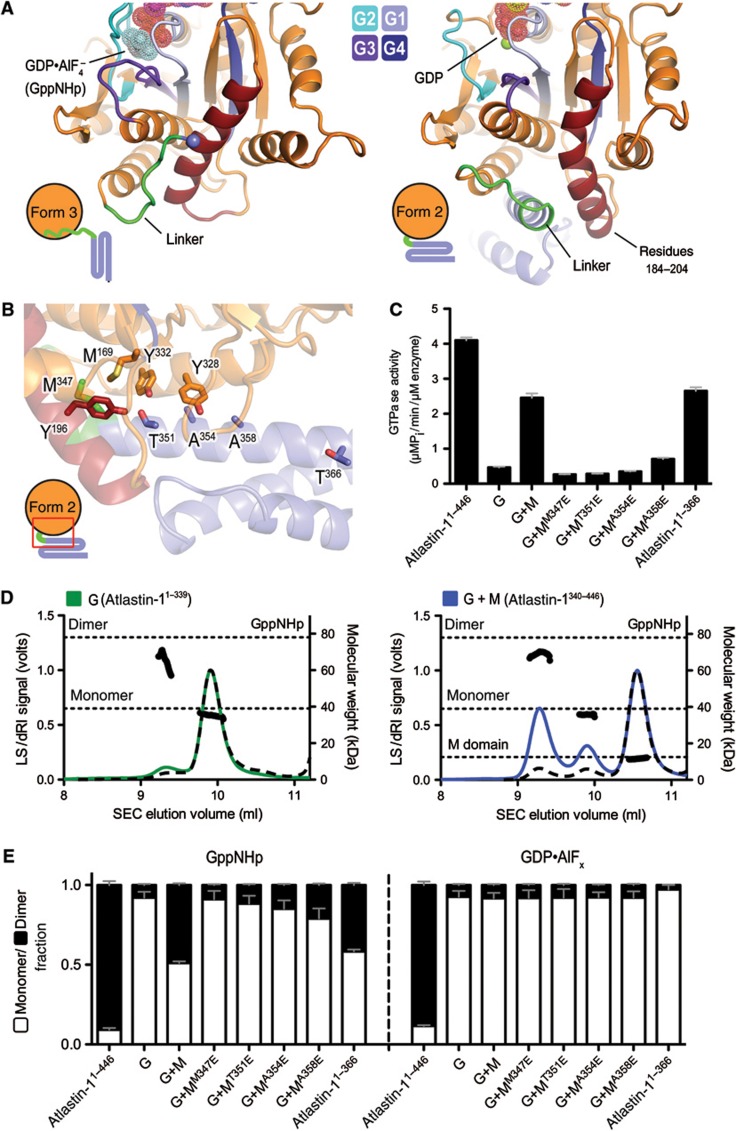
A comparison of form 2 and 3 crystal structures highlights differences in the linker region and immediate docking site of the middle domain on the G domain, foremost the conformation of a central helix (residues 184–204; Figure 8A). This helix is bent in form 2, providing a cradle for the middle domain, but is straight in form 3 occluding the middle domain-docking site. Spatially, it is adjacent to the nucleotide binding regions, which may indicate an overall regulatory role. We speculated that it might impact nucleotide binding, which could explain the aforementioned gaps in our mechanistic understanding. To test this hypothesis, we conducted nucleotide-binding assays using mant-labelled derivatives that change fluorescence upon interacting with protein (mant-GDP, mant-GTP, and mant-GppNHp). We noted that the isolated G domain binds mant-GDP readily with comparable kinetics as the construct also containing the middle domain (Table I). Yet, only the latter binds mant-GTP and the GTP-analogue mant-GppNHp, suggesting an influence of the middle domain on GTP loading.
Figure 8.
Middle domain-mediated control of atlastin’s GTPase activity. (A) Comparison of the G-middle domain interface in form 2 and form 3 crystal structures. The G domain of atlastin-1 is shown in orange except for switch regions (shades of blue) and residues 184–204 (dark red), which form a helix that changes its conformation between the form 2 and form 3 (or form 1) structures. In the GDP-bound form 2, the helix is bent to accommodate the first helix of the middle domain (blue with linker in green), while in the GDP·AlF4−-bound form 3 (and GDP-bound form 1) structure, the helix straightens out, preventing this interaction. Nucleotide positions are indicated and shown as fuzzy spheres. (B) The G-middle domain interface in the form 2 crystal structure. The area of the structure boxed in red is shown, with the same colouring introduced in (A). Positions of point mutants used in (C) and (E) and the last residue of the truncated atlastin-1 construct (atlastin-11–366) are shown as sticks. (C) GTPase activity. The catalytic activity of atlastin-1 constructs 1–446, 1–339 (G), and 1–366 were measured. In addition, the effect of the isolated middle domain (M; residues 340–446) on the activity of the G domain was determined. Structure-guided mutants of the middle domain were included as well. (D) Effect of the middle domain on the nucleotide-dependent oligomerization of the G domain. SEC-MALS data for the isolated G domain (atlastin-11–339; left panel) alone or with addition of a 10 × molar excess of the isolated middle domain (atlastin-1340–446; right panel) in the presence of GppNHp are shown. The signal from the 90°-light scattering detector and refractive index detector is shown as coloured, solid lines (G domain alone, green; G and M domains mixed, blue) and black, dashed lines, respectively (left Y axis). Average molecular weight calculations across the protein peak are shown as black circles (right Y axis). The theoretical molecular weight (based on primary sequence) for the monomer and dimer of the G domain, as well as the middle domain in the right panel, is shown as horizontal dashed lines. Proteins (30–40 μM) were incubated with nucleotides (2 mM) at least 30 min prior to SEC-MALS analysis. (E) Quantification of nucleotide-dependent dimerization of atlastin-1’s G domain. SEC-MALS data for the indicated atlastin-1 constructs in the absence or presence of isolated middle domain variants are shown. Data for samples incubated with GppNHp or GDP·AlFx are shown. The experimental approach and presentation was as in Figure 4B.
As further corroboration, we used the separate G and middle domains (atlastin-11–339 and atlastin-1340–446, respectively). In addition, we made a construct comprising the G domain and a short stretch of the first middle domain helix, which is buttressed by the G domain in our form 2 crystal structure (atlastin-11–366; Figure 8B). First, we asked whether the middle domain has an effect on nucleotide binding of the isolated G domain, when it is added in trans. While the isolated G domain failed to bind mant-GTP (and mant-GppNHp) under the conditions used here, we observed a rescue of mant-GTP binding when the isolated middle domain was present, albeit with weaker affinity than the intact cytoplasmic unit (atlastin-11–446). A similar result was obtained with the protein that contained the truncated middle domain (atlastin-11–366), confirming the middle domain’s role in GTP loading (Table I).
We predicted that efficient GTP loading is a prerequisite for GTPase activity, and hence we would expect an effect of the middle domain on catalysis. While the isolated G domain has close to background activity, similar to its Drosophila counterpart (Moss et al, 2011), co-incubation with the middle domain (10 × molar excess over the G domain) yielded an activity of about five times the initial value (Figure 8C). The middle domain truncation mutant leaving the G domain interaction region intact (atlastin-11–366) was also able to similarly rescue GTPase activity. No stimulation effect was seen when the middle domain was added to the entire N-terminal cytoplasmic domain of atlastin, which includes the middle domain in the same polypeptide chain and has robust activity (data not shown).
Next, we asked whether the G-middle domain interface, which is unique to the form 2 crystal structure, is involved in the activation of the G domain, possibly as an allosteric site for nucleotide loading control (Figure 8B). We introduced several single-point mutations into the isolated middle domain along this interface. Remarkably, mutant middle domains with changes across this largely hydrophobic surface were significantly impaired in the activation of the GTPase that was observed with addition of wild-type middle domain, and interestingly this effect was lessened the further from the top of the middle domain the mutant was located (Figures 8B and C). Using middle domain titration experiments and the GTPase activity of the isolated G domain as the readout, we estimated that the wild-type middle domain associates with the G domain with an apparent affinity of 62.2 μM, whereas no stimulation was observed with a middle domain mutant (M347E) across the entire concentration gradient (Supplementary Figure 4B). Likewise, the same mutation introduced into the construct comprising both G and middle domains affected nucleotide binding (Table I) and GTPase activity (Supplementary Figure 4C), corroborating the findings with the isolated domains.
Since GTP binding (and hydrolysis) facilitates G domain dimerization (see above), we assessed the dimerization propensity of the isolated domain in the absence and presence of the middle domain or its point mutants. When subjected to SEC-MALS-based analysis, the G domain alone elutes predominantly in a monomeric state in the presence of GppNHp (∼8% dimer fraction) or GDP·AlFx (no detectable dimer) (Figures 8D and E). In samples with 10 × molar excess of wild-type middle domain, a large fraction of the G domain formed dimers in GppNHp (∼49%), but not in GDP·AlFx. Similar to their decreased effect on GTPase stimulation, middle domains with mutations in the G domain interface failed to induce G domain dimerization (Figure 8E). Again, mutants further along the middle domain affected dimerization slightly less than those at the top of the middle domain. Notably, the dimer seen on the SEC-MALS trace corresponds to a G domain dimer alone, suggesting that the middle domain interaction with the G domain is rather transient and, based on our structural analysis, possibly incompatible with the GTP-bound conformation of the G domain (Figure 8A).
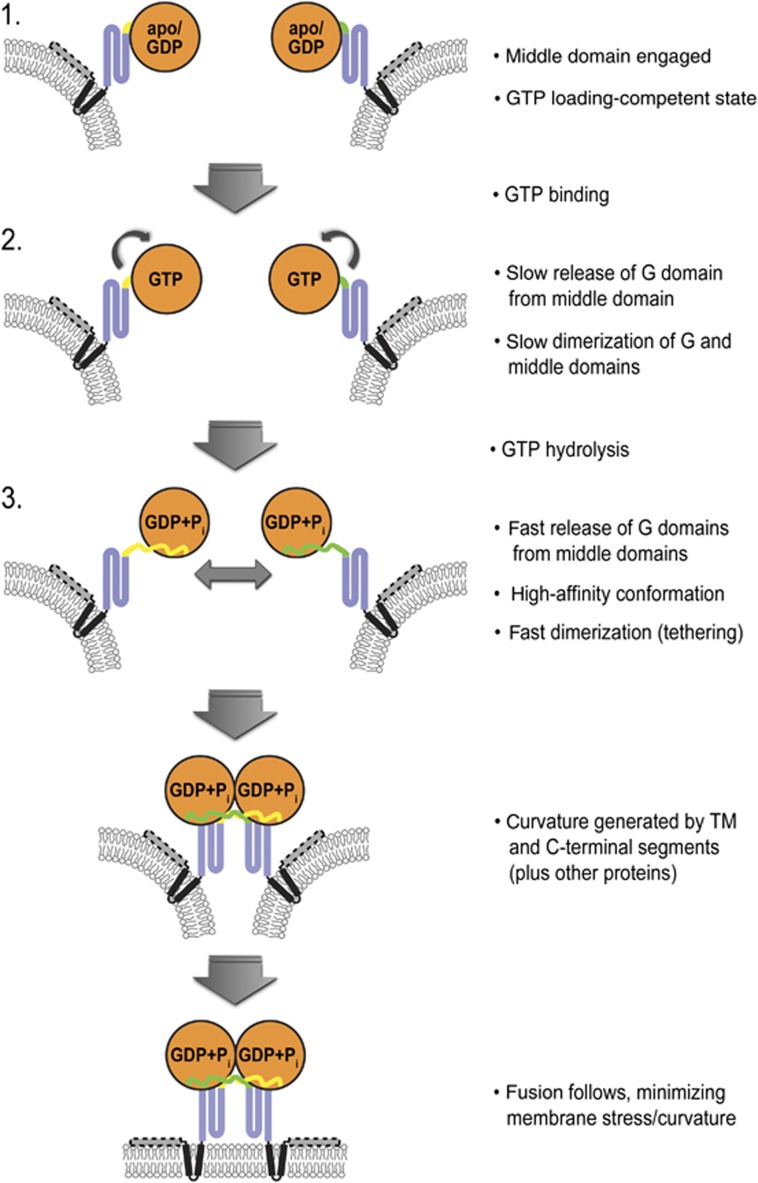
In summary, we demonstrated a dual role for the middle domain in the reaction cycle of human atlastin-1 (Figure 9). Initially, it is required for the efficient binding of GTP to the G domain via an intramolecular interaction, presumably by allosterically altering the conformation or dynamics of the switch regions, which could render the G domain more promiscuous for nucleotide binding (Table I). This role is important for atlastin’s GTPase activity and dimerization of the G domains. Upon GTP binding, the middle domain dislodges from the G domain, likely involving a conformational change within the G domain imposing a steric clash with the middle domain. The middle domain then contributes to homotypic dimerization of atlastin. This transition is faster upon GTP hydrolysis, suggesting that hydrolysis could potentially occur in the context of a monomeric G domain. This notion is supported not only by the different timescales at which nucleotide binding and dimerization occur in the absence of hydrolysis, but also by the absence of apparent cooperativity in the GTPase kinetics. GTPase rates appear slower than GTP binding and atlastin dimerization in GTP. Rather than indicating a requirement of G domain dimerization for enzymatic activity, the somewhat slower GTPase rate compared to both nucleotide binding and protein dimerization can be explained by the fact that we measure phosphate release in the activity assay, which may be rate limiting. We predict that the actual rate of hydrolysis is faster than the apparent rate we measured (Figure 3B). As a side note, non-hydrolysable nucleotides or transition state analogues and likewise the catalytically inactive R77A mutant may only capture parts of the reaction cycle, while experiments under GTP-hydrolysing condition provide insight into the entire functional cycle and its timing.
Figure 9.
Model for atlastin-mediated membrane fusion. Atlastin begins in a form 2-like, GTP-loading-competent state with the middle domain engaging the G domain. GTP binding and hydrolysis drive rapid disengagement of the middle domain from the G domain, immediately followed by G and middle domain dimerization. Once in this tethering complex, membrane curvature and stress caused by atlastin’s transmembrane domains and C-terminal amphipathic helix would allow fusion to occur spontaneously. Phosphate release follows, with relaxation and subsequent disassembly of the dimer. Other proteins that may interact with atlastin and contribute to membrane curvature, such as reticulons, are not shown.
Conclusions
While they have some common features, membranes of different cellular organelles are specialized environments that support particular biological functions. The ER is a prime example of this specialization, as lipids form an interconnected system of cisternae, vesicles, and tubules, which provides a highly compartmentalized structure for a multitude of biochemical processes. Its unique reticular structure has functional relevance, as mutations in atlastin-1, a protein involved in maintaining the ER’s morphology by mediating homotypic membrane fusion (Hu et al, 2009; Orso et al, 2009), are associated with hereditary, neurodegenerative disorders (Zhao et al, 2001; Leonardis et al, 2012). Interestingly, the majority of mutations cluster around the nucleotide binding site, and extend towards the site of intramolecular interaction between the G and middle domains in the crystal form 2 dimer (Bian et al, 2011; Byrnes and Sondermann, 2011). This observation in conjunction with our current data could indicate a compromised allosteric network, which we would predict to couple middle domain interaction, GTP binding, and hydrolysis.
Our results suggest that membrane fusion follows a tethering step, involving the N-terminal cytoplasmic G and middle domains, which dimerize upon GTP binding and hydrolysis. This tight pairwise interaction would bring opposing membranes or membrane tubules into close proximity, the distance of which is critical since an increase in the length of the linker between the N-terminal module and the transmembrane segments impairs fusion (Pendin et al, 2011). Once membranes are in close proximity, increased membrane curvature and stress mediated by the transmembrane helices and the amphipathic C-terminus of atlastin facilitate membrane fusion (Moss et al, 2011; Stefano et al, 2011; Liu et al, 2012). By analogy to molecular mechanisms described for dynamin-mediated membrane fission (Bashkirov et al, 2008; Chappie et al, 2011), membrane fusion may proceed spontaneously, probably upon release or relaxation of the tether. In that sense, the underlying principles of dynamin-mediated vesicle scission and atlastin-mediated membrane fusion appear to follow a conserved mechanism via G domain-regulated processes and implementation of protein domains or complexes that increase membrane curvature. While there are many parallels to be drawn between members of the dynamin superfamily, their differences pertain to their intrinsic control (e.g., self-assembly and catalytic mechanism), fine-tuning of the reaction (e.g., cooperativity and nucleotide exchange), and basic requirements that differ between fusion and fission. For example, unlike in atlastin, the isolated G domain of human GBP1 dimerizes readily in the presence of GTP and its analogues (Ghosh et al, 2006). Interestingly, GBP1 also shows cooperativity with regard to nucleotide hydrolysis, which relies on G domain dimerization, while atlastin apparently lacks this mode of higher order regulation. Also, while membrane fission can originate from one membrane, fusion relies on bringing two opposing membranes into close proximity. While we cannot formally rule out a mechanism by which the N-terminal domains of atlastin dimerize on the same membrane (e.g., to further increase membrane curvature leading to the formation of three-way junctions in the ER), the observation that full-length, Drosophila atlastin is sufficient to facilitate proteoliposome fusion indicates a canonical fusion reaction (Orso et al, 2009). It remains to be seen whether other G proteins employ similar mechanism as we described here for atlastin, or if they are subject to unique modes of control.
Materials and methods
Protein expression and purification
The cytoplasmic domain (residues 1–446), G domain (1–339), middle domain (340–446), truncated middle domain (1–366), and C-terminal ECFP/EYFP fusions (atlastin-1 1–446 followed by a short linker containing amino-acid sequence GSTSTG followed by either ECFP or EYFP) of human atlastin-1 were produced following standard molecular biology and liquid chromatography techniques. A detailed description is provided in Supplementary data.
Crystallization, data collection, and structure solution
Crystals were obtained by sitting drop vapour diffusion mixing equal volumes of protein (10–30 mg/ml) and reservoir solution followed by incubation at 20°C. Initial crystals were obtained using atlastin-1 protein in gel filtration buffer in the presence of 2 mM GppNHp (Sigma) and 4 mM MgCl2. In the case of GDP·AlF4−, crystals were obtained in the presence of 2 mM GDP (Sigma), 4 mM MgCl2, 2 mM EGTA, 2 mM AlCl2, and 20 mM NaF. Rod-shaped crystals belonging to space group P21212 (atlastin-11–446-N440T) grew in reservoir solution containing 0.2 M lithium citrate tribasic tetrahydrate and 20% PEG-3350 (for both GppNHp and GDP·AlF4− crystals). For cryo-protection, crystals were soaked in reservoir solution supplemented with 25% glycerol. For proteins crystallizing in space group P212121 (atlastin-11–446-Chis), the reservoir solution contained 0.1 M imidazole, pH 7.0 and 20% v/v Jeffamine ED-2001, pH 7.0 (GppNHp) or 0.2 M ammonium phosphate dibasic and 20% PEG-3350 (GDP·AlF4−). Crystals were cryo-protected by soaking in the crystallization solutions supplemented with 20% xylitol. Cryo-preserved crystals were flash-frozen and stored in liquid nitrogen. Data were collected on frozen crystals at 100 K.
Data reduction was carried out with the software package HKL2000 (Otwinowski and Minor, 1997). Phases were obtained either by Single-wavelength Anomalous Dispersion (SAD) or Molecular Replacement (MR) methods by using the software package PHENIX (Adams et al, 2002) with the isolated G and middle domains of atlastin-1 as separate search models for MR. Refinement in PHENIX (Adams et al, 2002) and COOT (Emsley and Cowtan, 2004) yielded the final models. Data collection and refinement statistics are summarized in Supplementary Table 1. Illustrations were made in Pymol (Schrödinger, 2010).
Size-exclusion chromatography-coupled multi-angle light scattering
Purified protein (<2 mg ml or 40 μM, injected concentration) was subjected to size-exclusion chromatography using a BioSep-SEC-S 3000 column (Phenomenex) equilibrated in MALS buffer (25 mM Tris–HCl, pH 7.5, 100 mM NaCl, 4 mM MgCl2, and 2 mM EGTA). Where specified, wild-type or mutant atlastin-1 was incubated with GDP, GppNHp, or GDP·AlFx (2 mM) for 30 min at room temperature prior to injection. The column was coupled to a static 18-angle light scattering detector (DAWN HELEOS-II) and a refractive index detector (Optilab T-rEX) (Wyatt Technology). Data were collected every second at a flow rate of 1 ml/min. Data analysis was carried out using the program ASTRA V, yielding the molar mass and mass distribution (polydispersity) of the sample. For normalization of the light scattering detectors and data quality control, monomeric BSA (Sigma) was used. Molecular weight distributions were determined by using the Multipeak Fitting Package in Igor Pro (WaveMetrics).
GTPase assay
GTPase activity was measured using the Enzchek Phosphate Assay kit (Molecular Probes) following the manufacturer’s instructions. Measurements were carried out in a 96-well plate (Nunc) in a total volume of 250 μl. Recombinant wild-type or mutant atlastin-1 (at concentrations 0, 0.25, 0.5, 1, 2, and 4 μM) was combined with 1 U/ml purine nucleoside phosphorylase (PNP), 200 μM 2-amino-6-mercapto-7-methylpurine riboside (MESG), and provided buffer (20 mM Tris–HCl, pH 7.5, 1 mM MgCl2, 0.1 mM sodium azide). The plate was incubated at room temperature for 10 min, after which reactions were started by addition of 400 μM GTP (or alternatively, 50 mM Tris–HCl pH 7.5 for controls). Plates were assayed at 37°C in a Powerwave XS microplate reader (BioTek). Absorbance at 360 nm was monitored in 30 s intervals for 30 min. Data were normalized to a phosphate standard curve, and initial velocities were calculated using the portion of the curve corresponding to the first 5% of consumed product. Data reported are means±s.e.m. of three independent experiments.
Dye labelling of atlastin-1
Dye labelling using Alexa dyes 488-C5 maleimide and 647-C2 maleimide (Invitrogen) for donor and acceptor, respectively, was performed using the manufacturer’s guidelines. In brief, protein at a final concentration of ∼80 μM was mixed with a 15 × molar excess of the dye molecule in a final buffer composition of 25 mM Tris–HCl, pH 7.4, 100 mM NaCl, and 0.5 mM TCEP. Protein was incubated with the reducing agent TCEP for ∼15 min prior to mixing with dye. All reactions were topped off with nitrogen before sealing off the reaction tubes to reduce reactive oxygen species. Reactions were kept at room temperature for 2 h, followed by overnight incubation at 4°C, all in the absence of light. Reactions were quenched by the addition of 50 mM β-mercaptoethanol. Excess dye was then removed using Millipore concentrators (30 kDa cutoff) with several rounds of buffer exchange, followed by determination of degree-of-labelling (DOL). All reactions used for FRET measurements reached a DOL of 90–110%.
FRET measurements
FRET measurements were made by mixing 1 μM of donor atlastin-1 (ECFP tagged or Alexa 488 labelled) and 20 μM acceptor atlastin-1 (EYFP tagged or Alexa 647 labelled) in assay buffer (25 mM Tris–HCl, pH 7.4, 100 mM NaCl, and 4 mM MgCl2), with or without 2 mM GTP, GDP, or GppNHp. Measurements taken for GDP-AlF4− were done using 25 mM Tris–HCl, pH 7.4, 100 mM NaCl, 4 mM MgCl2, 2 mM EGTA, 2 mM AlCl2, and 20 mM NaF with or without 2 mM GDP. Measurements were taken on a UV–Vis spectrofluorometer (PTI Quantamaster 40), exciting at 445 nm (ECFP) or 493 nm (Alexa 488) and scanning emission spectra between 455 and 650 nm (ECFP/EYFP) or 505 and 800 nm (Alexa 488/647). All measurements were performed in triplicate. FRET efficiencies were calculated by using the emission intensity of the apo state (no nucleotide) at 473 nm (emission peak of ECFP) or 516 nm (emission peak of Alexa 488) as the no-FRET scenario. The following equation was used to calculate the FRET efficiency for equilibrium experiments:
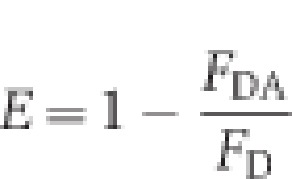
where E is FRET efficiency, _F_DA is the fluorescence intensity of the donor with the acceptor present, and _F_D is the fluorescence intensity of the donor without the acceptor. Distance estimates were calculated using the equation:
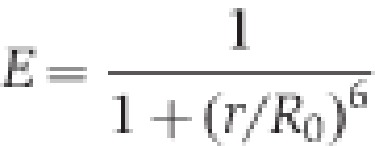
where E is the FRET efficiency, calculated above, r is the actual distance (to be calculated), and _R_0 is the Förster distance for a particular FRET pair. For ECFP/EYFP, _R_0 is 47 Å, and for Alexa 488/647 is 56 Å.
Kinetic FRET data were recorded using a stopped-flow instrument (Kintek SF-2004) with submillisecond mixing dead times. A mixture of donor and acceptor atlastin-1 (both at 1 μM) in assay buffer were mixed with either buffer alone or buffer supplemented with nucleotide (2 mM GDP, GTP, GppNHp, or GTPγS) using the stopped-flow drive syringes. In the case of GDP·AlFx, the protein donor/acceptor mixture was in a buffer containing 25 mM Tris–HCl, pH 7.4, 100 mM NaCl, and 4 mM MgCl2, 2 mM EGTA, 2 mM AlCl2, and 20 mM NaF. This was then mixed with this buffer supplemented with 2 mM GDP. The two solutions were mixed at a ratio of 1:1, at a flow rate of 8 ml/s in a total cell volume of 30 μl. The cell was illuminated by light from a xenon arc lamp, with a monochromator used to select a narrow band around 445 nm (the excitation of ECFP) or 493 nm (the excitation of Alexa 488). Fluorescence signals from ECFP/EYFP or Alexa 488/647 were recorded using two independent photomultiplier tubes with appropriate filters (Chroma) in place (B460-490, D535/25 for ECFP/EYFP; D525/50, HQ645/75 for 488/647).
Kinetic modelling of fast-mixing FRET
FRET simulations were programmed and performed using MATLAB R2010b (Mathworks). First, time-dependent binding was modelled by simple second-order kinetics for dimerization constrained by the mass conservation law. Discrete time steps of 10 ms were used to match instrumentation resolution. The bound-state model for the dimer consisted of two quasi-stable configuration states: the initial dimerization state D1 and a relaxed dimer state D2. Transitions between these states were governed by a relaxation rate constant _k_12, the transition time _τ_12, and a set of transition states _D_12. Finally, by assuming the proximity of conjugate labels within dimers at each configuration and transition state, the Förster equation was used to determine FRET efficiencies, and to calculate the total simulated FRET signal at each time step. A full description of equations used and assumptions made are described in Supplementary Material/Appendix.
N-Methylanthraniloyl (Mant)-nucleotide binding
On and off rates of mant nucleotides (mant-GppNHp, mant-GDP, or mant-GTP) were determined by measuring the change in fluorescence of the mant nucleotide over time upon mixing with atlastin-1 constructs. Using a Kintek stopped-flow apparatus (Kintek SF-2004), a final concentration of 2.5 μM mant-GDP, mant-GTP, or mant-GppNHp (Invitrogen) was mixed with increasing concentrations of atlastin-1 (10–50 μM). Mant fluorescence (λexc=366 nm, emission filter HQ460/40M; Chroma) was measured and the first 500 ms of data was fit to a single-exponential decay curve. Observed rate constants from exponential fits were plotted versus protein concentration, with the resulting slope of the linear fit corresponding to _k_on, and the y intercept to _k_off. In parallel experiments, the off rate (_k_off diss.) was also directly measured by preloading atlastin-1 proteins with mant nucleotide and chasing with a high concentration (2.5 mM) of unlabelled nucleotide (GDP). The first 500 ms of the resulting fluorescence decay curve was fit to a single-exponential decay, whose observed rate constant corresponds directly to the off rate (_k_off). All fits were performed using Prism 5 (GraphPad Software Inc.). Rates obtained from both techniques are listed in Table I.
Accession numbers
Atomic coordinates and structure factors have been deposited in the RCSB Protein Data Bank under ID code 4IDN, 4IDO, 4IDP, and 4IDQ.
Supplementary Material
Supplementary Information
Review Process File
Acknowledgments
We thank Richard Cooley for help with the final refinement of the crystal structures. This work is based upon research conducted at the Cornell High Energy Synchrotron Source (CHESS). The facility is supported by award DMR-0225180 from the National Science Foundation and award RR-01646 from the National Institutes of Health (to CHESS). This work was supported by the NIH under awards P41 RR04224 (WRZ) T32 GM008267 (LJB and AS), T32 GM008500 (JPO), R01 GM090320 (KS), and 1F31 NS077650 (LJB); and a PEW scholar award in Biomedical Sciences (HS).
Author contributions: LJB and HS conceived the project. LJB, AS, KS, WRZ, and HS designed the experiments. LJB, AS, KS, NMB, and HS performed the experiments. LJB, AS, KS, JPO, WRZ, and HS analysed the data. LJB and HS wrote the paper.
Footnotes
The authors declare that they have no conflict of interest.
References
- Adams PD, Grosse-Kunstleve RW, Hung LW, Ioerger TR, McCoy AJ, Moriarty NW, Read RJ, Sacchettini JC, Sauter NK, Terwilliger TC (2002) PHENIX: building new software for automated crystallographic structure determination. Acta Crystallogr D Biol Crystallogr 58: 1948–1954 [DOI] [PubMed] [Google Scholar]
- Bashkirov PV, Akimov SA, Evseev AI, Schmid SL, Zimmerberg J, Frolov VA (2008) GTPase cycle of dynamin is coupled to membrane squeeze and release, leading to spontaneous fission. Cell 135: 1276–1286 [DOI] [PMC free article] [PubMed] [Google Scholar]
- Bian X, Klemm RW, Liu TY, Zhang M, Sun S, Sui X, Liu X, Rapoport TA, Hu J (2011) Structures of the atlastin GTPase provide insight into homotypic fusion of endoplasmic reticulum membranes. Proc Natl Acad Sci USA 108: 3976–3981 [DOI] [PMC free article] [PubMed] [Google Scholar]
- Byrnes LJ, Sondermann H (2011) Structural basis for the nucleotide-dependent dimerization of the large G protein atlastin-1/SPG3A. Proc Natl Acad Sci USA 108: 2216–2221 [DOI] [PMC free article] [PubMed] [Google Scholar]
- Chappie JS, Acharya S, Leonard M, Schmid SL, Dyda F (2010) G domain dimerization controls dynamin’s assembly-stimulated GTPase activity. Nature 465: 435–440 [DOI] [PMC free article] [PubMed] [Google Scholar]
- Chappie JS, Mears JA, Fang S, Leonard M, Schmid SL, Milligan RA, Hinshaw JE, Dyda F (2011) A pseudoatomic model of the dynamin polymer identifies a hydrolysis-dependent powerstroke. Cell 147: 209–222 [DOI] [PMC free article] [PubMed] [Google Scholar]
- Depienne C, Stevanin G, Brice A, Dürr A (2007) Hereditary spastic paraplegias: an update. Curr Opin Neurol 20: 674–680 [DOI] [PubMed] [Google Scholar]
- Emsley P, Cowtan K (2004) Coot: model-building tools for molecular graphics. Acta Crystallogr D Biol Crystallogr 60: 2126–2132 [DOI] [PubMed] [Google Scholar]
- Evans K, Keller C, Pavur K, Glasgow K, Conn B, Lauring B (2006) Interaction of two hereditary spastic paraplegia gene products, spastin and atlastin, suggests a common pathway for axonal maintenance. Proc Natl Acad Sci USA 103: 10666–10671 [DOI] [PMC free article] [PubMed] [Google Scholar]
- Faelber K, Posor Y, Gao S, Held M, Roske Y, Schulze D, Haucke V, Noé F, Daumke O (2011) Crystal structure of nucleotide-free dynamin. Nature 477: 556–560 [DOI] [PubMed] [Google Scholar]
- Filla A, De Michele G, Marconi R, Bucci L, Carillo C, Castellano AE, Iorio L, Kniahynicki C, Rossi F, Campanella G (1992) Prevalence of hereditary ataxias and spastic paraplegias in Molise, a region of Italy. J Neurol 239: 351–353 [DOI] [PubMed] [Google Scholar]
- Fink JK (2006) Hereditary spastic paraplegia. Curr Neurol Neurosci Rep 6: 65–76 [DOI] [PubMed] [Google Scholar]
- Ford MG, Jenni S, Nunnari J (2011) The crystal structure of dynamin. Nature 477: 561–566 [DOI] [PMC free article] [PubMed] [Google Scholar]
- Gao S, Malsburg von der A, Dick A, Faelber K, Schröder GF, Haller O, Kochs G, Daumke O (2011) Structure of Myxovirus resistance protein a reveals intra- and intermolecular domain interactions required for the antiviral function. Immunity 35: 514–525 [DOI] [PubMed] [Google Scholar]
- Gasper R, Meyer S, Gotthardt K, Sirajuddin M, Wittinghofer A (2009) It takes two to tango: regulation of G proteins by dimerization. Nat Rev Mol Cell Biol 10: 423–429 [DOI] [PubMed] [Google Scholar]
- Ghosh A, Praefcke GJK, Renault L, Wittinghofer A, Herrmann C (2006) How guanylate-binding proteins achieve assembly-stimulated processive cleavage of GTP to GMP. Nature 440: 101–104 [DOI] [PubMed] [Google Scholar]
- Hu J, Prinz WA, Rapoport TA (2011) Weaving the web of ER tubules. Cell 147: 1226–1231 [DOI] [PMC free article] [PubMed] [Google Scholar]
- Hu J, Shibata Y, Zhu P-P, Voss C, Rismanchi N, Prinz WA, Rapoport TA, Blackstone C (2009) A class of dynamin-like GTPases involved in the generation of the tubular ER network. Cell 138: 549–561 [DOI] [PMC free article] [PubMed] [Google Scholar]
- Kenniston JA, Lemmon MA (2010) Dynamin GTPase regulation is altered by PH domain mutations found in centronuclear myopathy patients. EMBO J 29: 3054–3067 [DOI] [PMC free article] [PubMed] [Google Scholar]
- Leonardis L, Auer-Grumbach M, Papić L, Zidar J (2012) The N355K atlastin 1 mutation is associated with hereditary sensory neuropathy and pyramidal tract features. Eur J Neurol 19: 992–998 [DOI] [PubMed] [Google Scholar]
- Liu TY, Bian X, Sun S, Hu X, Klemm RW, Prinz WA, Rapoport TA, Hu J (2012) Lipid interaction of the C terminus and association of the transmembrane segments facilitate atlastin-mediated homotypic endoplasmic reticulum fusion. Proc Natl Acad Sci USA 109: E2146–E2154 [DOI] [PMC free article] [PubMed] [Google Scholar]
- Liu Y-W, Neumann S, Ramachandran R, Ferguson SM, Pucadyil TJ, Schmid SL (2011) Differential curvature sensing and generating activities of dynamin isoforms provide opportunities for tissue-specific regulation. Proc Natl Acad Sci USA 108: E234–E242 [DOI] [PMC free article] [PubMed] [Google Scholar]
- Low H, Löwe J (2006) A bacterial dynamin-like protein. Nature 444: 766–769 [DOI] [PubMed] [Google Scholar]
- Morin-Leisk J, Saini SG, Meng X, Makhov AM, Zhang P, Lee TH (2011) An intramolecular salt bridge drives the soluble domain of GTP-bound atlastin into the postfusion conformation. J Cell Biol 195: 605–615 [DOI] [PMC free article] [PubMed] [Google Scholar]
- Moss TJ, Andreazza C, Verma A, Daga A, Mcnew JA (2011) Membrane fusion by the GTPase atlastin requires a conserved C-terminal cytoplasmic tail and dimerization through the middle domain. Proc Natl Acad Sci USA 108: 11133–11138 [DOI] [PMC free article] [PubMed] [Google Scholar]
- Namekawa M, Muriel M-P, Janer A, Latouche M, Dauphin A, Debeir T, Martin E, Duyckaerts C, Prigent A, Depienne C, Sittler A, Brice A, Ruberg M (2007) Mutations in the SPG3A gene encoding the GTPase atlastin interfere with vesicle trafficking in the ER/Golgi interface and Golgi morphogenesis. Mol Cell Neurosci 35: 1–13 [DOI] [PubMed] [Google Scholar]
- Namekawa M, Ribai P, Nelson I, Forlani S, Fellmann F, Goizet C, Depienne C, Stevanin G, Ruberg M, Dürr A, Brice A (2006) SPG3A is the most frequent cause of hereditary spastic paraplegia with onset before age 10 years. Neurology 66: 112–114 [DOI] [PubMed] [Google Scholar]
- Orso G, Pendin D, Liu S, Tosetto J, Moss T, Faust J, Micaroni M, Egorova A, Martinuzzi A, McNew JA, Daga A (2009) Homotypic fusion of ER membranes requires the dynamin-like GTPase Atlastin. Nature 460: 978–983 [DOI] [PubMed] [Google Scholar]
- Otwinowski Z, Minor W (1997) Processing of X-ray diffraction data. Methods Enzymol 276: 307–326 [DOI] [PubMed] [Google Scholar]
- Park SH, Zhu P-P, Parker RL, Blackstone C (2010) Hereditary spastic paraplegia proteins REEP1, spastin, and atlastin-1 coordinate microtubule interactions with the tubular ER network. J Clin Invest 120: 1097–1110 [DOI] [PMC free article] [PubMed] [Google Scholar]
- Pendin D, Tosetto J, Moss TJ, Andreazza C, Moro S, Mcnew JA, Daga A (2011) GTP-dependent packing of a three-helix bundle is required for atlastin-mediated fusion. Proc Natl Acad Sci USA 108: 16283–16288 [DOI] [PMC free article] [PubMed] [Google Scholar]
- Polo JM, Calleja J, Combarros O, Berciano J (1991) Hereditary ataxias and paraplegias in Cantabria, Spain. An epidemiological and clinical study. Brain 114: 855–866 [DOI] [PubMed] [Google Scholar]
- Praefcke GJK, Kloep S, Benscheid U, Lilie H, Prakash B, Herrmann C (2004) Identification of residues in the human guanylate-binding protein 1 critical for nucleotide binding and cooperative GTP hydrolysis. J Mol Biol 344: 257–269 [DOI] [PubMed] [Google Scholar]
- Prakash B, Praefcke GJ, Renault L, Wittinghofer A, Herrmann C (2000) Structure of human guanylate-binding protein 1 representing a unique class of GTP-binding proteins. Nature 403: 567–571 [DOI] [PubMed] [Google Scholar]
- Pucadyil TJ, Schmid SL (2008) Real-time visualization of dynamin-catalyzed membrane fission and vesicle release. Cell 135: 1263–1275 [DOI] [PMC free article] [PubMed] [Google Scholar]
- Rismanchi N, Soderblom C, Stadler J, Zhu P-P, Blackstone C (2008) Atlastin GTPases are required for Golgi apparatus and ER morphogenesis. Hum Mol Genet 17: 1591–1604 [DOI] [PMC free article] [PubMed] [Google Scholar]
- Salinas S, Proukakis C, Crosby A, Warner TT (2008) Hereditary spastic paraplegia: clinical features and pathogenetic mechanisms. Lancet Neurol 7: 1127–1138 [DOI] [PubMed] [Google Scholar]
- Sanderson CM, Connell JW, Edwards TL, Bright NA, Duley S, Thompson A, Luzio JP, Reid E (2006) Spastin and atlastin, two proteins mutated in autosomal-dominant hereditary spastic paraplegia, are binding partners. Hum Mol Genet 15: 307–318 [DOI] [PMC free article] [PubMed] [Google Scholar]
- Schrödinger GF (2010) The PyMOL Molecular Graphics System, Version ∼1.3r1.
- Song BD, Leonard M, Schmid SL (2004) Dynamin GTPase domain mutants that differentially affect GTP binding, GTP hydrolysis, and clathrin-mediated endocytosis. J Biol Chem 279: 40431–40436 [DOI] [PubMed] [Google Scholar]
- Stefano G, Renna L, Moss T, Mcnew JA, Brandizzi F (2011) In Arabidopsis, the spatial and dynamic organization of the endoplasmic reticulum and Golgi apparatus is influenced by the integrity of the C-terminal domain of RHD3, a non-essential GTPase. Plant J 69: 957–966 [DOI] [PubMed] [Google Scholar]
- Stowell MH, Marks B, Wigge P, McMahon HT (1999) Nucleotide-dependent conformational changes in dynamin: evidence for a mechanochemical molecular spring. Nat Cell Biol 1: 27–32 [DOI] [PubMed] [Google Scholar]
- Warnock DE, Hinshaw JE, Schmid SL (1996) Dynamin self-assembly stimulates its GTPase activity. J Biol Chem 271: 22310–22314 [DOI] [PubMed] [Google Scholar]
- Zhang P, Hinshaw J (2001) Three-dimensional reconstruction of dynamin in the constricted state. Nat Cell Biol 3: 922–926 [DOI] [PubMed] [Google Scholar]
- Zhao X, Alvarado D, Rainier S, Lemons R, Hedera P, Weber CH, Tukel T, Apak M, Heiman-Patterson T, Ming L, Bui M, Fink JK (2001) Mutations in a newly identified GTPase gene cause autosomal dominant hereditary spastic paraplegia. Nat Genet 29: 326–331 [DOI] [PubMed] [Google Scholar]
Associated Data
This section collects any data citations, data availability statements, or supplementary materials included in this article.
Supplementary Materials
Supplementary Information
Review Process File
