Widespread evidence of cooperative DNA binding by transcription factors in Drosophila development (original) (raw)
Abstract
Regulation of eukaryotic gene transcription is often combinatorial in nature, with multiple transcription factors (TFs) regulating common target genes, often through direct or indirect mutual interactions. Many individual examples of cooperative binding by directly interacting TFs have been identified, but it remains unclear how pervasive this mechanism is during animal development. Cooperative TF binding should be manifest in genomic sequences as biased arrangements of TF-binding sites. Here, we explore the extent and diversity of such arrangements related to gene regulation during Drosophila embryogenesis. We used the DNA-binding specificities of 322 TFs along with chromatin accessibility information to identify enriched spacing and orientation patterns of TF-binding site pairs. We developed a new statistical approach for this task, specifically designed to accurately assess inter-site spacing biases while accounting for the phenomenon of homotypic site clustering commonly observed in developmental regulatory regions. We observed a large number of short-range distance preferences between TF-binding site pairs, including examples where the preference depends on the relative orientation of the binding sites. To test whether these binding site patterns reflect physical interactions between the corresponding TFs, we analyzed 27 TF pairs whose binding sites exhibited short distance preferences. In vitro protein–protein binding experiments revealed that >65% of these TF pairs can directly interact with each other. For five pairs, we further demonstrate that they bind cooperatively to DNA if both sites are present with the preferred spacing. This study demonstrates how DNA-binding motifs can be used to produce a comprehensive map of sequence signatures for different mechanisms of combinatorial TF action.
INTRODUCTION
A major challenge in understanding transcriptional gene regulation in eukaryotes is to uncover how transcription factors (TFs) act together to implement tissue-specific gene expression (1). There is an increasing number of examples of co-acting TFs in the literature today, including cases of direct protein–protein interactions (PPIs), indirect chromatin-mediated interactions (such as short/long-range repression and pioneer factor effects) and independent co-regulation of target genes (2–8). In particular, cooperative interactions of TFs with DNA have been recognized as an important modulator of TF activity in vivo since early studies of bacteriophage promoters (9,10). Cooperative TF binding to precisely spaced pairs of recognition sequences can produce complexes with greater specificity, facilitate binding to weaker motif matches or produce more switch-like behavior in response to concentration changes (11–13).
Although many individual examples of cooperative TF binding have been previously described, it is difficult to perform systematic searches for this phenomenon. High-throughput screening approaches such as Yeast 2-hybrid and co-affinity purification coupled to mass spectrometry analysis have been developed to find physically interacting proteins, including TFs, for several organisms (14–22). However, these interaction screens typically recover only a fraction (20–40%) of interactions (20,21). In one recent study of TF–TF interactions in mammalian cells, 25% of literature interactions was recovered (22). They also do not reveal how the physical interaction between two TFs may manifest as specific arrangements of binding sites such as biased inter-site spacing and orientation. Such ‘grammar rules’ will be key to successfully using the knowledge of TF interactions in building gene regulatory networks (23) and modeling gene expression from sequence (24). Thus, despite the emergence of large-scale PPI screening technologies, there remains a major gap in our understanding of how combinatorial TF action contributes to gene regulation. Our goal is to help bridge this gap through a systematic analysis of binding site locations in accessible genomic regions predicted from a large collection of TF motifs, resulting in a comprehensive map of potential TF pair interactions. These data can be further elaborated by TF expression data to define potential interacting partners when the recognition motifs of multiple TFs within a genome are similar.
Compiled sets of TF-binding specificities have enabled motif enrichment analysis tools such as Clover/PASTAA to find motifs likely to act in particular tissues and to predict co-acting TFs (25–27). However, such analyses have been limited to relatively modest numbers of motifs [e.g. motifs in _Drosophila_ segmentation network (25)] previously available. Moreover, identifying TFs that may regulate gene expression in the same tissue type does not discriminate between different modes of TF co-action. In particular, these methods do not examine whether the binding site arrangement of TF pairs carries clues about direct physical interactions between the two TFs.
A few studies have searched for specific patterns of binding site arrangements within regulatory regions such as enhancers. These studies have mostly examined spacing between heterotypic pairs of sites and neglect other aspects of site arrangements, such as relative orientation of site pairs, or spacing biases exclusive to specific relative orientations (11–13,28). Also, their application has been limited to small collections of enhancers and TFs (29–33). In a related study, Whitington et al. (19) developed a program called SpaMo that searches a TF’s bound regions (BRs) for overrepresentation of secondary motifs at a specific distance from the ChIP peak’s ‘summit’ or from the location of the primary motif. However, their approach to detecting sequence signatures of TF interactions does not explicitly consider (i) the phenomenon of binding site clustering (34,35), (ii) the background frequency of each motif within the genome and (iii) the relative orientation of binding sites. All three of these properties are expected to influence the statistics of site arrangement patterns (see ‘Discussion’ section). In addition, the relatively small number of metazoan TFs with high-quality ChIP data sets currently available represents an additional limitation of this approach.
In this study, we use binding motifs for 322 Drosophila TFs characterized using the Bacterial 1-Hybrid (B1H) technology (36–39), a Hidden Markov Model-based scoring scheme (40,41) and chromatin accessibility (ACC) information from DNase I hypersensitivity assays (42) to produce computational maps of genome-wide TF–DNA binding in different stages of embryonic development in Drosophila melanogaster. We next analyze the common binding locations of TF pairs for statistical patterns in the relative spacing and orientation between binding sites using a newly designed statistical tool called ‘interacting TF signatures’ (iTFs), which is available as an online service at http://veda.cs.uiuc.edu/iTFs. Our analysis identifies several hundred instances where short distance preferences are observed between binding sites for a single TF or a pair of TFs and many instances where such preferences are stronger under specific relative orientations. We use in vitro PPI assays to confirm a physical association between many of these inferred TF pairs, and that several of these TF pairs bind DNA cooperatively with a preference for the computationally detected inter-site distance. Overall, this study produces an extensive map of hundreds of sequence signatures for combinatorial TF action involving inter-site spacing and orientation biases and thereby provides a more complete view of how the complexity of sequence constraints dictates the regulatory potential of these factors in vivo.
MATERIALS AND METHODS
TF-ChIP data sets
We obtained 33 TF-ChIP profiles from various sources (43–49). The selected ChIP profiles corresponded to stage 5 of embryonic development or to a longer developmental period that included this stage. For more details on the source of each TF-ChIP data set, see Supplementary Table S1.
Selecting genomic regions
We divided the entire genome to ∼241 k non-overlapping segments of size 500 bp. All the analyses were performed on release 5.34 of the D. melanogaster genome. We ‘N’-masked the entire genome using Tandem Repeat Finder v4.04 (50). We further removed all the segments in the genome that overlapped >50% with exons or repeats of type ‘Satellite’, ‘Low complexity’ and ‘Simple’ obtained from Repeat Library 20080611 for dm3 [(51), Repeatmasker Open3.0]. We only kept the segments that were accessible (DNase I hypersensitivity scores in the top 10%) during the relevant stages of development (42). This covered ∼6–8 mbp (∼11–16 k segments depending on stage) of the entire genome. The accessibility score in each segment was obtained by averaging the raw scores in that segment.
Spatial co-expression of TF pairs
We obtained spatial expression information on TFs from Berkeley Drosophila Genome Project (52,53). We removed the expression terms that did not carry any spatial information (e.g. fertilized egg) or were too broadly defined (e.g. ‘maternal’, a term assigned to >1000 genes of ∼7000 annotated genes in the database). We found spatial expression annotation for 310 of 322 TFs (Supplementary Table S2). We created a data set of 32 537 spatially co-expressed TF pairs. This data set included 15 090 TF pairs that were co-expressed in a specific tissue (i.e. neither of the TFs in a given TF pair was annotated with ubiquitous expression in the corresponding tissue) and 17 477 TF-pairs for which either TF was annotated with ubiquitous expression in the corresponding stage of development.
Motif collection
We obtained 613 binding specificities (motifs) for 322 TFs from FlyFactorSurvey (39) (September 2011). The vast majority of these motifs were characterized by the B1H technology. In cases where multiple motifs were available for the same TF (based on different sequencing technologies), we preferred the one obtained from SOLEXA method to SANGER method, and B1H motifs were preferred to motifs from the FlyReg database. All selected motifs are made available in Supplementary File 1. Positions from both ends of the motif were removed if they had information content <0.25, unless the length of the resulting motif becomes <6 bp. On average, this procedure trimmed down motifs to ∼85% of their original length. All trimmed motifs are made available in Supplementary File 2.
Motif similarity
Two motifs were considered similar if either their similarity _q_-value reported by the TOMTOM program (54) is <0.2 or their consensus sequences are identical (or one consensus sequence is a substring of the other). All parameters of the TOMTOM program were kept at default values.
TF pairs with known PPI from high-throughput assays
We downloaded the ‘Jan-2012, non-combined’ version of D. melanogaster networks from GeneMANIA and selected the Physical interactions databases (55). We chose all pairs of interactions where both partners were among the 322 TFs studied by us. This revealed 122 TF pairs with previously reported PPI. GeneMANIA does not provide examples of homotypic site interactions. To include such interactions, we collected all 13 homotypic interactions included in the BioGRID database v3.1.86 in D. melanogaster (56) that correspond to TFs studied here. We additionally included 15 heterotypic TF pairs from BioGRID that were not present in GeneMANIA, thus creating a collection of 137 heterotypic and 13 homotypic TF pairs.
Locating individual binding sites
We used the FIMO program (57) for locating individual binding sites in a sequence. In cases of overlapping binding sites, we kept the strongest binding site (i.e. the site with the largest LLR score to the motif) and broke ties, if any, by randomly choosing among the sites with the same score. All the parameters of FIMO were kept at default values except ‘-thresh’ that was set to 0.000912 (= e−7).
Statistical tests of relative orientation bias in co-binding segments of a TF pair
Given the set of genomic segments where a TF pair is predicted to co-bind, we noted the relative orientation of each pair of adjacent binding sites (one binding site for each TF in a TF pair) and tested for overrepresentation of a particular orientation using a Binomial test. Every possible orientation was considered equally likely a priori.
Statistical tests of inter-site spacing bias
To test for a spacing bias between a pair of motifs in a given set of sequences, we first identified all pairs of adjacent heterotypic binding sites [obtained by using the FIMO program (57)] and categorized them as having inter-site distance within or outside a fixed range, which is either 0–10, 10–25, 25–50 or 50–100 bp. (To test for homotypic site-spacing biases, we considered all pairs of adjacent binding sites.) We then compared the counts of within-range site pairs and outside range site pairs to corresponding counts in a ‘background’ data set using a one-tailed Fisher’s exact test on the corresponding contingency table (Supplementary Table S11). To construct the ‘background’ data set, we shuffled the locations of predicted sites in each given sequence and pooled together 10 such randomized data sets. Shuffling the locations preserves the number of binding sites in each sequence.
Comparison between iTFs and SpaMo
For each method (SpaMo or iTFs), we first estimated the spacing bias significance threshold that corresponds to a fixed false-positive rate (FPR), using randomized data sets. In particular, we first selected 10 TF pairs at random from all possible TF pairs. For each TF pair, we collected the sequences where the two TFs are predicted to co-bind and shuffled the locations of binding sites (predicted using FIMO) in each sequence. This gives us one randomized data set, on which a spacing bias should not be detected. Repeating the random shuffling step 100 times gave us 100 data sets for each TF pair and 1000 in all (as 10 TF pairs were considered). We then used each tool (SpaMo or iTFs) separately to detect spacing biases in these 1000 randomized data sets and recorded the spacing bias significance threshold at which a certain number of biases were detected. This gave us a mapping between the significance values reported by each method and FPR on a common benchmark of randomized data sets. When using a tool on any data set, we treated the best spacing bias among all orientations as the spacing bias reported for that data set. We ran the SpaMo program with two different parameter settings: (i) default, where we kept all the parameters as their default values and (ii) adjusted, where we changed four of the parameters to match them with those of iTFs [‘bin’ = 10, ‘minscore’ = 3.04 (corresponding to e−7), ‘overlap’ = 0 and ‘margin’ = 100].
Correlation between motif profiles and chromatin accessibility profiles
For each developmental stage for which ACC data were available (42), we created an ‘ACC data set’. The ACC data set comprises 1000 accessible and 1000 random non-coding segments of length 500 bp. The average of all read scores (from DNase I hypersensitivity assays) in each segment were treated as its accessibility score. We used the STUBB program (40) to predict TF binding level for each segment in a data set. We then computed the Pearson Correlation Coefficient between ACC scores and STUBB scores across the 2000 windows in each data set.
Protein–protein and protein–DNA-binding assays
Open reading frame (ORF) clones for TFs were part of the Berkeley Drosophila Genome Project from the collection of universal donor clones. ORFs were transferred into two vectors, pHPT7-FRluc-BD and pHPT7-MBP-BD, using Cre Recombinase (New England Biolabs, M0298L). For one TF, Kruppel (KR), the ORF was PCR amplified ligated into AscI and PmeI restriction sites in each vector. These vectors contain a T7 promoter for in vitro transcription, a loxP site for cloning and either maltose-binding protein (MBP) or Renilla luciferase (luc)-coding regions. Clone names and primer sequences are provided in supplementary information (Supplementary Tables S8–10). Proteins were made by coupled in vitro transcription/translation using the PURExpress In Vitro Protein Synthesis Kit (New England Biolabs, E6800S). Samples were analyzed by western blot to confirm that some full-length product was obtained. Luciferase input was measure using the Renilla Luiferase Assay System (Promega, E2820). PPIs were performed using a variation of the LUMIER method (58,59), modified as described in Cheng et al. (manuscript in review).
DNA sequences were designed to contain two known binding sites from target genes containing a particular spacing and orientation. Oligonucleotides ranged from 24 to 42 bp in length and were annealed to the reverse complement to generate double-stranded DNA with no overhangs. One oligonucleotide containing the wild-type sequence with binding sites for each TF pair was biotin labeled at the first residue and used as the probe. A series of mutations were made to the consensus site to disrupt the binding sites or alter the spacings. A full list of wild-type and mutant oligo sequences can be found in Supplementary Information.
Protein–DNA interactions were measured in a modification of a previously described microwell-based assay (60). Proteins were diluted with low-stringency binding buffer [140 mM KCl, 5 mM NaCl, 1 mM K2HPO4, 2 mM MgSO4, 20 mM HEPES (pH 7.05), 100 µM EDTA, 1 µM ZnSO4] +1% BSA such that 106 counts of luciferase activity were present in 10 µl. A 10 µl of DNA mixture was made from 2 µl of 1.2 uM biotinylated DNA, 6 µl of competitor DNA and 2 µ of 500 ng/µ Poly(dI-C)*Poly(dI-dC) and incubated for 1 h. Proteins were diluted such that 106 luciferase counts were present in each 10 µl of sample. An equivalent amount of MBP protein was included for heterodimers contained two TFs. The diluted proteins were added to the DNA mixtures and incubated with gentle rocking at 25°C for 2 h. Streptavidin-coated sepharose beads (GE Lifesciences, 17-5113-01) were blocked with 5% BSA, added to the TF–DNA mixture and incubated for 2 h at 4°C. The samples were washed twice with low-stringency-binding buffer and transferred to 96-well plates (Corning, 07-200–589) for luciferase measurements. The readings were normalized by dividing by the sample containing a mutation in both predicted TF-binding sites as the competitor.
RESULTS
Computational prediction of TF-binding landscapes
Our first goal was to predict genome-wide binding locations of individual TFs that will be used later to recover signatures of TF interactions. We obtained TF-binding specificities (motifs) of 322 TFs from the FlyFactorSurvey database (39). For each TF, we used the STUBB program (40,41) to predict the TF binding at 500 bp segments located in accessible chromatin regions (see ‘Materials and Methods’ section). We first sought to assess the quality of these computational profiles by comparison to ChIP data. We treated the average ChIP scores in each 500 bp segment as the TF-binding level in that segment and calculated the Pearson correlation coefficient between the ChIP scores and STUBB scores. We observed a highly significant correlation (P < E-18) for 31/33 of the TFs where ChIP data were available, with 20/33 data sets having correlation coefficient >0.15 (P < E-114, Supplementary Table S1). On average, the accessible chromatin regions with the top 2000 STUBB-scores included 566 ChIP peaks (average across 20 data sets, Supplementary Table S1). If sufficient ChIP data were available, sites of cooperative TF binding would be expected to exhibit occupancy of both TFs. Our observations suggested that a promising alternative strategy to systematically search for signatures of TF interactions might be to apply our sequence analysis methods to regions where both TFs are predicted to bind.
Development and testing of a new method to detect site arrangement patterns
We searched for patterns in the relative positioning of TF-binding sites. For each TF pair, we selected the top 500 segments, of length 500 bp each, where both TFs are predicted to bind (based on accessibility and STUBB scores as aforementioned). These segments were masked for short tandem repeats (see ‘Materials and Methods’ section). We used the FIMO program (57) to locate individual binding sites in every selected segment and to assign their orientations (see ‘Materials and Methods’ section). We inspected all adjacent pairs of binding sites of a TF pair (one site for each TF) or a single TF (for homodimeric analysis) and tested for statistical overrepresentation of (i) a particular relative orientation, (ii) a particular range of inter-site distances and (iii) an ‘orientation-specific’ distance range (Figure 1A, see ‘Materials and Methods’ section). In particular, we tested for the four possible relative orientations (named M13′-to-M23′, M15′-to-M25′, M15′-to-M23′ and M13′-to-M25′, see Figure 1B) and for four different inter-site distance ranges (0–10, 10–25, 25–50 and 50–100 bp). For each relative orientation, we additionally tested for distance biases between adjacent pairs of binding sites with that relative orientation. We called this last test an orientation-specific distance (OSD) bias test. A TF pair was said to have an OSD bias if its OSD bias was stronger than its distance bias. We refer to these three types of sequence signatures collectively as ‘site arrangement biases’. The testing procedure is described in ‘Materials and Methods’ section. It compares the frequency of site pairs with the tested arrangement bias in the given sequences to that in background sequences and produces a Fisher’s exact test _P_-value. Importantly, the statistical test is conditional on the numbers of binding sites in the given sequences and does not, for example, report a bias for short inter-site distances simply because there are many sites present. We call this new tool for detecting site arrangement biases ‘iTFs’.
Figure 1.
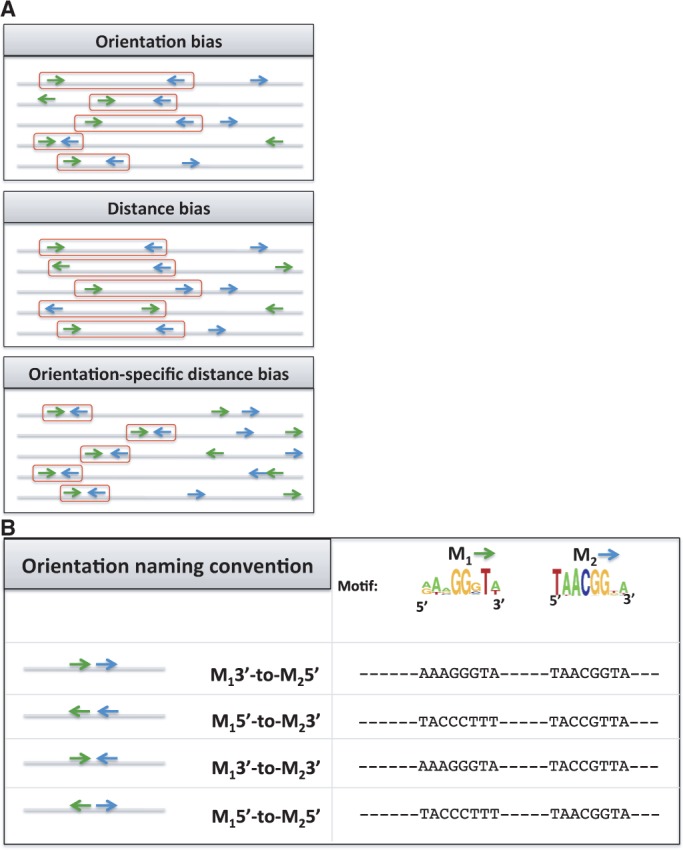
Schematic view of various site arrangements. (A) Types of site arrangement bias: orientation, distance and OSD bias. (B) Naming conventions (left panel) and instances (right panel) of relative orientations. The first two arrangements are equivalent for homotypic sites.
The SpaMo tool developed by Whitington et al. (19) provides a related functionality, viz., to detect signatures of TF pair interactions by examining inter-site spacing distributions in ChIP peaks of one of the TFs. Even though the sequences examined in our study are not ChIP peaks but sequences where TF-pairs are computationally predicted to co-bind, it is reasonable to attempt detecting site arrangement biases in these sequences using SpaMo. However, SpaMo and iTFs adopt different approaches to the task, as explained in the ‘Discussion’ section, and we sought to compare the two tools in terms of their accuracy. To do so, we first estimated the FPR that the significance level reported by each method corresponds to. This was done by constructing 1000 randomized data sets, each obtained by shuffling the locations of sites in real sequences and determining what fraction of the 1000 randomized data sets yielded significant spacing biases (see ‘Materials and Methods’ section). We then used each tool to detect spacing biases in a set of 100 randomly selected ‘real’ data sets, corresponding to 100 different TF pairs, at a fixed FPR. These were ‘real’ data sets in the sense that they corresponded to sequences where a TF pair is predicted to co-bind and involved no shuffling of sites. We have no prior knowledge of which and how many of these 100 data sets truly represent interacting TF pairs. The results are shown in Figure 2 (red curves), and we note that iTFs consistently detects spacing biases in more data sets than SpaMo does, across the spectrum of FPRs. For example, at an FPR of 0.05, iTFs detects spacing biases in 18 of the 100 data sets examined, whereas SpaMo reports an interaction signature in eight data sets, which included five where both methods detected a spacing bias. We repeated this comparison for discovery of homotypic site spacing biases (Figure 2, blue curves), and also with a different setting of SpaMo parameters (Supplementary Figure S1), and observed the same trends.
Figure 2.

Comparison between iTFs and SpaMo. For each method, the graph shows the number of predicted TF pairs (of 100) with distance bias as the significance level is varied. The _X_-axis shows the FPR corresponding to each significance level as estimated from randomized data. The thin and thick lines correspond to homotypic and heterotypic TF pairs, respectively.
A catalog of predicted TF interactions based on sequence signatures
We then performed iTFs analysis with all TFs and TF pairs. We corrected for the multiple hypothesis testing problem, which arises from testing many TF pairs for several distance ranges and orientations, by using a FDR of 5%. All results presented later in the text meet this criterion of statistical significance. In total, we found 1926 TF pairs with significant orientation, distance and/or OSD biases at 5% FDR (Supplementary Table S3). The FDR threshold of 5% was applied to multiple testing correction over all tests (including distance bias, orientation bias and OSD bias) and all tested TFs pairs. However, our statistical approach may not be able to completely deconvolute partner combinations when multiple TFs share similar motifs. Thus, if one TF pair has a significant bias of any kind, other TFs with similar motifs to a member of this pair might be expected to show the same bias. Recognizing this issue, we associated the 1926 TF pairs using Markov Cluster (MCL) algorithm (see ‘Materials and Methods’ section) so that each cluster represents one or more non-redundant TF-pair(s) that exhibit similar site arrangement biases. This resulted in 711 clusters, including 446 singleton clusters; each singleton cluster is a TF pair not similar to any other TF pair (Supplementary Table S4). We found that TF pairs with site arrangement biases were enriched for spatially co-expressed pairs (_P_-value 5E-5, see ‘Materials and Methods’ section). In the analysis described later in the text, we selected a single TF pair with the most significant site arrangement bias as a representative for its cluster. Figure 3A shows the frequencies of the three different types of site arrangement bias revealed by our analysis.
Figure 3.

Frequencies of different site arrangement biases. (A) Venn diagram of various site arrangement biases involving a total of 711 TF pairs. (B and C) For each of the four examined distance ranges, shown are the number of TF pairs with significant OSD bias (B) and distance bias (C) in that range. (D) Average number of partners with site arrangement biases, per TF, separated by TF families. (Only TF families with >10 TFs included in our analysis are shown.) The number of TFs in each family is shown in parentheses.
Homotypic binding site pairs frequently show arrangement bias
We searched, as described earlier in the text, for non-random patterns in relative spacing and orientation of heterotypic site pairs (sites of two different TFs) as well as homotypic site pairs (sites of the same TF). Heterotypic pairs tested (51 360 pairs) vastly outnumbered homotypic pairs (321 pairs). Interestingly, we found site arrangement biases for homotypic site pairs to be >9-fold more common than heterotypic pairs when normalized to the number of combinations tested. Of the 39 homotypic pairs with any site arrangement bias 35 showed a significant distance and/or OSD bias (at P < 1E-4, FDR = 5%). Overall, 11 homotypic pairs had an orientation bias (P < 5.5E-4, FDR = 5%) and all of these exhibited a preference for occurring in the same orientation (M13′-to-M25′ or M15′-to-M23′, see Figure 1B). Two pieces of evidence rule out the possibility that these sequence signatures reflect binding sites arising out of tandem duplications (61): (i) our testing procedure involved masking of computationally detected short tandem repeats before analyzing the sequences and (ii) direct experimental tests (later in the text) validated a large number of our predictions of homotypic interaction.
Site arrangement biases are prevalent among physically interacting TF pairs
We examined 150 previously reported cases of physical interactions (PPI) involving TFs (55), 13 of which were homotypic interactions and the remaining 137 were heterotypic TF–TF interactions. We observed six homotypic and seven heterotypic physical interactions to have sequence footprints in the form of site arrangement biases (at 5% FDR) (Supplementary Table S5), a 2.3-fold enrichment over the global frequency of site-level bias. When we relaxed the FDR value to 15% (corresponding to P < 0.005), 29 additional physically interacting TF pairs (42 in total) demonstrated site arrangement biases. Results of all 150 tests of site arrangement bias between TFs with known PPI are available at http://veda.cs.uiuc.edu/iTFs/B1H_Sig/html_ppi_all/. Missing interactions may represent false-positive PPIs in these previous studies or PPIs that do not result in sequence signatures that our method can detect.
Distance biases are often exclusive to specific relative orientations and involve short ranges
Most of the orientation biases were also associated with an OSD bias (Figure 3A and Supplementary Table S4). In particular, of the 84 TF pairs with an orientation bias (P < 5.5E-4, FDR = 5%), 51 showed an OSD bias _P_ ≤ 0.05 and 24 of these met the stringent criteria of FDR ≤5% (Figure 3A). Moreover, we observed an OSD bias for 312 TF pairs (of the 711 TF pair clusters reported earlier in the text, at _P_ < 1E-4, FDR = 5%) (Figure 3A and B), and ∼72% of these did not show an orientation bias overall (_P_ > 0.05). In other words, a preference for relative orientation is typically observed only when there is also a spacing bias specific to that orientation and in many cases is observed only when we test for spacing and orientation preference simultaneously. Such specific constraints on relative spacing and orientation are suggestive of physically interacting TF pairs, although most such pairs have not been previously known to interact directly.
Most distance biases recovered were in the 0–10 bp distance range. In total, we found 472 TF pairs with significant distance biases (P < 1E-4, FDR = 5%, Figure 3C). These included 417 TF pairs with a preference for an inter-site spacing of 0–10 bp; of these, 17 TF pairs additionally had a preference for the range 10–25 bp, and one, (homotypic site bias for longitudinals lacking, isoform LOLA-PI), also showed a bias for 25–50 bp spacing. Although we did not directly examine the periodicity of the preferred distance range for a TF pair, as was done in an earlier study (32), the observation of a distance bias in multiple ranges suggests the presence of such a ‘helical phasing’ phenomenon (62), where sites are spaced by some offset plus an integral number of helical turns. Sixty-six TF pairs had a significant preference for 10–25 bp distance range, of which more than half were exclusive to this range, with the most significant bias exhibited by the TF pair (JIM, knirps-like (KNRL)). We observed five TF pairs with 25–50 bp distance bias, of which all but one were exclusive to this range. Only two TF pairs were found with 50–100 bp distance bias. Inter-site spacing biases for different ranges may reflect different underlying interactions between TFs, e.g. the frequently observed short-range bias (0–10 bp) may be a signature of direct physical interactions of TFs bound to adjacent sites. Spacing preferences for a longer range (e.g. 25–50 bp or 50–100 bp) might reflect chromatin-mediated interactions or DNA looping. Indirect cooperation via nucleosome displacement has been experimentally examined in a number of systems; these experiments generally suggest that cooperativity occurs within a distance corresponding to either a complete (147 bp) or half (74 bp) nucleosome (63,64) and thus is likely to be associated with weaker constraints on inter-site spacing and longer spacing. A second mechanism of cooperative interaction, cooperative transcriptional activity, has been suggested to act over an even longer distance (4) and would be less likely to be recovered in our analysis. Supplementary Table S6 summarizes several instances of TF pairs with different types of site arrangement biases. We asked whether TF pairs exhibiting spacing bias in the shortest range (0–10 bp) were more frequently associated with orientation biases, which might suggest a steric constraint related to their proximal localization on the DNA. We did not find significant evidence for this phenomenon (data not shown).
Frequency of site arrangement bias varies by TF family
For each TF, we recorded the number of partner TFs with site arrangement biases. We found Medea (MED), Trithorax-like (TRL) and Jing interacting gene regulatory 1 (JIGR1) to have the greatest number of partners (Supplementary Table S7). TRL (also called GAGA factor) is widely known to be a chromatin remodeling factor (65–67) and as a ‘pioneer factor’ (68,69), and its motif has been found to be a determinant of context-specific DNA binding of other TFs (70). Figure 3D shows the average number of partners with site arrangement biases, for each major DNA binding domain. Homeodomain TFs were predicted to have small numbers of partners on average (P = 8E-11, see Supplementary Note 1), and none of the 39 TFs with > 10 predicted partners were from this family. (Also see Supplementary Figure S2 for a similar analysis that was performed without clustering of similar TF pairs; the general trend was observed here also.) It is interesting that one group of homeodomains, the Drosophila HOX genes, are known to exhibit latent (i.e. altered) specificities in some dimeric complexes (71), which may explain why those dimers were not detected by this method. If this phenomenon occurs with other homeodomains, it may contribute to a lower number of detected interactions for this family. On the other hand, TFs with ZF-C2H2 and MADF domains had a strong tendency to exhibit site arrangement biases (P = 2E-10 and 8E-4, respectively).
Site arrangement biases predict direct TF–TF interactions and cooperative DNA binding
We hypothesized that specific patterns of TF-binding site spacing and orientation could reflect PPIs between the corresponding pairs of TFs. These physical interactions could allow cooperative binding to DNA, but only when the sites are arranged such that each TF can bind both its site and the other TF. We experimentally examined direct PPIs for 27 predicted TF pairs with various site arrangement biases (Figure 4A). Each pair was tested for direct physical interaction using a variation of the LUMIER method (58,59), modified to analyze direct binding in vitro. Coding regions for each TF were fused to either luciferase (luc) or MBP, expressed using an in vitro bacterial transcription and translation system and incubated together. PPIs were tested by measuring recovery of the luc-tagged protein following purification of the MBP-tagged protein. All combinations are normalized to a negative control interaction test replacing the luc-tagged TF with the luc protein alone. Based on our experience studying dimeric bHLH proteins (M.H.B. and H.N.P., unpublished results), we set a higher cutoff [Luminescence Intensity Ratio (LIR) of 7] than used in previous studies (58,59); with this cutoff, we observed no examples of proteins interacting with dozens of additional negative control interactions (unpublished results). Several negative control tests with the TF clock (CLK) are included here (Figure 4B and Supplementary Table S8).
Figure 4.

Experimental validation of predicted TF–TF interactions. (A) Predicted site arrangement signatures. For each pair of motifs (first and third column), the second column shows the predicted distance bias. The ‘.rev’ extension next to the motif names indicates that the motif is in reverse complement orientation. (B) Measurement of direct in vitro interaction between TF pairs. TF pairs (listed on _Y_-axis) were expressed as fusions to MBP or luciferase (Luc). The recovery of Luc-tagged protein following an MBP pull-down is reported as the LIR with a threshold of LIR = 7 for positive interactions. Interactions are color coded to indicate those that were predicted to interact in the current study (iTFs), those acting in the anterior-posterior patterning network (AP), those have been previously reported in high-throughput PPI assays and positive or negative controls (CTRL+, CTRL−).
Of the 27 tested pairs, 10 were previously reported as interacting based on high-throughput PPI assays. The three homotypic LOLA isoforms are counted as one. Twelve more interacting pairs were novel predictions (Table 1) chosen based on a strong cutoff for statistical significance (P ≤ 2E-6) and required to be from clusters (Supplementary Table S4) of size 1 or 2. Five additional pairs were selected that are representatives of larger clusters and that are known to act in the well-characterized anterior-posterior embryonic patterning network. In all, 6 of the 10 tested pairs with previous PPI data tested positive in our assay (Figure 4B and Supplementary Table S8). The negatives may either be false positives in the high-throughput assay or may not be active for interaction when expressed in vitro and in the absence of potential DNA-binding sites. Of the 17 predicted interactions without previous supporting data, we obtained experimental support for 11. The positive interactions included both heterotypic and homotypic interactions. In addition, pairs that were part of large and small clusters were both in the positive set. As described earlier in the text, some negatives may be proteins that do not directly interact or do not fold properly in vitro. Alternatively, some pairs may interact too weakly to remain stably associated in this assay, but strongly enough to promote cooperative binding to properly spaced binding sites on DNA. The >50% success in experimental confirmation is striking, given that previous benchmarking of various PPI methods against literature interactions is between 20 and 40% (20). This observation may partly reflect a small sample size but may also indicate that adapting the quantitative readout of the LUMIER assay with consistently high protein expression levels obtained with in vitro expression provides a more robust and consistent method for detecting protein interactions. Furthermore, compared with other classes of proteins, such as membrane proteins or components of large complexes, TFs may be particularly well-suited for in vitro expression methods. The demonstration that >65% of the tested TF–TF interactions correspond to direct in vitro binding suggests that a substantial percentage of the constrained binding site arrangements identified in this study reflect interactions between TFs.
Table 1.
TF pairs with binding site biases selected for experimental validation
Two TFs that physically interact in vitro are expected to exhibit higher affinity cooperative binding to DNA if the binding sites are arranged such that the two TF molecules can simultaneously bind their target sites and each other (72,73). For four homotypic and one heterotypic interaction described earlier in the text, we tested this prediction by determining whether properly spaced pairs of binding sites exhibited higher binding affinity than individual sites or the same sites with altered spacing. For each pair tested, we identified two adjacent DNA-binding sites with preferred spacing from a putative transcriptional regulatory region (Supplementary Figure S3). The TFs and target regulatory sequences chosen were all part of the anterior–posterior patterning network. For each region, we confirmed that it was directly bound by the relevant TFs as predicted in existing ChIP data sets and by our computational predictions based on TF-binding motifs and accessibility (Supplementary Figure S4). Assays were performed using a variation of a previously described oligo-binding assay (60) by mixing luc-tagged TFs with biotin labeled DNA sites (‘probes’) and a variety of unlabeled competitor DNA sites (Figure 5A). Differences in affinity are reflected in the ability of different competitors to prevent TF binding to the probe and recovery of the associated luciferase activity with streptavidin beads (Figure 5B and Supplementary Table S9). For all binding reactions, the wild-type sequence containing both binding sites was the most effective competitor, reducing luciferase recovery to near background levels. As expected, point mutations that disrupt both predicted binding sites (ΔAB in Figure 5A and B) significantly reduced competition, confirming that these sites are the primary TF-binding sites. We treated this sample as representative of competition via non-specific DNA binding and report the amount of uncompleted TF bound to probe as a fraction of this value. For heterotypic pairs, point mutations that disrupt one of the binding sites (ΔA or ΔB), reduced competition compared with wild-type, indicating that the two sites mediate cooperative binding to the wild-type sequence. Two additional experiments support this conclusion. First, when the individual sites are provided on separate DNA molecules (ΔA + ΔB), they are unable to compete as well as both sites on the same molecule. Second, if both sites are on the same molecule, but the spacing between the sites is increased by five bases (+5), they also are unable to compete as well as the wild-type sequence. Thus, the sites must also be properly spaced for cooperative binding.
Figure 5.

Experimental validation of cooperative DNA binding for five selected TF pairs. (A) Schematic of assay to measure relative binding to pairs of DNA-binding sites. A biotinylated DNA probe with a wild-type (wt) DNA sequence containing a pair of binding sites for one (homotypic) or two (heterotypic) TFs is mixed with an excess of competitor DNA with either the wild-type or a variant DNA sequence. For homotypic interactions, a TF is labeled with luciferase (Luc). For heterotypic interactions, a second TF is labeled with MBP. The amount of Luc-tagged TF recovered with streptavidin beads reflects the relative affinity of the different competitor sequences for the tagged TF. Some of the DNA sequence variants tested include mutations that disrupt one (ΔA or ΔB) or both (ΔAB) of the TF-binding sites as well as insertions or deletions that change the spacing between the two sites. (B and C) DNA-binding site measurements for five homo or heterotypic TF–TF interactions. In each experiment, the biotinylated DNA probe is the wild-type (wt) sequence or not included (‘no probe’). The competitor DNA used is indicated on the _X_-axis. For ΔA + ΔB, the competitors with mutations in the individual TF-binding sites were used together, each at the concentration used for the individual competitor DNAs in the other samples. The recovered luciferase activity in the presence of the different competitors is shown on the _Y_-axis. The luciferase activity recovered using a competitor sequence with mutations in both TF-binding sites (ΔAB) was selected as representative of non-specific DNA competition; all other samples were reported as a fraction of the value of this sample. Changes in either the individual TF-binding sites or in the spacing between the binding sites result in reduced binding to the competitor DNA and an increased recovery of Luc-TF with the biotin-labeled DNA.
Similar results are observed with the heterotypic interaction between KR and OVO. In this experiment, one TF is luc-tagged, whereas the other is not. The binding site for the tagged TF is, as expected, required for binding. In addition, affinity for this TF is also reduced when the site for the other TF is either disrupted or is placed an additional five bases away, demonstrating the mutual influence of each TF on DNA binding to properly spaced sites. The KR and OVO pair was just below our cutoff in the in vitro pull down assay. It is likely that these TFs have a weaker physical interaction that is nonetheless sufficient to promote cooperative binding to properly spaced sites.
In the aforementioned experiment, we tested the effect of increasing the binding site spacing by five base pairs, which should place the binding site on the opposite side of the DNA molecule and minimize the possibility of maintaining protein-protein interactions. However, for some TF interactions, the distribution of spacing preferences recovered in the computational analysis suggests that the preferred spacing between binding sites may be highly constrained (e.g. KR and OVO in Supplementary Figure S3). Therefore, the DNA-binding experiment was repeated with five to seven different spacings between binding site pairs (Figure 5C and Supplementary Table S10). In all cases, the original sequence exhibited the highest affinity. In the case of (huckebein(HKB), HKB), there was a gradual decrease in affinity as the spacing was increased or decreased by one, three and five bases. In contrast, two other cases (TLL and luc-KR with OVO) exhibited a steep drop-off in affinity when even one additional base was added or subtracted. These results further support the model that our TF interaction predictions reflect, at least in part, physical interactions between TFs that promote cooperative binding to properly spaced binding site pairs. Both our computational and experimental results suggest that different TF pairs may exhibit greater or lesser restrictions on the spacings between their DNA-binding sites.
DISCUSSION
In this work, we examined sequence signatures such as preferred orientation and/or spacing between binding sites that reflect pairwise TF relationships. Site arrangement biases may be a signature of PPI and are likely to be important in understanding the mechanisms of transcriptional regulation and the _cis_-regulatory code.
In a recent study, Whitington et al. (19) developed a program called SpaMo to search a TF’s ChIP peaks for overrepresentation of a secondary motif and its arrangement relative to the primary motif. SpaMo tests the significance of a specific displacement between the primary motif in the ChIP-seq peaks and the nearest occurrence of the secondary motif, with a null hypothesis that assumes a uniform distribution on such displacements. This assumption is suspect in many real situations; for instance, if the secondary motif occurs more or less frequently in the genome, then shorter or longer displacements are more likely just by chance. The problem becomes more pronounced when one compares the significance of a displacement across many secondary motifs. Moreover, SpaMo ignores multiple occurrences of the primary motif in input BRs. Homotypic clustering of TF-binding sites (motifs) is well documented for several TFs in fruit fly and human (34,35). Ignoring this phenomenon might cause miscalculation of displacements, thus missing or falsely predicting a displacement bias. In addition, SpaMo does not distinguish different modes of orientation bias (e.g. M13′-to-M35′ from M15′-to-M23′) that may be important for heterotypic interactions. Our site arrangement bias discovery tool, iTFs, is designed to answer a statistical question similar to that tackled by SpaMo but also addresses the technical issues identified earlier in the text. First, iTFs does not assume a uniform distribution of site displacement. Instead, it creates a background (‘null’) distribution by shuffling the location of binding sites in each sequence, preserving the number of binding sites in that sequence. (This choice is supported by our observation that binding sites of any single TF do not exhibit any location bias within the 500 bp segments analyzed; see Supplementary Figure S5.) It then compares the distribution of inter-site spacing in the BRs to this empirical null distribution. Thus, site arrangement preferences are evaluated after conditioning on the number of sites in the input sequences, removing any potential bias owing to over/under representation of a particular motif. Second, iTFs, in contrast to SpaMo, considers all adjacent pairs of primary and secondary motif occurrences, thereby accounting explicitly for the phenomenon of homotypic site clustering. Finally, iTFs not only separately assesses all modes of orientation bias but also examines the orientation biases in conjunction with spacing biases.
In addition to the development of a novel statistical method, a major contribution of our work is the scale of our analysis. Although ChIP data sets may result in more accurate predictions of TF interaction, these data sets are currently limited to ∼50 (i.e. ∼7% of all) Drosophila TFs (74). By using BRs predicted by motif scanning and accessibility data sets, we were able to greatly expand the interaction map to include 322 TFs and all possible pairings thereof. This allows us a much wider perspective of the diverse nature and extent of TF–TF interactions in the Drosophila genome than had been reported earlier and also offers specific global insights. We find, for instance, that homotypic interactions are particularly common, that short (0–10 bp) range spacing biases are the most prevalent type of interaction signature (detectable by our approach) and that spacing biases are often tied to specific relative orientations, suggesting cooperative DNA binding. Notably, a recent large-scale analysis of human TFs by SELEX-seq identified a number of factors that bind as homodimers with particular site spacing preferences (75). Several of our predictions of interacting TFs were experimentally validated, demonstrating both direct physical interaction between TF molecules and increased affinity when the interacting molecules are bound to DNA with the preferred spacing between their sites. The approach of searching selected genomic sequence sets for specific patterns of TF motif arrangements provides an approach to identify interacting TFs that is completely orthogonal to previous genome-wide searches for PPIs in Drosophila and has the key advantage that it immediately associates a sequence signature with a putative TF–TF combination. An additional advantage of this approach is that it may detect some examples of cooperative binding that rely on PPIs that are too weak to detect in the absence of coordinated binding to DNA. In some cases, allosteric changes in DNA structure may promote cooperative DNA binding by TFs in parallel or even independent of TF–TF interactions (76–78). Although these interactions may not be detected with in vitro TF–TF interaction assays, they can still be discovered by this approach if they are associated with a biased arrangement of TF-binding sites.
There are a few limitations to our computational scheme for predicting TF ‘interactions’. Two such limitations, arising from TFs with similar binding specificities, were discussed and addressed in ‘Results’ section. The problem of multiple TFs with similar binding motifs will also apply to SpaMo but is more substantial in our study because of the larger set of high-quality TF motifs currently available in Drosophila. We also note that our test of TF pair interaction is based on the overlap between their predicted high-affinity BRs, rather than experimentally determined (ChIP-based) BRs. Therefore, our method may miss a cooperative relationship when one or both TF cooperatively bind to lower affinity sites. The high-affinity BRs have better functional predictive value—computational predictions of TF occupancy tend to be more accurate at extreme scores. However, the TF–TF interactions detected in high-affinity regions may also contribute to co-binding to lower affinity sites. In addition, as noted in ‘Results’ section, some of the detected homotypic site-spacing biases could be an artifact of site creation by tandem duplication. However, we sought to address this concern by masking out short tandem repeats, and our experimental validations also confirmed that the detected signatures reflect homodimeric interactions. Another limitation of our method arises out of the need to predict individual binding sites computationally, which introduces error in the collection of site pairs examined statistically. Finally, our test may be less sensitive to spacing biases in longer ranges (e.g. 50–100 bp) because we only consider adjacent site pairs: if two motifs occur frequently enough that the average spacing between their adjacent occurrences is less than, say, 50 bp, the strength of a spacing bias for the 50–100 bp range will be diluted. One way to address the last two limitations may be to include non-adjacent site pairs in the statistical test, but doing so naively may introduce a large number of spurious pairs and reduce statistical power. Proper consideration of non-adjacent site pairs in our framework is an important topic for future work.
The large, though still incomplete, collection of TF motifs in Drosophila allows us to provide evidence for pervasive interactions between TFs in the regions of the genome accessible during embryogenesis. We found spacing biases for the shortest range (0–10 bp) to be the common case and also noted that spacing biases were most conspicuous when examining site pairs in a specific relative orientation. Both of these findings reaffirm existing knowledge about TF interactions. Our sequence signature discovery schemes are based on statistical and computational methods of predicting TF-binding profiles, which heavily rely on TF binding specificity information. As large collections of TF-binding specificities in insects, vertebrates and plants continue to grow, this approach will become increasingly powerful across a wide range of species. We provide the site arrangement bias discovery tool (iTFs) as an online service at http://veda.cs.uiuc.edu/iTFs. Application of this method should reveal whether our evidence for widespread cooperative binding by TFs is generalizable to other developmental stages and other organisms.
SUPPLEMENTARY DATA
Supplementary Data are available at NAR Online.
FUNDING
Funding for open access charge: National Institutes of Health (NIH) [GM085233]; National Science Foundation [DBI-0746303 to S.S.]; National Human Genome Research Institute of the NIH [R01 HG004744-01 to M.H.B. and S.A.W.].
Conflict of interest statement. None declared.
Supplementary Material
Supplementary Data
ACKNOWLEDGEMENTS
The authors are grateful to Susan Celniker (LBNL) for clones. They especially thank the investigators and their colleagues who generated and generously deposited their genome-wide ChIP data sets, including Mark Biggin (LBNL), Mike Eisen (UCB), Eileen Furlong (EMBL Heidelberg), Chris Rushlow (New York University), Giacomo Cavalli (CNRS, France), Kevin White (U. Chicago) and the modENCODE consortium. They also thank the researchers who made the DnaseI data sets freely available for the community, including Mark Biggin (LBNL), Mike Eisen (UCB) and John Stamatoyannopoulos (UW).
REFERENCES
- 1.Levine M, Davidson EH. Gene regulatory networks for development. Proc. Natl Acad. Sci. USA. 2005;102:4936–4942. doi: 10.1073/pnas.0408031102. [DOI] [PMC free article] [PubMed] [Google Scholar]
- 2.Ip YT, Park RE, Kosman D, Yazdanbakhsh K, Levine M. Dorsal-twist interactions establish snail expression in the presumptive mesoderm of the Drosophila embryo. Genes Dev. 1992;6:1518–1530. doi: 10.1101/gad.6.8.1518. [DOI] [PubMed] [Google Scholar]
- 3.Harrison MM, Li XY, Kaplan T, Botchan MR, Eisen MB. Zelda binding in the early Drosophila melanogaster embryo marks regions subsequently activated at the maternal-to-zygotic transition. PLoS Genet. 2011;7:e1002266. doi: 10.1371/journal.pgen.1002266. [DOI] [PMC free article] [PubMed] [Google Scholar]
- 4.Magnani L, Eeckhoute J, Lupien M. Pioneer factors: directing transcriptional regulators within the chromatin environment. Trends Genet. 2011;27:465–474. doi: 10.1016/j.tig.2011.07.002. [DOI] [PubMed] [Google Scholar]
- 5.Fakhouri WD, Ay A, Sayal R, Dresch J, Dayringer E, Arnosti DN. Deciphering a transcriptional regulatory code: modeling short-range repression in the Drosophila embryo. Mol. Syst. Biol. 2010;6:341. doi: 10.1038/msb.2009.97. [DOI] [PMC free article] [PubMed] [Google Scholar]
- 6.Mirny LA. Nucleosome-mediated cooperativity between transcription factors. Proc. Natl Acad. Sci. USA. 2010;107:22534–22539. doi: 10.1073/pnas.0913805107. [DOI] [PMC free article] [PubMed] [Google Scholar]
- 7.Arnosti DN, Gray S, Barolo S, Zhou J, Levine M. The gap protein knirps mediates both quenching and direct repression in the Drosophila embryo. EMBO J. 1996;15:3659–3666. [PMC free article] [PubMed] [Google Scholar]
- 8.Barolo S, Levine M. hairy mediates dominant repression in the Drosophila embryo. EMBO J. 1997;16:2883–2891. doi: 10.1093/emboj/16.10.2883. [DOI] [PMC free article] [PubMed] [Google Scholar]
- 9.Johnson AD, Meyer BJ, Ptashne M. Interactions between DNA-bound repressors govern regulation by the lambda phage repressor. Proc. Natl Acad. Sci. USA. 1979;76:5061–5065. doi: 10.1073/pnas.76.10.5061. [DOI] [PMC free article] [PubMed] [Google Scholar]
- 10.Ptashne M. A Genetic Witch : Phage Lambd and Higher Organisms. 2nd edn. Cambridge, MA: Cell Press: Blackwell Scientific Publications; 1992. [Google Scholar]
- 11.Lelli KM, Slattery M, Mann RS. Disentangling the many layers of eukaryotic transcriptional regulation. Annu. Rev. Genet. 2012;46:43–68. doi: 10.1146/annurev-genet-110711-155437. [DOI] [PMC free article] [PubMed] [Google Scholar]
- 12.Kondoh H, Kamachi Y. SOX-partner code for cell specification: Regulatory target selection and underlying molecular mechanisms. Int. J Biochem Cell Biol. 2010;42:391–399. doi: 10.1016/j.biocel.2009.09.003. [DOI] [PubMed] [Google Scholar]
- 13.Hollenhorst PC, McIntosh LP, Graves BJ. Genomic and biochemical insights into the specificity of ETS transcription factors. Ann. Rev. Biochem. 2011;80:437–471. doi: 10.1146/annurev.biochem.79.081507.103945. [DOI] [PMC free article] [PubMed] [Google Scholar]
- 14.Giot L, Bader JS, Brouwer C, Chaudhuri A, Kuang B, Li Y, Hao YL, Ooi CE, Godwin B, Vitols E, et al. A protein interaction map of Drosophila melanogaster. Science. 2003;302:1727–1736. doi: 10.1126/science.1090289. [DOI] [PubMed] [Google Scholar]
- 15.Guruharsha KG, Rual JF, Zhai B, Mintseris J, Vaidya P, Vaidya N, Beekman C, Wong C, Rhee DY, Cenaj O, et al. A protein complex network of Drosophila melanogaster. Cell. 2011;147:690–703. doi: 10.1016/j.cell.2011.08.047. [DOI] [PMC free article] [PubMed] [Google Scholar]
- 16.Ito T, Chiba T, Ozawa R, Yoshida M, Hattori M, Sakaki Y. A comprehensive two-hybrid analysis to explore the yeast protein interactome. Proc. Natl Acad. Sci. USA. 2001;98:4569–4574. doi: 10.1073/pnas.061034498. [DOI] [PMC free article] [PubMed] [Google Scholar]
- 17.Yu H, Braun P, Yildirim MA, Lemmens I, Venkatesan K, Sahalie J, Hirozane-Kishikawa T, Gebreab F, Li N, Simonis N, et al. High-quality binary protein interaction map of the yeast interactome network. Science. 2008;322:104–110. doi: 10.1126/science.1158684. [DOI] [PMC free article] [PubMed] [Google Scholar]
- 18.Simonis N, Rual JF, Carvunis AR, Tasan M, Lemmens I, Hirozane-Kishikawa T, Hao T, Sahalie JM, Venkatesan K, Gebreab F, et al. Empirically controlled mapping of the Caenorhabditis elegans protein-protein interactome network. Nat. Methods. 2009;6:47–54. doi: 10.1038/nmeth.1279. [DOI] [PMC free article] [PubMed] [Google Scholar]
- 19.Whitington T, Frith MC, Johnson J, Bailey TL. Inferring transcription factor complexes from ChIP-seq data. Nucleic Acids Res. 2011;39:e98. doi: 10.1093/nar/gkr341. [DOI] [PMC free article] [PubMed] [Google Scholar]
- 20.Braun P, Tasan M, Dreze M, Barrios-Rodiles M, Lemmens I, Yu H, Sahalie JM, Murray RR, Roncari L, de Smet AS, et al. An experimentally derived confidence score for binary protein-protein interactions. Nat. Methods. 2009;6:91–97. doi: 10.1038/nmeth.1281. [DOI] [PMC free article] [PubMed] [Google Scholar]
- 21.Varjosalo M, Sacco R, Stukalov A, van Drogen A, Planyavsky M, Hauri S, Aebersold R, Bennett KL, Colinge J, Gstaiger M, et al. Interlaboratory reproducibility of large-scale human protein-complex analysis by standardized AP-MS. Nat. Methods. 2013;10:307–314. doi: 10.1038/nmeth.2400. [DOI] [PubMed] [Google Scholar]
- 22.Ravasi T, Suzuki H, Cannistraci CV, Katayama S, Bajic VB, Tan K, Akalin A, Schmeier S, Kanamori-Katayama M, Bertin N, et al. An atlas of combinatorial transcriptional regulation in mouse and man. Cell. 2010;140:744–752. doi: 10.1016/j.cell.2010.01.044. [DOI] [PMC free article] [PubMed] [Google Scholar]
- 23.Zhou Q, Chipperfield H, Melton DA, Wong WH. A gene regulatory network in mouse embryonic stem cells. Proc. Natl Acad. Sci. USA. 2007;104:16438–16443. doi: 10.1073/pnas.0701014104. [DOI] [PMC free article] [PubMed] [Google Scholar]
- 24.He X, Samee MA, Blatti C, Sinha S. Thermodynamics-based models of transcriptional regulation by enhancers: the roles of synergistic activation, cooperative binding and short-range repression. PLoS Comput. Biol. 2010;6:pii: e1000935. doi: 10.1371/journal.pcbi.1000935. [DOI] [PMC free article] [PubMed] [Google Scholar]
- 25.Frith MC, Fu Y, Yu L, Chen JF, Hansen U, Weng Z. Detection of functional DNA motifs via statistical over-representation. Nucleic Acids Res. 2004;32:1372–1381. doi: 10.1093/nar/gkh299. [DOI] [PMC free article] [PubMed] [Google Scholar]
- 26.Roider HG, Manke T, O'Keeffe S, Vingron M, Haas SA. PASTAA: identifying transcription factors associated with sets of co-regulated genes. Bioinformatics. 2009;25:435–442. doi: 10.1093/bioinformatics/btn627. [DOI] [PMC free article] [PubMed] [Google Scholar]
- 27.Nunez-Corcuera B, Birch JL, Yamada Y, Williams JG. Transcriptional repression by a bZIP protein regulates Dictyostelium prespore differentiation. PLoS One. 2012;7:e29895. doi: 10.1371/journal.pone.0029895. [DOI] [PMC free article] [PubMed] [Google Scholar]
- 28.Ng CK, Li NX, Chee S, Prabhakar S, Kolatkar PR, Jauch R. Deciphering the Sox-Oct partner code by quantitative cooperativity measurements. Nucleic Acids Res. 2012;40:4933–4941. doi: 10.1093/nar/gks153. [DOI] [PMC free article] [PubMed] [Google Scholar]
- 29.Kulakovskiy IV, Belostotsky AA, Kasianov AS, Esipova NG, Medvedeva YA, Eliseeva IA, Makeev VJ. A deeper look into transcription regulatory code by preferred pair distance templates for transcription factor binding sites. Bioinformatics. 2011;27:2621–2624. doi: 10.1093/bioinformatics/btr453. [DOI] [PubMed] [Google Scholar]
- 30.Hannenhalli S, Levy S. Predicting transcription factor synergism. Nucleic Acids Res. 2002;30:4278–4284. doi: 10.1093/nar/gkf535. [DOI] [PMC free article] [PubMed] [Google Scholar]
- 31.Papatsenko D, Goltsev Y, Levine M. Organization of developmental enhancers in the Drosophila embryo. Nucleic Acids Res. 2009;37:5665–5677. doi: 10.1093/nar/gkp619. [DOI] [PMC free article] [PubMed] [Google Scholar]
- 32.Makeev VJ, Lifanov AP, Nazina AG, Papatsenko DA. Distance preferences in the arrangement of binding motifs and hierarchical levels in organization of transcription regulatory information. Nucleic Acids Res. 2003;31:6016–6026. doi: 10.1093/nar/gkg799. [DOI] [PMC free article] [PubMed] [Google Scholar]
- 33.Yokoyama KD, Ohler U, Wray GA. Measuring spatial preferences at fine-scale resolution identifies known and novel cis-regulatory element candidates and functional motif-pair relationships. Nucleic Acids Res. 2009;37:e92. doi: 10.1093/nar/gkp423. [DOI] [PMC free article] [PubMed] [Google Scholar]
- 34.Lifanov AP, Makeev VJ, Nazina AG, Papatsenko DA. Homotypic regulatory clusters in Drosophila. Genome Res. 2003;13:579–588. doi: 10.1101/gr.668403. [DOI] [PMC free article] [PubMed] [Google Scholar]
- 35.Gotea V, Visel A, Westlund JM, Nobrega MA, Pennacchio LA, Ovcharenko I. Homotypic clusters of transcription factor binding sites are a key component of human promoters and enhancers. Genome Res. 2010;20:565–577. doi: 10.1101/gr.104471.109. [DOI] [PMC free article] [PubMed] [Google Scholar]
- 36.Noyes MB, Meng X, Wakabayashi A, Sinha S, Brodsky MH, Wolfe SA. A systematic characterization of factors that regulate Drosophila segmentation via a bacterial one-hybrid system. Nucleic Acids Res. 2008;36:2547–2560. doi: 10.1093/nar/gkn048. [DOI] [PMC free article] [PubMed] [Google Scholar]
- 37.Noyes MB, Christensen RG, Wakabayashi A, Stormo GD, Brodsky MH, Wolfe SA. Analysis of homeodomain specificities allows the family-wide prediction of preferred recognition sites. Cell. 2008;133:1277–1289. doi: 10.1016/j.cell.2008.05.023. [DOI] [PMC free article] [PubMed] [Google Scholar]
- 38.Enuameh MS, Asriyan Y, Richards A, Christensen RG, Hall VL, Kazemian M, Zhu C, Pham H, Cheng Q, Blatti C, et al. Global analysis of Drosophila Cys2-His2 zinc finger proteins reveals a multitude of novel recognition motifs and binding determinants. Genome Res. 2013;23:928–940. doi: 10.1101/gr.151472.112. [DOI] [PMC free article] [PubMed] [Google Scholar]
- 39.Zhu LJ, Christensen RG, Kazemian M, Hull CJ, Enuameh MS, Basciotta MD, Brasefield JA, Zhu C, Asriyan Y, Lapointe DS, et al. FlyFactorSurvey: a database of Drosophila transcription factor binding specificities determined using the bacterial one-hybrid system. Nucleic Acids Res. 2011;39:D111–D117. doi: 10.1093/nar/gkq858. [DOI] [PMC free article] [PubMed] [Google Scholar]
- 40.Kazemian M, Blatti C, Richards A, McCutchan M, Wakabayashi-Ito N, Hammonds AS, Celniker SE, Kumar S, Wolfe SA, Brodsky MH, et al. Quantitative analysis of the Drosophila segmentation regulatory network using pattern generating potentials. PLoS Biol. 2010;8 doi: 10.1371/journal.pbio.1000456. pii: e1000456. [DOI] [PMC free article] [PubMed] [Google Scholar]
- 41.Sinha S, van Nimwegen E, Siggia ED. A probabilistic method to detect regulatory modules. Bioinformatics. 2003;19(Suppl. 1):i292–i301. doi: 10.1093/bioinformatics/btg1040. [DOI] [PubMed] [Google Scholar]
- 42.Li XY, Thomas S, Sabo PJ, Eisen MB, Stamatoyannopoulos JA, Biggin MD. The role of chromatin accessibility in directing the widespread, overlapping patterns of Drosophila transcription factor binding. Genome Biol. 2011;12:R34. doi: 10.1186/gb-2011-12-4-r34. [DOI] [PMC free article] [PubMed] [Google Scholar]
- 43.Li XY, MacArthur S, Bourgon R, Nix D, Pollard DA, Iyer VN, Hechmer A, Simirenko L, Stapleton M, Luengo Hendriks CL, et al. Transcription factors bind thousands of active and inactive regions in the Drosophila blastoderm. PLoS Biol. 2008;6:e27. doi: 10.1371/journal.pbio.0060027. [DOI] [PMC free article] [PubMed] [Google Scholar]
- 44.Kaplan T, Li XY, Sabo PJ, Thomas S, Stamatoyannopoulos JA, Biggin MD, Eisen MB. Quantitative models of the mechanisms that control genome-wide patterns of transcription factor binding during early Drosophila development. PLoS Genet. 2011;7:e1001290. doi: 10.1371/journal.pgen.1001290. [DOI] [PMC free article] [PubMed] [Google Scholar]
- 45.MacArthur S, Li XY, Li J, Brown JB, Chu HC, Zeng L, Grondona BP, Hechmer A, Simirenko L, Keranen SV, et al. Developmental roles of 21 Drosophila transcription factors are determined by quantitative differences in binding to an overlapping set of thousands of genomic regions. Genome Biol. 2009;10:R80. doi: 10.1186/gb-2009-10-7-r80. [DOI] [PMC free article] [PubMed] [Google Scholar]
- 46.Zinzen RP, Girardot C, Gagneur J, Braun M, Furlong EE. Combinatorial binding predicts spatio-temporal cis-regulatory activity. Nature. 2009;462:65–70. doi: 10.1038/nature08531. [DOI] [PubMed] [Google Scholar]
- 47.Nien CY, Liang HL, Butcher S, Sun Y, Fu S, Gocha T, Kirov N, Manak JR, Rushlow C. Temporal coordination of gene networks by Zelda in the early Drosophila embryo. PLoS Genet. 2011;7:e1002339. doi: 10.1371/journal.pgen.1002339. [DOI] [PMC free article] [PubMed] [Google Scholar]
- 48.Celniker SE, Dillon LA, Gerstein MB, Gunsalus KC, Henikoff S, Karpen GH, Kellis M, Lai EC, Lieb JD, MacAlpine DM, et al. Unlocking the secrets of the genome. Nature. 2009;459:927–930. doi: 10.1038/459927a. [DOI] [PMC free article] [PubMed] [Google Scholar]
- 49.Schuettengruber B, Ganapathi M, Leblanc B, Portoso M, Jaschek R, Tolhuis B, van Lohuizen M, Tanay A, Cavalli G. Functional anatomy of polycomb and trithorax chromatin landscapes in Drosophila embryos. PLoS Biol. 2009;7:e13. doi: 10.1371/journal.pbio.1000013. [DOI] [PMC free article] [PubMed] [Google Scholar]
- 50.Benson G. Tandem repeats finder: a program to analyze DNA sequences. Nucleic Acids Res. 1999;27:573–580. doi: 10.1093/nar/27.2.573. [DOI] [PMC free article] [PubMed] [Google Scholar]
- 51.Jurka J. Repbase update: a database and an electronic journal of repetitive elements. Trends Genet. 2000;16:418–420. doi: 10.1016/s0168-9525(00)02093-x. [DOI] [PubMed] [Google Scholar]
- 52.Tomancak P, Berman BP, Beaton A, Weiszmann R, Kwan E, Hartenstein V, Celniker SE, Rubin GM. Global analysis of patterns of gene expression during Drosophila embryogenesis. Genome Biol. 2007;8:R145. doi: 10.1186/gb-2007-8-7-r145. [DOI] [PMC free article] [PubMed] [Google Scholar]
- 53.Tomancak P, Beaton A, Weiszmann R, Kwan E, Shu S, Lewis SE, Richards S, Ashburner M, Hartenstein V, Celniker SE, et al. Systematic determination of patterns of gene expression during Drosophila embryogenesis. Genome Biol. 2002;3:RESEARCH0088. doi: 10.1186/gb-2002-3-12-research0088. [DOI] [PMC free article] [PubMed] [Google Scholar]
- 54.Gupta S, Stamatoyannopoulos JA, Bailey TL, Noble WS. Quantifying similarity between motifs. Genome Biol. 2007;8:R24. doi: 10.1186/gb-2007-8-2-r24. [DOI] [PMC free article] [PubMed] [Google Scholar]
- 55.Warde-Farley D, Donaldson SL, Comes O, Zuberi K, Badrawi R, Chao P, Franz M, Grouios C, Kazi F, Lopes CT, et al. The GeneMANIA prediction server: biological network integration for gene prioritization and predicting gene function. Nucleic Acids Res. 2010;38:W214–W220. doi: 10.1093/nar/gkq537. [DOI] [PMC free article] [PubMed] [Google Scholar]
- 56.Stark C, Breitkreutz BJ, Chatr-Aryamontri A, Boucher L, Oughtred R, Livstone MS, Nixon J, Van Auken K, Wang X, Shi X, et al. The BioGRID Interaction Database: 2011 update. Nucleic Acids Res. 2011;39:D698–D704. doi: 10.1093/nar/gkq1116. [DOI] [PMC free article] [PubMed] [Google Scholar]
- 57.Grant CE, Bailey TL, Noble WS. FIMO: scanning for occurrences of a given motif. Bioinformatics. 2011;27:1017–1018. doi: 10.1093/bioinformatics/btr064. [DOI] [PMC free article] [PubMed] [Google Scholar]
- 58.Barrios-Rodiles M, Brown KR, Ozdamar B, Bose R, Liu Z, Donovan RS, Shinjo F, Liu Y, Dembowy J, Taylor IW, et al. High-throughput mapping of a dynamic signaling network in mammalian cells. Science. 2005;307:1621–1625. doi: 10.1126/science.1105776. [DOI] [PubMed] [Google Scholar]
- 59.Vizoso Pinto MG, Villegas JM, Peter J, Haase R, Haas J, Lotz AS, Muntau AC, Baiker A. LuMPIS—a modified luminescence-based mammalian interactome mapping pull-down assay for the investigation of protein-protein interactions encoded by GC-low ORFs. Proteomics. 2009;9:5303–5308. doi: 10.1002/pmic.200900298. [DOI] [PubMed] [Google Scholar]
- 60.Hallikas O, Taipale J. High-throughput assay for determining specificity and affinity of protein-DNA binding interactions. Nat. Protoc. 2006;1:215–222. doi: 10.1038/nprot.2006.33. [DOI] [PubMed] [Google Scholar]
- 61.Nourmohammad A, Lassig M. Formation of regulatory modules by local sequence duplication. PLoS Comput. Biol. 2011;7:e1002167. doi: 10.1371/journal.pcbi.1002167. [DOI] [PMC free article] [PubMed] [Google Scholar]
- 62.Spitz F, Furlong EE. Transcription factors: from enhancer binding to developmental control. Nat. Rev. Genet. 2012;13:613–626. doi: 10.1038/nrg3207. [DOI] [PubMed] [Google Scholar]
- 63.Moyle-Heyrman G, Tims HS, Widom J. Structural constraints in collaborative competition of transcription factors against the nucleosome. J. Mol. Biol. 2011;412:634–646. doi: 10.1016/j.jmb.2011.07.032. [DOI] [PMC free article] [PubMed] [Google Scholar]
- 64.Miller JA, Widom J. Collaborative competition mechanism for gene activation in vivo. Mol. Cell. Biol. 2003;23:1623–1632. doi: 10.1128/MCB.23.5.1623-1632.2003. [DOI] [PMC free article] [PubMed] [Google Scholar]
- 65.Granok H, Leibovitch BA, Shaffer CD, Elgin SC. Chromatin. Ga-ga over GAGA factor. Curr. Biol. 1995;5:238–241. doi: 10.1016/s0960-9822(95)00048-0. [DOI] [PubMed] [Google Scholar]
- 66.Lehmann M. Anything else but GAGA: a nonhistone protein complex reshapes chromatin structure. Trends Genet. 2004;20:15–22. doi: 10.1016/j.tig.2003.11.005. [DOI] [PubMed] [Google Scholar]
- 67.Leibovitch BA, Lu Q, Benjamin LR, Liu Y, Gilmour DS, Elgin SC. GAGA factor and the TFIID complex collaborate in generating an open chromatin structure at the Drosophila melanogaster hsp26 promoter. Mol. Cell. Biol. 2002;22:6148–6157. doi: 10.1128/MCB.22.17.6148-6157.2002. [DOI] [PMC free article] [PubMed] [Google Scholar]
- 68.Zaret KS, Carroll JS. Pioneer transcription factors: establishing competence for gene expression. Genes Dev. 2011;25:2227–2241. doi: 10.1101/gad.176826.111. [DOI] [PMC free article] [PubMed] [Google Scholar]
- 69.Okada M, Hirose S. Chromatin remodeling mediated by Drosophila GAGA factor and ISWI activates fushi tarazu gene transcription in vitro. Mol. Cell. Biol. 1998;18:2455–2461. doi: 10.1128/mcb.18.5.2455. [DOI] [PMC free article] [PubMed] [Google Scholar]
- 70.Yanez-Cuna JO, Dinh HQ, Kvon EZ, Shlyueva D, Stark A. Uncovering cis-regulatory sequence requirements for context-specific transcription factor binding. Genome Res. 2012;22:2018–2030. doi: 10.1101/gr.132811.111. [DOI] [PMC free article] [PubMed] [Google Scholar]
- 71.Slattery M, Riley T, Liu P, Abe N, Gomez-Alcala P, Dror I, Zhou T, Rohs R, Honig B, Bussemaker HJ, et al. Cofactor binding evokes latent differences in DNA binding specificity between Hox proteins. Cell. 2011;147:1270–1282. doi: 10.1016/j.cell.2011.10.053. [DOI] [PMC free article] [PubMed] [Google Scholar]
- 72.Pan Y, Nussinov R. Cooperativity dominates the genomic organization of p53-response elements: a mechanistic view. PLoS Comput. Biol. 2009;5:e1000448. doi: 10.1371/journal.pcbi.1000448. [DOI] [PMC free article] [PubMed] [Google Scholar]
- 73.Crocker J, Tamori Y, Erives A. Evolution acts on enhancer organization to fine-tune gradient threshold readouts. PLoS Biol. 2008;6:e263. doi: 10.1371/journal.pbio.0060263. [DOI] [PMC free article] [PubMed] [Google Scholar]
- 74.Negre N, Brown CD, Ma L, Bristow CA, Miller SW, Wagner U, Kheradpour P, Eaton ML, Loriaux P, Sealfon R, et al. A cis-regulatory map of the Drosophila genome. Nature. 2011;471:527–531. doi: 10.1038/nature09990. [DOI] [PMC free article] [PubMed] [Google Scholar]
- 75.Jolma A, Yan J, Whitington T, Toivonen J, Nitta KR, Rastas P, Morgunova E, Enge M, Taipale M, Wei G, et al. DNA-binding specificities of human transcription factors. Cell. 2013;152:327–339. doi: 10.1016/j.cell.2012.12.009. [DOI] [PubMed] [Google Scholar]
- 76.Kim S, Brostromer E, Xing D, Jin J, Chong S, Ge H, Wang S, Gu C, Yang L, Gao YQ, et al. Probing allostery through DNA. Science. 2013;339:816–819. doi: 10.1126/science.1229223. [DOI] [PMC free article] [PubMed] [Google Scholar]
- 77.Klemm JD, Pabo CO. Oct-1 POU domain-DNA interactions: cooperative binding of isolated subdomains and effects of covalent linkage. Genes Dev. 1996;10:27–36. doi: 10.1101/gad.10.1.27. [DOI] [PubMed] [Google Scholar]
- 78.Rohs R, Jin X, West SM, Joshi R, Honig B, Mann RS. Origins of specificity in protein-DNA recognition. Annu. Rev. Biochem. 2010;79:233–269. doi: 10.1146/annurev-biochem-060408-091030. [DOI] [PMC free article] [PubMed] [Google Scholar]
Associated Data
This section collects any data citations, data availability statements, or supplementary materials included in this article.
Supplementary Materials
Supplementary Data