Pseudo-temporal ordering of individual cells reveals dynamics and regulators of cell fate decisions (original) (raw)
. Author manuscript; available in PMC: 2014 Oct 1.
Published in final edited form as: Nat Biotechnol. 2014 Mar 23;32(4):381–386. doi: 10.1038/nbt.2859
Single-cell expression profiling by RNA-Seq promises to exploit cell-to-cell variation in gene expression to reveal regulatory circuitry governing cell differentiation and other biological processes. Here, we describe Monocle, a novel unsupervised algorithm for ordering cells by progress through differentiation that dramatically increases temporal resolution of expression measurements in a model of skeletal muscle differentiation. This reordering unmasks switch-like changes in expression of key regulatory factors, reveals sequentially organized waves of gene regulation, and exposes novel regulators of cell differentiation. A loss-of function screen revealed that many of these inhibitors act through regulatory elements also used by pro-myogenic factors to activate downstream genes. This study demonstrates that single-cell expression analysis by Monocle can uncover novel regulatory interactions governing differentiation.
Cell differentiation is governed by a vast and complex gene regulatory program. During differentiation, each cell makes fate decisions independently by integrating a wide array of signals from other cells, executing a complex choreography of gene regulatory changes. Recently, several studies carried out at single-cell resolution have revealed high cell-to-cell variation in most genes during differentiation1–5, even among key developmental regulators. Although high variability complicates analysis of such experiments6, it might define biological progression between cellular states, revealing regulatory modules of genes that co-vary in expression across individual cells7.
Prior studies have used approaches from computational geometry8,9 and supervised machine learning10 to order bulk cell populations from time-series microarray experiments by progress through a biological process. Applying this concept to order individual cells could expose fine-grained gene expression dynamics as they differentiate. We have developed Monocle, an algorithm that harnesses single cell variation to sort cells in “pseudo time” according to progress through differentiation. Applying Monocle to the classic model of myogenesis unveiled dynamics at unprecedented resolution and exposed novel regulatory factors.
Skeletal myoblasts undergo a well-characterized sequence of morphological and transcriptional changes during differentiation11. Global expression and epigenetic profiles have reinforced the view that a small cohort of transcription factors (e.g. MYOD, MYOG, MRF4, and MYF5) orchestrates these changes12. However, efforts to expand this set of factors and map the broader myogenic regulatory network have been hampered by the temporal resolution of global expression measurements, with thousands of genes following a limited number of coarse kinetic trends13.
Single-cell measurements of markers of myogenesis have made clear that cells do not progress through differentiation in synchrony. A population of cells captured at the same time may thus cover a range of distinct intermediate differentiation states. Drawing conclusions from a group of individuals based on the properties of their average is a hazardous practice because the average can mask important trends among the individuals, resulting in phenomena such as Simpson's paradox14. Experimental synchronization or stringent isolation of myogenic precursors is often challenging and dramatically alters differentiation kinetics.
We hypothesized that capturing complete expression profiles of individual cells might avoid these problems and dramatically increase temporal resolution in global transcriptome dynamics. In essence, a single-cell RNA-Seq experiment might constitute a time-series, with each cell representing a distinct time point along a continuum.
To test this hypothesis we investigated the single cell transcriptome dynamics during myogenesis. We expanded primary human myoblasts under high mitogen conditions (GM), and then induced differentiation by switching to low-mitogen media (DM). We then captured 50–100 cells at each of four time points following serum switch using the Fluidigm C1 microfluidic system. RNA from each cell was isolated and used to construct mRNA-Seq libraries, which were then sequenced to a depth of ~4 million reads per library, resulting in a complete gene expression profile for each cell (Fig 1a, S1).
Fig 1.
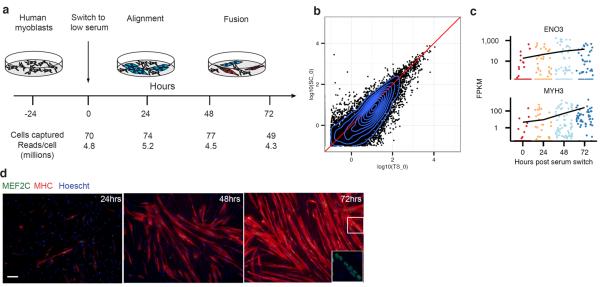
Single-cell RNA-Seq of differentiating myoblasts. A) Primary human myoblasts were cultured in high-serum media. Following a switch to low-serum media, cells were dissociated and individually captured at 24-hour intervals. An RNA-Seq library was prepared and sequenced for each cell. B) Gene expression levels averaged across individual cells harvested at time zero compared against bulk RNA-Seq (n=3, biological replicates). C) Expression levels of late-stage markers of myoblast differentiation (Enolase 3, ENO3; myosin heavy chain 3, MYH3) in individual cells. D) Representative immunofluorescence staining at the moment of cell sampling of the indicated markers (myocyte enhancer factor 2C, MEF2C in green; myosin heavy chain, MYH2/MHC in red; Hoechst staining in blue).
Averaging expression profiles of cells collected at the same time correlated well with the corresponding bulk RNA-Seq libraries, and moderately expressed genes were detectable (≥ 1 FPKM) in a majority of individual cells (Fig 1b, S2, S3). However, markers of mature myocytes were present at all time points following serum switch, and many other genes showed similar temporal heterogeneity (Fig 1c) We speculated that the high variability in cell-to-cell gene expression levels was due to unsynchronized differentiation, with myoblasts, intermediate myocytes, and mature myotubes residing in the same well concurrently. Indeed, large, multinucleated _MYH2_+ cells were abundant after 72 hours in DM, but these cells were present at lower frequency even at 24 hours (Fig 1c).
We reasoned that informatically ordering the cells by their progress through differentiation, rather than by the time they were collected, would distinguish genes activated early in differentiation from those activated later. To this end, we developed a novel unsupervised algorithm, Monocle, which re-ordered the cells to maximize the transcriptional similarity between successive pairs (Fig 2a). The algorithm first represents the expression profile of each cell as a point in a high-dimensional Euclidean space, with one dimension for each gene. Second, it reduces the dimensionality of this space using Independent Component Analysis15. Third, Monocle constructs a minimum spanning tree (MST) on the cells, an approach now commonly used in other single-cell settings, such as flow or mass cytometry16,17. Fourth, the algorithm finds the longest path through the MST, corresponding to the longest sequence of transcriptionally similar cells. Finally, Monocle uses this sequence to produce a “trajectory” of an individual cell's progress through differentiation.
Fig 2.

Monocle orders individual cells by progress through differentiation. A) An overview of the Monocle algorithm. B) Cell expression profiles (points) in a two-dimensional independent component space. Lines connecting points represent edges of the MST constructed by Monocle. Solid black line indicates the main diameter path of the MST and provides the backbone of Monocle's “pseudo-time” ordering of the cells. C) Expression levels for differentially expressed genes identified by Monocle (rows), with cells (columns) shown in pseudo-time order. Fibroblasts are excluded. D) Bar plot showing the proportion of MEF2C and MYH2 expressing cells measured by immunofluorescence at the time of collection (upper panel), RNA-Seq at the time of collection (middle panel) or RNA-Seq at pseudo-time (lower panel). MEF2C was considered detectably expressed at or above 100 FPKM, and MYH2 at 1 FPKM. MEF2C exhibits a bimodal pattern of expression across the cells (not shown), and a threshold of 100 FPKM separates the modes. E) Expression levels of key regulators of muscle differentiation, ordered by time collected. (Cyclin-dependent kinase 1, CDK1; Inhibitor of DNA binding 1, ID1; Myogenin, MYOG) F) Regulators from panel D, ordered by Monocle in pseudo-time.
Progress along a differentiation trajectory is measured in “pseudo-time”: the total transcriptional change a cell undergoes as it differentiates. This strategy is derived from a prior algorithm for temporally ordering microarray samples8, but extends it to allow for multiple cell fates stemming from a single progenitor cell type. As cells progress, they may diverge along two or more separate paths. After Monocle finds the longest sequence of similar cells, it examines cells not along this path to find alternative trajectories through the MST. These sub-trajectories are ordered and connected to the main trajectory, and each cell is annotated with both a trajectory and a pseudo-time value. Monocle thus orders cells by progress through differentiation and can reconstruct branched biological processes, which might arise when a precursor cell makes cell fate decisions that govern the generation of multiple subsequent lineages. Importantly, Monocle is unsupervised and needs no prior knowledge of specific genes that distinguish cell fates, and is thus suitable for studying a wide array of dynamic biological processes.
Monocle decomposed myoblast differentiation into a two-phase trajectory and isolated a branch of non-differentiating cells (Fig 2b). The first phase of the trajectory was primarily composed of cells collected under high-mitogen conditions and which expressed markers of actively proliferating cells such as CDK1, while the second mainly consisted of cells collected at 24, 48, or 72 hours following serum switch. Cells in the second phase were positive for markers of muscle differentiation such as MYOG (Fig S4). A tightly grouped third population of cells branched from the trajectory near the transition between phases. These cells lacked myogenic markers but expressed PDGFRA and SPHK1, suggesting that they are contaminating interstitial mesenchymal cells and did not arise from the myoblasts. Such cells were recently shown to stimulate muscle differentiation18. Monocle's estimates of the frequency and proliferative status of these cells were consistent with estimates derived from immunofluorescent stains against ANPEP/CD13 and nuclear phosphorylated H3-Ser10 (Fig S4). Monocle thus enabled analysis of the myoblast differentiation trajectory without subtracting these cells by immunopurification, maintaining in vitro differentiation kinetics that resemble physiological cell crosstalk occurring in the in vivo niche.
To find genes that were dynamically regulated as the cells progressed through differentiation, we modeled each gene's expression as a nonlinear function of pseudo-time. A total of 1,061 genes were dynamically regulated during differentiation (FDR < 5%) (Fig 2c). Cells positive for MEF2C and MYH2, early and late markers of differentiation (respectively) were present at expected frequencies as assayed by both immunofluorescence and RNA-Seq. Moreover, the pseudo-time ordering of cells shows an increase in _MEF2C_+ cell counts prior to the increase in _MYH2_+ cells. Importantly, genes that play active roles at the early and late stages of muscle differentiation showed pseudo-temporal kinetics that were highly consistent with expectations, with cell-cycle regulators active early in pseudo-time, and sarcomere components active later, confirming the accuracy of the ordering (Fig S5).
We next examined the pseudo-temporal kinetics of a set of genes whose mouse orthologs are targeted by Myod, Myog, or Mef2 proteins in C2C12 myoblasts19 (Fig S6). The kinetics of these genes during differentiation were highly consistent with changes observed during murine myogenesis, with nearly all significantly dynamically regulated genes also differentially expressed during murine myogenesis and vice versa. In contrast to the high resolution of pseudotime ordering, simply comparing gene expression levels between groups of cells collected on different days masked changes in key transcriptional regulators of myogenesis. For example, the pseudo-time reordering of the cells shows switch-like inactivation of ID1, which is a critical event in muscle differentiation and leads to the activation of MYOG12 (Fig 2e,f). Thus, Monocle's ordering of cells by progress increases temporal resolution of transcriptional dynamics and pinpoints key regulatory events that govern differentiation.
We further assessed Monocle's robustness over different experimental designs by simulating experiments with fewer captured cells. Monocle placed subsets as small as 50 cells in pseudo-temporal order highly similar (spearman >= 0.8) to their relative order within the full data set. The algorithm retained the ability to detect dynamically regulated genes with high precision (>= 95%) over all designs and with increasing recall as more of the cells were included. (Fig S7)
We next grouped genes with similar trends in expression, reasoning that such groups might share common biological functions and regulators. Clustering of genes according to direction and timing revealed six distinct trends (Fig 3). Genes downregulated early or upregulated late in pseudo-time were highly enriched for biological processes central to myogenesis, including cell-cycle exit and activation of muscle-specific structural proteins. However, the other clusters included many genes with broad roles in development, including mediators of cell-cell signaling, RNA export and translational control, and remodeling of cell morphology (Fig S8).
Fig 3.

Pseudo-time ordering of cells reveals genes activated or repressed early in differentiation, along with potential upstream regulators. (left) Relative gene expression levels were K-means clustered. The mean expression for each cluster is shown in red, and an example gene with a known role in myogenesis from each cluster is highlighted in blue. (middle) Selected Gene Ontology terms that are associated with genes in each cluster. (right) Number of transcription factors with conserved binding site motifs in regulatory elements for genes in each cluster. Transcription factors are segregated according to the function of regulatory elements to which they bind. Examples are shown on the right, with known myogenic factors in black and factors without a known role in muscle differentiation in red.
A timeseries analysis of myoblast differentiation with bulk RNA-Seq identified up and down-regulated genes, but did not identify the transient clusters or distinguish the early from late regulation visible with pseudo-temporally ordered single cells (Fig S9). Furthermore, dynamic range of expression was compressed for most genes, confirming that failure to account for variability in progress through differentiation leads directly to the effects associated with Simpson's paradox. Pseudo-temporal cell ordering thus decomposes the coarse kinetic trends produced by conventional RNA-Seq into distinct, sequential waves of transcriptional reconfiguration.
To identify factors driving myoblast differentiation, we performed a cis-regulatory analysis on genes in each pseudo-temporal cluster. Cis regulatory elements were first identified based on DNaseI hypersensitive sites in HSMM cells and HSMM-derived myotubes20, classified according to function according to histone marks21, and finally annotated with conserved transcription factor binding sites. While downregulated genes were enriched at near significant levels with binding sites for genes that play roles in proliferation (e.g. MAX, E2F, and NMYC), nearly all significantly enriched motifs fell near upregulated genes. These genes were highly enriched for regulatory elements containing binding motifs for 175 transcription factors, including numerous well-known regulators of myogenesis, such as MYOD, MYOG, PBX1, MEIS1, and the MEF2 family (Fig S10). Some, but not all, of these factors were revealed by a regulatory element analysis performed using bulk RNA-Seq data, underscoring the power of increased (pseudo) temporal resolution of single-cell analysis (Fig S11). A similar analysis of microRNA target sites identified miR-1, miR-206, miR-133, and numerous others as regulators of genes activated during myogenesis (Fig S12). Of these, only miR-1/206 target sites were significantly enriched among genes found to be transiently upregulated and then sharply downregulated. This may suggest that miR-1 and miR-206, which are expressed at an intermediate stage of myoblast differentiation, may act to strongly suppress a subset of genes activated earlier.
Many of the transcription factors implicated by our cis regulatory analysis to govern differentiation had no previously appreciated role in muscle development. To test potential roles of these factors we performed an RNAi mediated loss of function screen for 11 candidates. Briefly, we virally expressed proliferating myoblasts with one of 44 distinct shRNAs targeting either one of these factors or a mock (non-targeting) control, followed by serum-induced differentiation for five days. We then measured the frequency and size of myosin heavy chain 2 (MYH2)-positive cells with a high-throughput immunofluorescence pipeline. Of the targets we tested, MZF1, ZIC1, XBP1, and USF1 showed significantly altered differentiation kinetics (Fig 4a,b, Fig S13) when depleted with two or more independent hairpins (FDR < 5%).
Fig 4.

Loss-of-function screen on selected transcription factors. A) Fraction of nuclei within cells expressing MYH2 (upper panel), whole-well area of MYH2 (middle panel) and nuclei count (lower panel) after 4 days of culture in differentiation medium following shRNA viral infection for the indicated genes, normalized to mock shRNA controls. For each mRNA, four independent shRNA were tested and the results of the two with greatest impact on fraction of nuclei in MYH2+ cells are reported. Values reported are the average of 4 technical replicates of each infection, with significance of changes w.r.t control assessed by two-tailed Student's _t_-tests and corrected by Benjamini Hochberg. Error bars indicate 2 standard deviations from the mean. An asterisk represents a significant difference with respect to mock control at an FDR < 5%. B) Co-occupancy scores of conserved transcription factor binding site motifs in enhancers (green) and promoters (purple) identified by ENCODE. Scores were calculated as the log10-transformed p-values from hypergeometric tests following Bonferroni correction for multiple testing (See Methods). C) Inhibitors might prevent premature myoblast differentiation by one of two mechanisms.
Knockdown of XBP1, USF1, ZIC1, and MZF1 enhanced myotube formation, with larger myotubes containing a higher fraction of total nuclei than mock shRNA controls. Depletion of CUX1, ARID5B, POU2F1, and AHR also increased differentiation efficiency, albeit less significantly. Importantly, whole-well nuclei counts were similar between knockdowns and mock controls, indicating that enhanced differentiation was not simply a result of higher initial cell counts or increased proliferation. With the exception of ZIC1, forced overexpression did not substantially alter differentiation kinetics (data not shown).
Notably, several of these factors have binding motifs that are highly enriched in promoters and enhancers that also have motifs for known muscle regulators (Fig 4c). For example, USF1 motifs are enriched in enhancers that also have MYOD motifs. Together, these results confirm that the transcription factors identified as possible regulators in fact play a role in myoblast differentiation, and demonstrate the power of Monocle for identifying key differentiation genes.
Here, we report that individual myoblasts progress through differentiation in an unsynchronized manner, but that they can be reordered according to progress through differentiation. This pseudo-time ordering pinpoints key events in differentiation that are masked both by conventional bulk cell expression profiling, and by single-cell expression profiles ordered by time collected. The reordering resolves sequentially activated transcriptional sub-programs that are regulated by common factors. The temporal resolution offered by hundreds of ordered cells might enable future efforts to computationally infer novel gene-regulatory modules. For example, the enrichment of transiently upregulated genes for common microRNA target sites raises the question of whether those microRNAs are expressed later, curtailing what would have been higher levels of expression. Sequencing-based measurements of small RNAs and mRNAs from the same cell will provide answers to such systems-level questions. Moreover, single-cell analysis distinguishes cells of interest from contaminating cell types such as interstitial mesenchymal cells without experimental isolation that might disrupt cell-cell interactions important in the in vivo niche.
We identified eight previously unappreciated transcription factors that dramatically influence the course of myoblast differentiation, thus proving the principle of pseudo-temporal analysis and expanding the catalog of regulators in this well-studied system. Several of the eight factors reported here may normally repress differentiation by competing with pro-myogenic factors for these regulatory elements. Alternatively, these inhibitors may co-occupy regulatory elements with pro-myogenic factors, preventing transactivation of their targets (Fig. 4d). Previous studies in other contexts provide mechanistic data supporting both of these models. USF1 inhibits MyoD autoactivation in Xenopus by competing with MyoD at its promoter through an alternative E-box22. Our results suggest that USF1 may repress a broad array of targets via E-box competition. CUX1 represses targets in several developmental contexts through binding site competition23. XBP1 was recently reported to inhibit myoblast differentiation in mice, potentially through the mechanisms proposed here24. Further experiments in these HSMM cells and myoblasts from other anatomic depots will be needed to confirm the mechanism of these factors.
While the positive regulators of myogenesis have been well characterized, only a handful of inhibitors have been identified. The eight inhibitors reported here may shed light on how the balance of proliferation and differentiation is maintained during development and regeneration. Ordering the expression profiles of individual cells by biological progress is thus a powerful new tool for studying cell differentiation, and could in principle be used to map regulatory networks that govern a much wider array of biological processes.
Supplementary Material
1
Acknowledgments
We are grateful to Sharif Bordbar, Chris Zhu, Amy Wagers and the Broad RNAi platform for technical assistance, and Magali Soumillon for helpful discussions. CT is a Damon Runyon Postdoctoral Fellow. DC is a Human Frontiers Foundation Fellow. DC and TM were supported by the Harvard Stem Cell Institute. JLR is the Alvin and Esta Star Associate Professor. This work was supported by 1DP2OD00667, P01GM099117, 1DP20D008514, and P50HG006193-01. This work was also supported in part by the Single Cell Genomics initiative, a collaboration between the Broad Institute and Fluidigm Inc.
Footnotes
Author contributions CT and DC conceived the strategy of ordering individual cells by developmental progress. CT designed and wrote Monocle and performed the computational analysis. DC, CT, JG, PP, SL, and MM performed the experiments. DC, CT and JR designed the study. CT, DC, JG, NL, KL, TM, and JR wrote the manuscript.
References
- 1.Shalek AK, et al. Single-cell transcriptomics reveals bimodality inexpression and splicing in immune cells. Nature. 2013:1–5. doi: 10.1038/nature12172. doi:10.1038/nature12172. [DOI] [PMC free article] [PubMed] [Google Scholar]
- 2.Guo G, et al. Resolution of Cell Fate DecisionsRevealed by Single-Cell Gene Expression Analysis from Zygote to Blastocyst. Developmental Cell. 2010;18:675–685. doi: 10.1016/j.devcel.2010.02.012. [DOI] [PubMed] [Google Scholar]
- 3.Hashimshony T, Wagner F, Sher N, Yanai I. CEL-Seq: Single-Cell RNA-Seq by Multiplexed Linear Amplification. CellReports. 2012;2:666–673. doi: 10.1016/j.celrep.2012.08.003. [DOI] [PubMed] [Google Scholar]
- 4.Buganim Y, et al. Single-Cell Expression Analyses during Cellular Reprogramming Reveal an Early Stochastic and a Late Hierarchic Phase. Cell. 2012;150:1209–1222. doi: 10.1016/j.cell.2012.08.023. [DOI] [PMC free article] [PubMed] [Google Scholar]
- 5.Tang F, et al. Tracing the Derivation of Embryonic Stem Cells from the Inner Cell Mass by Single-Cell RNA-Seq Analysis. Stem Cell. 2010;6:468–478. doi: 10.1016/j.stem.2010.03.015. [DOI] [PMC free article] [PubMed] [Google Scholar]
- 6.ld DRO, et al. Full-length mrNA-seq from single-cell levels of rNA and individual circulating tumor cells. Nat Biotechnol. 2012;30:777–782. doi: 10.1038/nbt.2282. [DOI] [PMC free article] [PubMed] [Google Scholar]
- 7.Shapiro E, Biezuner T, Linnarsson S. Single-cell sequencing-based technologies will revolutionize whole-organism science. Nature Publishing Group. 2013;14:618–630. doi: 10.1038/nrg3542. [DOI] [PubMed] [Google Scholar]
- 8.Magwene PM, Lizardi P, Kim J. Reconstructing the temporal ordering of biological samples using microarray data. Bioinformatics. 2003;19:842–850. doi: 10.1093/bioinformatics/btg081. [DOI] [PubMed] [Google Scholar]
- 9.Gupta A, Bar-Joseph Z. Extracting Dynamics from Static Cancer Expression Data. IEEE/ACM Trans. Comput. Biol. and Bioinf. 5:172–182. doi: 10.1109/TCBB.2007.70233. [DOI] [PubMed] [Google Scholar]
- 10.Qiu P, Gentles AJ, Plevritis SK. Discovering biological progression underlying microarray samples. PLoS Comp Biol. 2011;7:e1001123. doi: 10.1371/journal.pcbi.1001123. [DOI] [PMC free article] [PubMed] [Google Scholar]
- 11.Abmayr SM, Pavlath GK. Myoblast fusion: lessons from flies and mice. Development. 2012;139:641–656. doi: 10.1242/dev.068353. [DOI] [PMC free article] [PubMed] [Google Scholar]
- 12.Tapscott SJ. The circuitry of a master switch: Myod and the regulation of skeletal muscle gene transcription. Development. 2005;132:2685–2695. doi: 10.1242/dev.01874. [DOI] [PubMed] [Google Scholar]
- 13.Tomczak KK. Expression profiling and identification of novel genes involved in myogenic differentiation. The FASEB Journal. 2003 doi: 10.1096/fj.03-0568fje. doi:10.1096/fj.03-0568fje. [DOI] [PubMed] [Google Scholar]
- 14.Simpson EH. The interpretation of interaction in contingency tables. J. Roy. Statist. Soc. Ser. B. 1951;13:238–241. [Google Scholar]
- 15.Hyvärinen A, Oja E. Independent component analysis: algorithms and applications. Neural networks. 2000 doi: 10.1016/s0893-6080(00)00026-5. [DOI] [PubMed] [Google Scholar]
- 16.Bendall SC, et al. Single-Cell Mass Cytometry of Differential Immune and Drug Responses Across a Human Hematopoietic Continuum. Science. 2011;332:687–696. doi: 10.1126/science.1198704. [DOI] [PMC free article] [PubMed] [Google Scholar]
- 17.Simonds EF, et al. nbt.1991. Nat Biotechnol. 2011;29:886–891. doi: 10.1038/nbt.1991. [DOI] [PMC free article] [PubMed] [Google Scholar]
- 18.Joe AWB, et al. Muscle injury activates resident fibro/adipogenic progenitors that facilitate myogenesis. Nat. Cell Biol. 2010;12:153–163. doi: 10.1038/ncb2015. [DOI] [PMC free article] [PubMed] [Google Scholar]
- 19.Blais A. An initial blueprint for myogenic differentiation. Genes Dev. 2005;19:553–569. doi: 10.1101/gad.1281105. [DOI] [PMC free article] [PubMed] [Google Scholar]
- 20.Neph S, et al. An expansive human regulatory lexicon encoded in transcription factor footprints. Nature. 2013;488:83–90. doi: 10.1038/nature11212. [DOI] [PMC free article] [PubMed] [Google Scholar]
- 21.Ernst J, Kellis M. ChromHMM: automating chromatin state discovery and characterization. Nat Methods. 2012;9:215–216. doi: 10.1038/nmeth.1906. [DOI] [PMC free article] [PubMed] [Google Scholar]
- 22.Lun Y, Sawadogo M, Perry M. Autoactivation of Xenopus MyoD transcription and its inhibition by USF. Cell Growth Differ. 1997;8:275–282. [PubMed] [Google Scholar]
- 23.Sansregret L, Nepveu A. The multiple roles of CUX1: Insights from mouse models and cell-based assays. Gene. 2008;412:84–94. doi: 10.1016/j.gene.2008.01.017. [DOI] [PubMed] [Google Scholar]
- 24.Acosta-Alvear D, et al. XBP1 Controls Diverse Cell Type- and Condition-Specific Transcriptional Regulatory Networks. Mol Cell. 2007;27:53–66. doi: 10.1016/j.molcel.2007.06.011. [DOI] [PubMed] [Google Scholar]
Associated Data
This section collects any data citations, data availability statements, or supplementary materials included in this article.
Supplementary Materials
1