Distinct contributions of Aire and antigen presenting cell subsets to the generation of self-tolerance in the thymus (original) (raw)
. Author manuscript; available in PMC: 2015 Sep 18.
Summary
The contribution of thymic antigen presenting cell (APC) subsets in selecting a selftolerant T cell population remains unclear. We show that bone marrow (BM) APCs and medullary thymic epithelial cells (mTECs) played non-overlapping roles in shaping the T cell receptor (TCR) repertoire by deletion and regulatory T (Treg) cell selection of distinct TCRs. Aire, which induces tissue-specific-antigen expression in mTECs, affected the TCR repertoire in a manner distinct from mTEC presentation. Approximately half of Aire-dependent deletion or Treg cell selection utilized a pathway dependent on antigen presentation by BM APCs. _Batf3_-dependent CD8α+ dendritic cells (DCs) were the crucial BM APC for Treg cell selection via this pathway, showing enhanced ability to present antigens from stromal cells. These results demonstrate the division of function between thymic APCs in shaping the self-tolerant TCR repertoire, and reveal an unappreciated cooperation between mTECs and CD8α+ DCs for presentation of Aire-induced self-antigens to developing thymocytes.
Introduction
The enormous diversity of adaptive immune receptors allows for the recognition of a wide variety of pathogens, but comes at the potential cost of self-recognition and autoimmunity. For CD4+ T cells, self-tolerance starts during T cell maturation in the thymus where they are instructed by antigen presenting cells (APCs) found primarily in the thymic medulla (Derbinski and Kyewski, 2010; Klein et al., 2014; Stritesky et al., 2012; Weissler, 2014). CD4+ T cells bearing T cell receptors (TCRs) that recognize self-antigens at this stage can be eliminated by negative selection, which prevents the release of autoreactive conventional T (Tconv) cells into the periphery (Palmer, 2003; Stritesky et al., 2012). Alternatively, self-reactive T cells can undergo differentiation into Foxp3+ regulatory T (Treg) cells, which are required for the prevention of spontaneous autoimmunity (Hsieh et al., 2012; Josefowicz et al., 2012; Wing and Sakaguchi, 2010). Because both of these thymic tolerance mechanisms are driven via TCR signaling, the display of self-antigen on medullary APCs is crucial for the education of a self-tolerant T cell population (Klein et al., 2014).
The process of generating and presenting a diverse array of self-antigens is remarkable for its complexity. In contrast to the involvement of a single APC type for positive selection in the thymic cortex, multiple APC types contribute to T cell tolerance in the medulla (Anderson and Su, 2011; Derbinski and Kyewski, 2010; Klein et al., 2014). Broadly, medullary APCs are classified as being of epithelial origin (medullary thymic epithelial cells, mTECs), or of bone marrow (BM) origin. Their role in tolerance is supported by two key observations. First, genetic deletion or knockdown of major histocompatibility complex class II (MHC II) expression in either BM cells or mTECs increases the total number of CD4+CD8– (CD4SP) thymocytes, suggesting that both APC types are involved in deletion (Bonasio et al., 2006; Hinterberger et al., 2010; Ohnmacht et al., 2009). However, changes in cell numbers may also reflect differences in cell survival, cytokine niches, and/or the rate of thymic egress (Hinterberger et al., 2011; Lio et al., 2010). Second, TCR transgenic studies reveal that both mTECs and BM APCs are capable of inducing Treg cells and negative selection upon presentation of cognate antigens expressed via a second transgene (Atibalentja et al., 2011; Cowan et al., 2013; Hinterberger et al., 2010; Proietto et al., 2008b; Román et al., 2010). However, restricting TCR-peptide:MHC interactions to single specificities may not be representative of the naturally occurring T cell population or developmental niche. While these results highlight potential roles for these APC types, they do not quantify the impact of BM APCs and mTECs on the processes of clonal deletion and Treg cell selection (Klein et al., 2014).
Medullary tolerance is further complicated by the requirement of mTEC production of tissue-specific self-antigens (TSAs) to maintain self-tolerance. Aire (Autoimmune Regulator) has been shown to induce the ectopic expression of TSAs in mTECs (Mathis and Benoist, 2009; Metzger and Anderson, 2011). Despite the importance of Aire in facilitating negative selection (Liston et al., 2003), its role in Treg cell development is controversial. One TCR repertoire analysis suggests that Aire has little effect on Treg cell selection (Daniely et al., 2010), which is consistent with the observation that _Aire_-deficient mice have normal Treg cell numbers (Anderson et al., 2005). However, these findings are contrary to a recent study showing that Aire is required for thymic Treg cell selection of two TCR transgenic lines specific to endogenous prostate-specific antigen (Malchow et al., 2013), as well as studies of TCR:cognate antigen transgenic models. As the differences in methodologies and conclusions cannot be easily resolved, the role of Aire in thymic Treg cell selection remains unclear.
Interestingly, T cell tolerance may also require the interaction of mTECs and BM APCs for presentation of TSAs. Although Aire-dependent antigens can be autologously presented on mTECs via autophagy (Aschenbrenner et al., 2007; Hinterberger et al., 2010; Liston et al., 2003), mTECs can also transfer antigens to BM APC for presentation (Aschenbrenner et al., 2007; Gallegos and Bevan, 2004; Hubert et al., 2011; Taniguchi et al., 2012). Antigen transfer may therefore blur the distinction between antigens that are displayed on BM APCs and mTECs. Because this has only been addressed using TCR transgenic or MHC tetramer studies (Gallegos and Bevan, 2004; Hubert et al., 2011; Koble and Kyewski, 2009; Taniguchi et al., 2012), the importance of the antigen transfer pathway versus autologous mTEC antigen presentation in mediating Aire-dependent tolerance remains unknown.
To systematically characterize the role of Aire and antigen presentation by BM APCs and mTECs at a TCR clonal level, we used a fixed TCRp model to analyze the thymic TCR repertoires that arise upon blockade of antigen presentation on BM APCs or mTECs, and compared them to TCR repertoires that arise in the context of Airedeficiency. Our results demonstrate that BM APCs and mTECs play non-redundant roles in deletion and Treg cell selection, and unexpectedly reveal that a major pathway of Aire-dependent tolerance is mediated by antigen transfer from mTECs to BATF3-dependent CD8α+ DCs.
Results
Both BM APCs and mTECs mediate negative selection
Because the great diversity in polyclonal T cells precludes experimental analysis at the individual TCR level, we and others have utilized mice in which TCR diversity is limited by a transgenic fixed TCRβ chain (Hsieh et al., 2004; Pacholczyk et al., 2007; Wong et al., 2007). This allows high throughput analysis of the TCR repertoire at the individual TCR level via sequencing of the variable TCRa chains. To assess the role of MHC II presentation by BM APCs, TClip TCR transgenic Foxp3gfp Tcra+/∼ MHC II deficient mice were used as BM donors into irradiated wild-type (WT) mice. To assess the role of mTECs, TClip Foxp3 gfp Tcra+/∼ BM was transplanted into irradiated C2TAkd mice, in which MHC II expression is markedly reduced in mTECs owing to expression of an shRNA to CIITA driven by the Aire promoter (Hinterberger et al., 2010).
Within the CD4SP subset, we sorted Foxp3+ Treg cells and Foxp3″CD24lo CD62Lhi mature conventional T cells (Tconv) and sequenced their TRAV14 (Va2) chains (Figure S1 A). To allow for statistical comparisons of TCR frequencies between conditions, the pyrosequencing data were filtered to include those reads present in more than one third of mice in at least one condition, and those present >0.1% in at least one mouse (Figure S1B). We then plotted the average percentage of each TCR in the MHC manipulated versus WT conditions. In the Tconv repertoire, many TCRs were significantly enriched in MHC II-deficient BM APCs compared with MHC II-sufficient BM APCs (Figure 1A, data points found below reference line of MHC II deficient BM plot). By contrast, fewer TCRs were enriched when MHC II was reduced on mTECs (Figure 1A, C2TAkd).
Figure 1. BM APCs and mTECs mediate negative selection of conventional T cells.
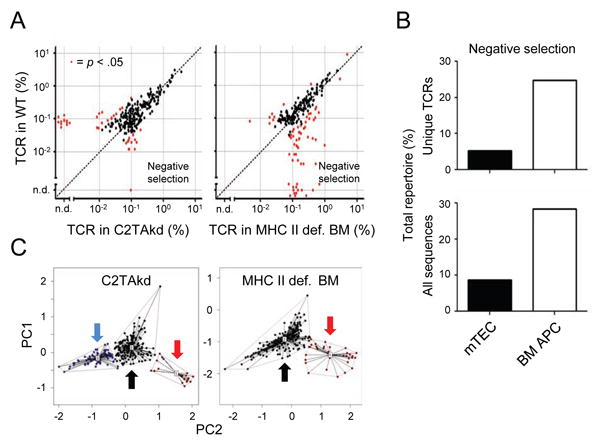
(A) Changes in Tconv TCR frequency with manipulation of MHC II expression on BM APCs or mTECs. Data shown are the frequency of Foxp3– CD4SP TCRs in MHC II deficient (def.) BM or C2TAkd versus control chimeras. Red dots indicate significant differences in TCR frequency (p < .05, Mann-Whitney U). (B) Summary of effects on the Tconv cell TCR repertoire with modulating MHC II expression on mTECs or BM APCs. Data shown are the percentage of unique TCRs (top) or total sequences (bottom) in the filtered data set that are negatively selected based on a statistically significant effect and ≥ 80% decrease in WT frequency. (C) PCA of TCR frequencies. Red dots/arrow form a cluster of TCRs (variances: MHC II def. BM = 27.5%, C2TAkd = 11.1%) that correlate with, but are not necessarily identical to, the negatively selected TCRs in (A). Similarly, black dots/arrow represents TCRs unaffected by deficiency of MHC II in a given APC, and blue dots/arrow represent TCRs enriched in WT mice relative to C2TAkd mice (variance = 12.6%). Centroids represent the middle of a given cluster. A shorter line represents greater similarity to the centroid. Data represent three independent experiments with 2-3 replicates per experiment. See also Figure S1.
We classified TCRs as negatively selected based on an arbitrary >5 fold increase in frequency and statistical significance versus the WT condition. Using these criteria, BM APCs negatively selected approximately 25% of the TCR clones (Figure 1B, top), representing ∼30% of the Tconv cell population (Figure 1B, bottom). While a quantitative comparison of negative selection between BM APCs and mTECs was limited due to differences in the degree of MHC II reduction achieved experimentally, the TCR repertoire analysis suggested that both BM APCs and mTECs are capable of mediating negative selection.
Principal component analyses (PCA) were performed to further explore the clonal relationship between Tconv TCRs from various backgrounds (Figure 1C). Analysis of MHC II deficient BM APCs versus WT data sets revealed two distinct clusters representing TCRs negatively selected on BM APCs (red arrow) and unaffected TCRs (black arrow). Analysis of C2TAkd versus WT data sets showed a three factor structure representing TCRs negatively selected on mTECs (red arrow), unaffected TCRs (black arrow), and TCRs de-enriched by C2TAkd (blue arrow) that corresponded to the group of TCRs in Figure 1A (data points found above reference line, left panel). It is unclear why Aire-driven C2TAkd leads to a loss of Tconv TCR specificities. One possibility is that these TCRs are simply the result of stochastic mouse-to-mouse variability. However, these TCRs show statistical significance by nonparametric tests and clustering by PCA, suggesting that this is unlikely. Another untested possibility is that C2TAkd inhibits the positive selection of these particular Tconv TCRs. Because our primary goal was to study the role of APC subsets in tolerance, we focused our analysis on TCRs affected by deletion and Treg cell selection.
We observed negative selection of the Treg repertoire by both mTECs and BM APCs (Figure 2A). Several TCRs were significantly enriched when MHC II was deleted from BM APCs (red dots found below the reference line), a phenomenon that was less pronounced with mTECs. Treg TCRs classified as negatively selected by BM APCs represent approximately 35% of TCR clones, which accounted for ∼30% of the Treg cell population (Figure 2B). PCA analysis revealed a cluster of TCRs associated with negative selection (red arrows) by BM APCs, but not mTECs (Figure 2C). Together with the Tconv analysis, these data demonstrate that ablation of MHC II on BM APCs has a marked effect on the negative selection of a diverse array of both Treg and Tconv cell TCRs, estimated to comprise ∼30% of the analyzed TCR repertoire.
Figure 2. Role of BM APCs and mTECs in thymic Treg cell selection.
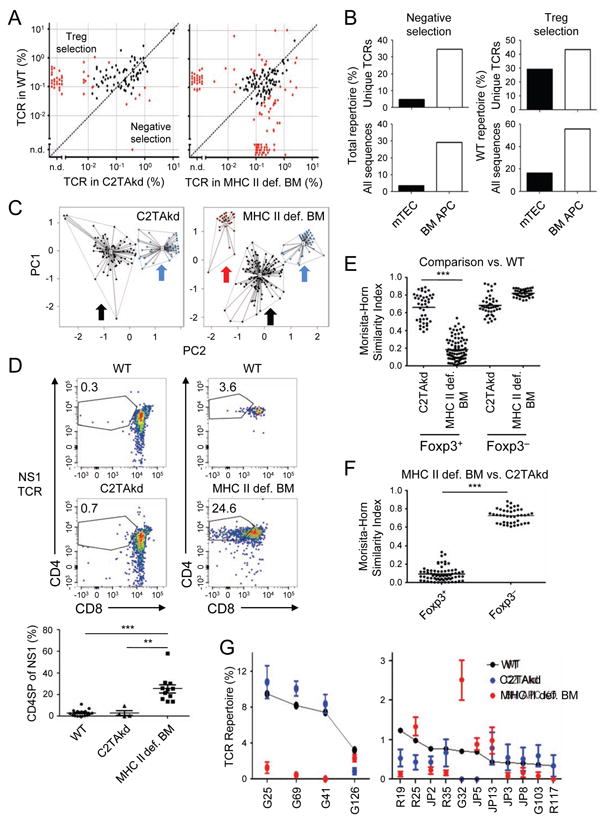
(A) Changes in Treg cell TCR frequency with manipulation of MHC II expression on BM APCs or mTECs. Data shown are the frequency of Foxp3+ CD4SP TCRs in MHC II def. BM or C2TAkd versus control chimeras as per Figure 1A. (B) Summary of effects on the Treg cell TCR repertoire with modulating MHC II on mTECs or BM APCs. Data shown are the percentage of unique TCRs (top) or total sequences (bottom) in the filtered data set that are interpreted to undergo APC-dependent negative selection (left), or Treg cell selection (right), based on statistical significance and ≥ 80% percent change in frequency versus WT. Note that negative selection is based on all of the TCRs in a given plot in (A), whereas Treg cell selection represents the frequency of the WT repertoire that is dependent on the indicated APC to avoid incorporating effects of negative selection. (C) PCA of TCR frequencies. Like Figure 1C, red dots/arrow correlate with negatively selected TCRs (variances: MHC II def. BM = 17.5%, C2TAkd = 11.6%), black dots/arrow unaffected TCRs, and blue dots/arrow Treg TCRs (variances: MHC II def. BM = 41.6%, C2TAkd = 28.0%). (D) BM APCs negatively select TCR NS1 in vivo. Data shown are representative flow cytometry plots (top) and summary (bottom) of intrathymic injection of _Rag 1-/-_thymocytes retrovirally-transduced with NS1 and transferred into WT versus C2TAkd (left) or WT versus MHC II def. BM (right) chimeric mice (data pooled from at least two independent experiments with 2 replicates per experiment). ***p < .001, Mann-Whitney U. (E, F) Morisita-Horn similarity analysis of Treg and Tconv cell TCR repertoires. In (E), the TCR repertoire from each MHC manipulation is compared with the WT repertoire, whereas in (F) the comparison is between the MHC II def. BM APC and C2TAkd repertoires. An index value of 1 indicates that the two samples are completely similar whereas an index value of 0 means they are completely dissimilar. (G) Analysis of individual Treg cell TCRs from the WT condition. The top 15 individual Foxp3+ CD4SP TCRs from aggregated WT data sets are shown sorted by frequency, along with the corresponding frequency in the C2TAkd or MHC II def. BM Treg TCR repertoires. See also Figure S2.
The results of this TCR repertoire analysis implied that certain TCRs instruct developing Tconv and Treg cells to undergo negative selection. For example, TCR clone NS1 is rare in the normal Treg TCR repertoire, but common when MHC II is deficient in BM APCs (Figure S2A). To demonstrate the functional role of TCRs in instructing cell-fate decisions in vivo, we used a retroviral vector to express NS1 in _Rag1_–/– thymocytes, and injected them into the thymi of chimeras with selective MHC II deficiency in either mTECs or BM APCs (Figure 2D). CD4SP cells were readily observed when MHC II was absent from BM APCs (∼20%, Figure 2D), a portion of which were Foxp3+ (data not shown). Similar results were obtained with another TCR, NS3 (Figure S2B). Thus, these in vivo results provide independent validation for the TCR repertoire analysis showing negative selection by BM APCs.
BM APCs and mTECs select non-redundant thymic Treg cell pools
In conjunction with the enrichment of certain Treg cell TCRs with MHC II ablation on BM APCs, there was also a loss of distinct TCRs from the Treg cell repertoire (Figure 2A, red dots above reference line). As Treg cell differentiation is driven by selfrecognition, the decrease in frequency of certain TCRs would be consistent with the loss of Treg cell selection mediated by BM APC antigen presentation (Figure 2B). While the diminished MHC II expression on mTECs affected the negative selection of a small number of Tconv and Treg cell TCRs, it led to a decrease in the frequency of many more Treg cell TCRs (Figure 2A, data points above reference line in the left panel). The effect of MHC II-deficiency in BM APCs on the Treg cell population as a whole was much greater than the effect of C2TAkd on mTECs suggesting that BM APCs facilitate Treg cell selection of more frequent Treg cell TCRs (∼60% compared to ∼20%, Figure 2B). PCA analysis confirmed that a cluster of TCRs associated with Treg cell selection (blue arrow) was present in both MHC II deficient BM and C2TAkd mTEC conditions (Figure 2C). These results suggest that both APC types are directly involved in Treg cell selection.
BM APCs and mTECs presumably present distinct arrays of antigens related to different mechanisms of antigen processing and presentation, as well as different transcriptional landscapes partially attributable to the expression of Aire in mTECs. However, antigen transfer from mTECs to BM APCs may blur the distinction between antigens that are specific to mTECs or BM APCs. We therefore asked whether the TCR repertoires selected by BM APCs versus mTECs were similar. The Treg and Tconv cell repertoires within each experimental condition were different, as suggested by the uniformly low similarity values measured by the abundance weighted Morisita-Horn index (Figure S2C), and PCA (Figure S2D). This is in agreement with the notion that Treg cell selection is determined by self-recognition on the remaining APCs (Jordan et al., 2001; Lee et al., 2012; Moran et al., 2011). Consistent with the estimated effect on the Treg cell TCR repertoire (Figure 2B), the Morisita-Horn index showed dissimilarity between the Treg cell TCR repertoires of MHC II deficient versus WT BM conditions (Figure 2E) which was not due to variability between mice (Figure S2E). The Treg cell TCR repertoire selected by BM APCs was also quite different than that selected by mTECs (∼0.1, Morisita-Horn index, Figure 2F, S2F). Thus, these findings suggest that ablation of MHC II on BM cells has more profound effects on the Treg cell population than does silencing of MHC II on mTECs.
The difference in the Treg cell TCR repertoire suggested by global analysis could also be visualized upon inspection of the 15 most frequent Treg cell TCRs in WT mice (Figure 2G, S2G). There was a marked reduction of 10 TCRs in MHC II deficient BM APCs, including the top 3 most frequent TCRs, often with concomitant increase in the Tconv cell subset (Figure S2G). By contrast, only 6 of the 15 most frequent TCRs were decreased with silenced MHC II in mTECs. We confirmed the Treg cell TCR sequencing data by retroviral expression of the BM APC-dependent Treg cell TCR G41 in _Rag1_–/– thymocytes followed by intrathymic transfer of these cells into mouse chimeras with selective MHC II deficiency on BM APCs or mTECs (Figure S4A).
Despite the involvement of mTECs in selecting Treg cells with certain TCR specificities (Figure 2A-C), Morisita-Horn analysis of the Treg cell TCR repertoires between C2TAkd and WT showed high similarity (Figure 2E). A follow-up assessment of the top 15 C2TAkd Treg TCRs revealed that the top 3 most frequent TCRs are also the top 3 most frequent Treg cell TCRs in the WT (Figure 3A), which was not the case with BM APCs (Figure 2G). Because the Morisita-Horn similarity index is abundance weighted, we asked whether successive removal of these TCRs from the analysis would alter this similarity. Indeed, removal of the top 3 TCRs suggested that, similar to BM APCs, mTECs do select a substantial portion of the Treg cell TCR repertoire, albeit less frequent Treg cell TCRs (Figure 3B). This effect was not observed with removal of the top 3 TCRs from WT repertoires (Figure S3A). As independent validation, retroviral expression of mTEC-dependent Treg cell TCRs confirmed that MHC II presentation by mTECs was important for Treg cell selection (Figure 3C, 4, S3B). These results suggest that a substantial portion of the Treg cell repertoire is selected via antigen presentation by mTECs.
Figure 3. mTECs select a substantial portion of the thymus-derived Treg repertoire.
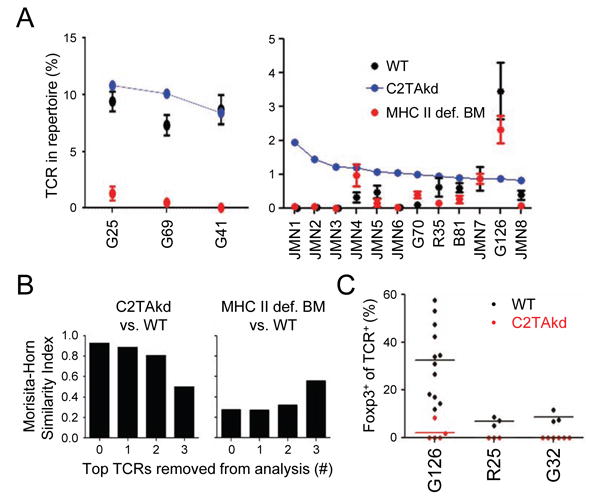
(A) Analysis of individual Treg cell TCRs from C2TAkd chimeras. The top 15 Foxp3+ TCRs in the C2TAkd dataset are shown sorted by frequency, along with the corresponding frequency in the WT and MHC II def. BM datasets. (B) Change in Morisita-Horn index with removal of most common TCRs. Similarity between Foxp3+ TCR repertoires of C2TAkd versus WT (left) and MHC II def. BM APC versus WT (right) were assessed after removing the top 1, 2, or 3 highest frequency WT TCRs from the analysis. (C) In vivo validation of Treg cell TCRs dependent on mTEC antigen presentation. Three high frequency mTEC-dependent Treg TCRs were identified by sequencing, including G126, a common C2TAkd Treg TCR reduced in frequency in comparison with WT (Figure 3A). TCR-expressing _Rag1_-/- thymocytes were injected into the thymi of WT or C2TAkd hosts and analyzed at ∼ 2.5 weeks for Foxp3 expression by flow cytometry by gating on CD45.1+ CD45.2″ Va2+ CD4SP cells. Data were pooled from at least two independent experiments with 2 replicates per experiment. See also Figure S3.
Figure 4. Thymus-derived Treg selection is primarily dependent on CD11c+ dendritic cells.

The top 5 WT Treg cell TCRs, of which the top 4 are BM APC-dependent, were retrovirally transduced into _Rag1_–/– thymocytes, which were intrathymically injected into WT, CD11c-Cre ROSA-DTA, or C2TAkd hosts. Data shown are representative flow cytometry plots (left) and summary graphs (right) with each dot representing the data from one host. Each TCR was analyzed in at least 2 independent experiments with 2-3 replicates. **p < .01, ***p < .001, ns = not significant (Mann-Whitney U). See also Figure S4.
DCs are the primary BM APC subset involved in Treg cell selection
Because BM APCs consist of multiple populations capable of antigen presentation, we next sought to identify the population mediating Treg cell selection. To do so, we used mice in which conventional DCs are constitutively deleted via a CD11ccre transgene that activates diphtheria toxin conditionally expressed under the control of the ROSA locus (Ohnmacht et al., 2009). Thymocytes with retroviral expression of the top four WT Treg cell TCRs (G25, G69, G41, R19) showed poor Treg cell development in CD11c-cre ROSA-DTA mice in comparison with WT or C2TAkd mice (Figure 4, S4B). By contrast, the mTEC-dependent TCR G126 showed normal Treg cell selection in WT and CD11c-cre ROSA-DTA mice, but not in C2TAkd mice (Figure 4, S4B). These findings suggest that conventional DCs are the primary BM-derived APC subset that mediates thymic Treg cell selection.
Aire is required for selection of a subpopulation of thymic Treg cells
An important feature of mTECs is their expression of Aire, a gene responsible for promiscuous expression of tissue specific antigens (Anderson and Su, 2011; Mathis and Benoist, 2009). The role of Aire in Treg cell selection has been controversial (Anderson et al., 2005; Daniely et al., 2010; Malchow et al., 2013). Therefore, we assessed the TCR repertoire of Aire∼/∼ mice with a TClip transgene (Figure S5A-C). We found that a number of Tconv and Treg cell TCRs were enriched in Aire_/″ compared to isogenic Aire+/+ mice (Figure 5A,B; S5D), suggesting that Aire plays a role in negative selection of both Tconv and Treg cells.
Figure 5. Aire selects a subset of thymic Treg cells.
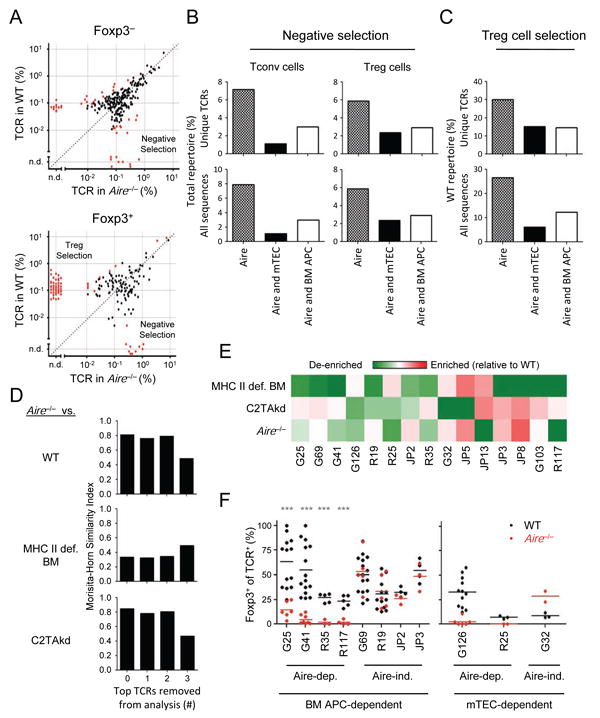
(A) Changes in TCR frequency with Aire. The frequencies of Foxp3– (top panel) and Foxp3+ (bottom panel) TCRs in WT and _Aire_–/– mice are plotted as per Figure 1A and 2A. Red dots indicate TCRs that are significantly different by Mann-Whitney U (p < .05). (B, C) Summary of the effects of Aire on the TCR repertoire. Data shown are the percentage of unique TCRs (top) or total sequences (bottom) interpreted to undergo Aire-dependent negative selection (B) or Treg cell selection (C), as described in Figures 1B and 2C. (D) Morisita-Horn similarity analysis of Treg cell TCR repertoires from _Aire_–/– versus WT mice (top), or MHC-II-def. BM (middle) or C2TAkd (bottom), with leave-one-out analysis of the highest frequency _Aire_–/– TCRs as per Figure 3B. (E) Analysis of the top 15 WT Treg cell TCRs for their dependence on BM APCs, mTECs, and Aire. The heatmap shows the effect of an indicated experimental condition on an individual TCR (% of TCR in condition / [% in WT + % in condition]). Values < 0.5 indicate a loss of the TCR in the condition (green color), implying that the selection of the Treg cell TCR is dependent on the condition. Red represents values > 0.5 indicating enrichment of TCR in condition relative to WT, suggestive of negative selection. (F) In vivo analysis of BM APC- and mTEC- dependent Treg cell TCRs. As per Figure 3, Treg cell differentiation in response to Aire was assessed using _Rag1_–/– thymocytes transduced with retrovirus expressed Treg cell TCRs showing varying dependence on Aire, BM APCs, and mTECs by TCR repertoire analysis. Each TCR was tested in at least 2 independent experiments with 1-3 replicates per experiment. Each dot represents data from a single host. Mann-Whitney U test, ***p < .001. See also Figure S5.
We also observed that a number of Treg cell TCRs were significantly diminished in frequency in Aire-/- mice, consistent with Aire-dependent Treg cell selection (Figure 5A,C; S5E). This contrasted with the high degree of similarity between Aire-deficient and -sufficient Treg TCR repertoires based on the Morisita-Horn similarity index. However, we found that this was based primarily on the top three TCRs, as their removal markedly lowered the Morisita-Horn similarity values (Figure 5D), consistent with an effect of Aire on lower frequency TCRs. Thus, depending on whether the analytic approach favors more abundant TCRs or assesses them at an individual TCR level, Aire may be viewed as having no effect to having a significant effect on Treg cell selection, potentially explaining previously conflicting studies on the role of Aire in Treg cell selection (Daniely et al., 2010; Malchow et al., 2013).
Because Aire is exclusively expressed in TECs in the thymus, we asked whether Aire-dependent TCRs were selected via antigen presentation by mTECs. Consistent with this hypothesis, Morisita-Horn analysis indicated that the Aire-deficient Treg cell TCR repertoire was quite similar to the C2TAkd repertoire (∼ 0.8) but not to the MHC II deficient BM Treg TCR repertoire (∼0.35). However, upon removal of the top 3 TCRs from the analysis, the Aire-deficient Treg cell TCR repertoire was much less similar to the C2TAkd repertoire (∼0.5) and equivalently similar to the MHC II deficient BM repertoire (∼0.5, Figure 5D, S5E), consistent with a role for Aire in selecting lower frequency Treg cell TCRs. Cross-referencing the list of Treg cell TCRs that were Airedependent with those that were BM APC- or mTEC-dependent confirmed the substantial role of both BM APCs and mTECs in mediating Aire-dependent central tolerance (Figure 5B,C). This can also be visualized in the analysis of the top 15 Treg cell TCRs found in WT condition (Figure 5E). Of the 7 TCRs that were Aire-dependent (G25, G41, G126, R25, R35, JP13, R117), 4 were also dependent on BM APCs (G25, G41, R35, R117) and 2 on mTECs (G126, R25). These findings suggest that the presentation of Aire-dependent antigens by BM APCs plays a major role in central tolerance.
To independently confirm these sequencing analyses, we used retrovirus to express Aire-dependent Treg TCRs in _Rag1_–/– thymocytes and then assessed Foxp3+ Treg cell development in Aire-deficient or -sufficient hosts. The in vivo behavior of six Aire-dependent and five Aire-independent Treg cell TCRs recapitulated the patterns observed via TCR sequencing (Figure 5F, S5F). This sample set of Treg cell TCRs also included those dependent on MHC II presentation by CD11c+ DCs or mTECs as assessed previously (Figure 3, 4), confirming the non-redundant roles of these APC subsets in mediating the effects of Aire seen by TCR sequencing. Thus, while many Aire-dependent Treg cell TCRs are selected in response to autologous antigen presentation by mTECs, others are selected via antigen presentation by CD11c+ DCs that do not express Aire.
Aire has been suggested to facilitate the recruitment of DCs via production of chemokines by mTECs (Lei et al., 2011). However, Aire-deficiency did not abrogate all Treg cell selection by BM APCs, as six of 10 common BM-dependent Treg cell TCRs were Aire-independent by TCR sequencing (Figure 5E). Moreover, four of eight BM APC-dependent TCRs expressed on Rag1-/- thymocytes in vivo also facilitated Treg cell selection independent of Aire as predicted based on TCR sequencing (Figure 5F). Thus, Aire does not appear to affect Treg cell selection via a global effect on the total thymic DC population.
BATF3-dependent CD8α+ DCs preferentially acquire and present Aire-dependent antigens to mediate Treg cell selection
BM APCs play a major role in Aire-dependent and -independent Treg cell selection (Figure 5C). As there are a number of distinct cell types within the BM APC population, we sought to identify the subset(s) relevant to Treg cell selection. Our data using retroviral TCR expression in thymocytes suggested that the major BM APC subset responsible for Treg cell selection were CD11 c+ DCs (Figure 4). Thymic CD11 c+ DCs can be subdivided into two primary subsets, the SIRPa+ DCs and CD8α+ DCs, which may be functionally redundant because they both acquire and present bloodderived antigens (Atibalentja et al, 2011). To test whether CD8α+ DCs were necessary for Treg cell selection, we used a retroviral vector to express BM APC-dependent Treg cell TCRs in Rag1-/- thymocytes and intrathymically transferred these cells into CD8α+ DC-deficient _Batf3_-/- hosts (Figure S6A) (Hildner et al, 2008). We observed that CD8α+ DCs were required for four out of eight BM APC dependent TCRs tested (Figure 6A, S6B). By contrast, depletion of plasmacytoid DCs in the thymus had no effect on Treg cell selection of 4 BM APC-dependent TCRs (Figure 6B, S6C). We conclude that in a polyclonal repertoire, CD8α+ DCs and SIRPa+ DCs play non-redundant roles in Treg cell selection.
Figure 6. CD8α+ DCs preferentially acquire and present Aire-dependent antigens to developing Treg cells.
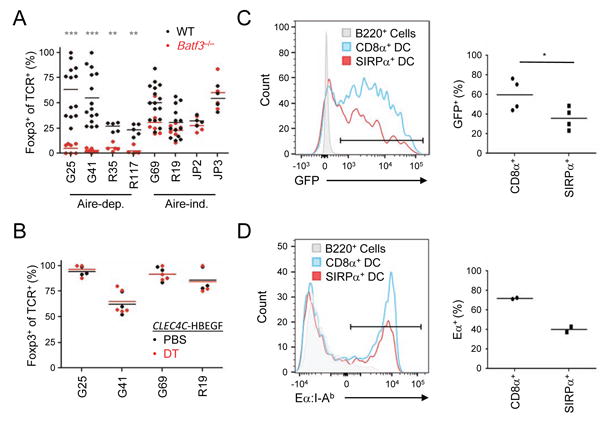
(A) In vivo analysis of the role of CD8α+ DCs in Treg selection of TCRs dependent on both BM APC and Aire. As in Figure 3, Rag 1-/- thymocytes expressing TCRs were injected into the thymi of _Batf3_-/- or WT hosts. (B) Plasmacytoid DCs are not required for Treg cell differentiation of Aire and BM APC co-dependent Treg TCRs. As per (A), except the Treg TCRs were tested in _CLEC4C_-HBEGF mice treated with diphtheria toxin (120 ng/mouse) or PBS. (C) Protein transfer from radioresistant host thymic cells to CD8α+ and SIRPa+ DCs. BM chimeras of Ly5.1 (donor) into Actin-GFP (host) mice were harvested after 4 weeks, and presence of host-derived GFP in donor DCs was assessed. Representative flow cytometry histogram overlays and pooled data are shown. (D) Antigen transfer from radioresistant thymic epithelial cells to CD8α+ DCs. BM chimeras of Ly5.1 H-2b (donor) into H-2d (host) mice were harvested after 4 weeks. The presence of host-derived Ea 52-68 peptide bound to I-Ab on donor DCs was assessed using the YAe antibody. *p < .05, **p < .01, ***p < .001, ns = not significant (Mann-Whitney U). Plots shown are pooled from at least two experiments with 1-3 replicates per experiment. Each dot represents data from an individual host. See also Figure S6.
CD8α+ DCs were required for Treg cell selection of TCRs co-dependent on Aire and BM APCs, as all four CD8α+ DC-dependent Treg cell TCRs were Aire-dependent, whereas all 4 CD8α+ DC-independent Treg cell TCRs were Aire-independent (Figure 5E,F; 6A). To assess whether our observations reflect antigen transfer from mTECs to CD8α+ DCs, we generated BM chimeras in which host cells (i.e. mTECs) expressed GFP under the chicken beta actin promoter, and analyzed the acquisition of GFP by congenially marked donor DCs. We found that CD8α+ DCs acquired significantly more GFP than SIRPa+ DCs, consistent with antigen transfer from mTECs to CD8α+ DCs (Figure 6C). However, it is possible that the increased amount of GFP in CD8α+ DCs might reflect a differential ability to degrade GFP. Therefore, we tested whether host cell-generated antigens could be presented on MHC II of donor cells by generating BM chimeras with H-2b donors into H-2d hosts and assessing the presentation of host derived Ea on donor I-Ab using the monoclonal antibody YAe (Humblet et al., 1994; Rudensky et al., 1991). Indeed, CD8α+ DCs presented more Ea on I-Ab than SIRPa+ DCs, corroborating our hypothesis that CD8α+ DCs are more efficient at acquiring and presenting mTEC-derived antigens (Figure 6D). Taken together, these findings suggest that CD8α+ DCs show an enhanced ability compared with SIRPa+ DCs to acquire and present antigens from thymic epithelial cells. Thus, our results indicate that CD8α+ DCs play an important role in acquiring and presenting Aire-dependent antigens for thymic Treg cell development.
Discussion
Thymocyte encounter with self-antigen in the thymic medulla is crucial for the generation of self-tolerance - a process notable for its involvement of a myriad of APCs and transcription factors. Although previous work has suggested contributions of each APC subset and Aire to T cell tolerance at a population level, it remained unclear if these components functioned uniquely or redundantly. Here, we made several observations regarding CD4+ T cell tolerance by analyzing TCR repertoires in a fixed TCRp model. First, mTECs and BM APCs make non-redundant contributions to deletion and Treg cell selection, suggesting that each APC subset differs in the self-antigens that they functionally display. Within the BM APC population, CD11c+ DCs were the primary subset involved in Treg cell selection. Second, Aire expression in mTECs affected both deletion and Treg cell selection. However, Aire had a greater impact on lower frequency TCRs, which may explain previous conflicting reports depending on whether the analysis favored more global versus individual T cell clonal assessments. Third, the presentation of antigens induced by Aire occurred by both BM APCs and mTECs. Because Aire is not expressed in BM cells, this implies that antigen transfer is a major mechanism involved in Aire-dependent tolerance. Finally, of the thymic DC subsets, BATF3-dependent CD8α+ DCs were primarily responsible for taking up Aire-dependent antigens from mTECs for inducing Treg cell selection. Thus, these data reveal a remarkable complexity and interdependence between Aire and the medullary APC subsets.
The extent of negative selection by BM APCs and mTECs estimated by our TCR repertoire analysis is within range of previous estimates. For example, it has been suggested that BM APCs may delete up to half of the positively selected CD4+ T cell population based on the observation that chimeras with MHC II deficient BM donors had anywhere from 50% (Hinterberger et al., 2010) to 70% (van Meerwijk et al., 1997) greater CD4SP cell numbers. Similar results were reported for genetic depletion of DCs (Ohnmacht et al., 2009) and deletion of MHC II on DCs (Liston et al., 2008). However, a recent report by Hogquist et al incorporating mathematical modeling suggests that only ∼10% of CD4SP cells undergo negative selection in total (Sawicka, 2014). For mTEC mediated negative selection, it was reported that C2TAkd mice have an increase of ∼20% in CD4SP cells, and ∼46% in Treg cells (Hinterberger et al, 2010).
Our TCR repertoire analysis suggested that around ∼30% and ∼10% of the CD4SP population were negatively selected by BM APCs and mTECs, respectively. This is based primarily on our estimates of negative selection in Tconv cells, as negatively selected Treg cells are 1/10th in number. Potential differences between these various estimates could arise from the different analytic approaches. For example, extrapolating negative selection from changes in CD4SP cell numbers may not account for differences in cell survival, proliferation, or emigration. Additionally, our use of a fixed TCRp chain may not entirely reflect the WT TCR repertoire. However, data from previous groups using limited repertoire models have generally been consistent (Hsieh et al., 2004; Pacholczyk et al., 2007; Wong et al., 2007), albeit sometimes with different interpretations (Hsieh et al., 2012; Klein et al., 2014). The use of MHC II deficient BM APCs does not exclude the possibility that they may be able to acquire intact MHC II from mTECs. Finally, the use of C2TAkd may underestimate the contribution of mTECs as the blockade of MHC II synthesis is incomplete (Hinterberger et al., 2010). While further studies are required to resolve these quantitative differences, our data support the pre-existing notion that BM APCs, and to a lesser extent mTECs, both play important and non-redundant roles in the negative selection of a substantial number of TCR clones.
By contrast, our TCR repertoire analysis revealed a major alteration in Treg cell selection imparted by BM APCs, which was unexpected based on current studies. Previously, it was suggested that BM APCs were not required for Treg cell selection as normal Treg cell frequencies or numbers occurred with expression of MHC II only on thymic cortical epithelial cells (Bensinger et al., 2001) or with ablation of MHC II on DCs (Hinterberger et al., 2010; Liston et al., 2008). Our TCR repertoire analysis suggests that BM APCs alter the composition of the thymic Treg cell repertoire without changing overall Treg cell numbers by facilitating both the addition and removal of TCR clones from the Treg cell population.
Our data may help resolve an ongoing controversy regarding the role of Aire in Treg cell selection. Some have argued against a role for Aire in Treg cell selection based on normal polyclonal Treg cell numbers (Anderson et al., 2005) and minimal change in the global TCR repertoire in a limited TCR repertoire model (Pacholczyk et al., 2007). Others have reported that there are differences in Treg cell numbers in Airedeficient mice (Lei et al., 2011), and that two TCR transgenic lines were dependent on Aire for thymic Treg cell selection (Malchow et al., 2013). Our TCR repertoire analysis suggests that Aire affects both Treg cell selection and deletion. However, because Aire more commonly affects lower frequency TCRs, its effect is likely masked when analyzing bulk Treg cell numbers or TCR repertoire similarity using abundance weighted assessments.
In addition to addressing the role of Aire on Treg cell selection, we quantified the antigen presentation requirements for Aire by cross-referencing sequences from Aire and APC data sets. Our observation of mTEC and Aire co-dependent Treg cell TCRs is consistent with recent studies showing that antigens expressed in mTECs can be autologously presented via an autophagy-dependent pathway (Aichinger et al., 2013; Nedjic et al., 2008). Unexpectedly, we also found that many Aire-dependent Treg cell TCRs were dependent on BM APCs. Because Aire is not expressed in BM APCs, our findings suggest that mTEC antigens are transferred to BM APCs, a phenomenon that has been observed at the level of individual antigens using TCR transgenic models or MHC II tetramers (Gallegos and Bevan, 2004; Hubert et al., 2011; Koble and Kyewski, 2009; Taniguchi et al., 2012). Our data suggests that the process of antigen-transfer is quite common, being involved in approximately 50% of Aire-dependent deletion and Treg cell selection.
Because the TCR repertoire studies were performed at the level of individual TCRs, we were able to utilize sequencing results to isolate representative TCRs to further interrogate the BM APC population involved in the transfer and presentation of Aire-dependent antigens. Our in vivo analysis of TCRs that were co-dependent on BM APC and Aire revealed that CD8α+ DCs were required for antigen transfer-mediated Treg cell selection. Consistent with this, we found that CD8α+ DCs were more efficient than SIRPa+ DCs at acquiring I-Ea and the neo-self antigen GFP from thymic stromal cells. Although previous work demonstrates that CD8α+ and SIRPa+ DCs equivalently present blood-derived antigens (Atibalentja et al., 2011), our results suggest that CD8α+ DCs may have additional properties that facilitate antigen transfer from mTECs. One such property may be the expression of the chemokine receptor XCR1 by thymic CD8α+ DCs, which recognizes XCL1 produced by mTECs in an Aire-dependent manner (Lei et al., 2011) and could facilitate DC:mTEC interactions. Taken together, these data suggest that BATF3-dependent CD8α+ DCs are the primary BM APC subset responsible for antigen transfer-mediated Treg cell selection of Aire-dependent antigens.
BATF3-deficiency was previously reported to result in the loss of the CD8α+ DC subset by phenotypic markers and functional assays in the periphery (Hildner et al., 2008). Similarly, we observed functional deficiencies in the selection of certain Treg TCR clones associated with loss of phenotypic CD8α+ DCs. However, our data cannot definitively exclude the possibility that DCs in the CD8α+ lineage remain with altered function and cell-surface phenotype in BATF3 deficient mice. It is worth noting that the difference in CD8α+ and SIRPa+ DCs in presenting mTEC derived antigens may be quantitative, as we did see antigen transfer occur with both DC subsets. Further studies will be required to address the role of SIRPa+ DCs in T cell selection at the clonal level.
Another distinct property of CD8α+ DCs is that they are much more efficient at cross-presenting exogenous antigens onto MHC I than other DC subsets (Hildner et al., 2008; Joffre et al, 2012; Proietto et al, 2008a). It is notable that thymic deletion of MHC I restricted T cells has also been shown to occur via antigen transfer to BM APCs (Gallegos and Bevan, 2004; Hubert et al, 2011). Thus, we speculate that the ability to cross-present would allow CD8α+ DCs to efficiently educate both CD4+ and CD8+ T cells to self-antigens acquired from Aire-expressing mTECs.
If CD8α+ DCs play an important role in Treg cell selection, why has spontaneous autoimmunity not been reported for _Batf3_-/- mice? In this regard, it is interesting to note that immunopathology is reportedly mild in Aire-/- mice on the same C57BL/6 background as the mice in our study (Hubert et al, 2009). For _Batf3_-/- mice, an additional possibility is that CD8α+ DCs are required both for selection in the thymus and activation of the same TCR specificities in the periphery (Klein et al, 2014). Future studies are required to address these possibilities.
In summary, our analysis of a fixed TCRp repertoire provides insights into how medullary APCs and Aire educate the developing T cell population. We have shown that both mTECs and BM APCs make non-overlapping contributions to thymic deletion and Treg cell selection to shape the mature CD4+ T cell population, and that Aire-mediates its effects via both BM and mTEC antigen presentation. Furthermore, we have demonstrated that of the BM APCs, CD8α+ DCs primarily acquire and present Aire-dependent antigens to developing Treg cells. However, it remains unclear why certain Aire-dependent TCRs undergo Treg cell selection on mTECs and others on BM APCs. Is it because some antigens are more readily loaded onto MHC II via macroautophagy for autologous presentation on mTECs, whereas other antigens are not? Are there specific features of Aire-dependent antigens such as cell surface association that favor transfer to CD8α+ DCs? Thus, future experiments are required to understand the mechanistic and functional rationale for the transfer of Aire-dependent antigens from mTECs to CD8α+ DCs in mediating central tolerance.
Experimental Procedures
Mice
All experiments involving mice were performed using protocols approved by the Washington University Animal Studies Committee. Mice were on a C57Bl/6 genetic background. Animals were housed and bred in a specific pathogen-free animal facility. TClip mice (Wong, et al., 2000) and _Batf3_-/-(Hildner et al., 2008) mice, have been previously described. _CLEC4C_-HBEGF (BDCA2-DTR) mice were a gift from M. Colonna (WUSTL); CD11c-cre x ROSA-DTA; C2TAkd mice from L. Klein (LMU Munich); p-actin-GFP from M. Miller (WUSTL); and Foxp3gfp mice from A. Rudensky (MSKCC). MHC II-deficient (Stock# 003239), _Aire_-/-(Stock# 004743), Rag1-/-(Stock# 002216), and _Foxp3_IRES-GFP (Stock# 006772) mice were purchased from The Jackson Laboratory. Animals were typically 6-8 weeks old at the time experiments were performed.
Reagents, antibodies and flow cytometry
Fluorescently conjugated antibodies were purchased from Biolegend, eBioscience, and Becton Dickenson. YAe anti-I-Ab:Ea peptide was obtained from Affymetrix. Samples were analyzed using a FACSAria (Becton Dickinson) and data were processed with FlowJo (Treestar).
Thymic dendritic cell isolation
Based on (Hildner et al., 2008), whole thymus was mechanically separated with scissors and digested with Liberase (125 ng/ml, Roche) and DNase I (50 ng/ml, New England Biolabs) in DMEM for 30 min at 37°C.
TCR sequencing
Synthesis of TCRa cDNAs from purified T cells was performed as described (Hsieh, et al., 2006). PCR was performed using a forward primer containing the GS FLX Titanium Amplicon Primer A sequence followed by sequence directed against TRAV14 (italics) 5′- CGTATCGCCTCCCTCGCGCCATCAG ATGGACAAGATCCTGACAGC - 3′. The reverse primer contained the GS FLX Titanium Series Lib-A or Lib-L primer, followed by an 8 or 12 bp error correcting barcode (Ns) (Fierer et al, 2008) and a sequence complementary to C alpha (italics), 5′-CCATCTCATCCCTGCGTGTCTCCGACTCAGNNNNNNNNACACAGCAGGTTCTGGGTTC-3′ and 5′-CTATGCGCCTTGCCAGCCCGCTCAGNNNNNNNNNNNNACACAGCAGGTTCTGGGTTC-3′, respectively. The ∼500 bp amplicons were quantified using Qubit (Invitrogen) and pooled in equimolar ratios for emulsion PCR and 454 pyrosequencing (Titanium chemistry). Pyrosequencer reads were demultiplexed by sample and analyzed to determine the CDR3 sequence. Briefly, we used a custom BLAST database of V- and J- sequences (acquired from IMGT) (Giudicelli et al., 2006) to determine the boundaries of the V and J regions to identify the CDR3 amino acid sequence. Raw sequence data can be found in the European Nucleotide Archive (accession # PRJEB6458).
Assessment of thymic Treg cell selection in vivo
As described previously (Lathrop, et al., 2011), TCRa chains of interest were cloned into the TCRa-P2A-TClip retroviral vector. _Foxp3_IRES-GFP _Rag1_–/– thymocytes were transduced with TCRs in vitro, injected intrathymically into sublethally (600 rad) irradiated mice, and analyzed approximately 2.5 weeks later. In many experiments, thymocytes were transduced with TCR vector containing an IRES-Thy1.1 marker, and mixed with thymocytes transduced with a TCR vector lacking Thy1.1 prior to injection.
Bone marrow chimeras
BM was obtained by flushing donor humerus, tibia, and femur. After RBC lysis, 5x10⁶ cells were injected into 1000 rad lethally irradiated host mice.
Statistical analysis
Graphpad Prism v6, SPSS v21, and R v3.0.2 were used for statistical and graphical analysis. The Mann-Whitney U test was used for between-subjects analyses. PCA and k means clustering were performed to analyze individual-group relationships. Morisita-Horn indices estimate species similarity between data sets.
Supplementary Material
Figure S1, related to Figure 1. Both BM and mTEC APCs mediate negative selection.
(A) 454 pyrosequencing of TCRs from MHC II deficient (def.) BM and C2TAkd chimeras and the corresponding controls which are wild-type (WT) for MHC expression. Chimeras were generated using TClip Tcra+/∼ (MHC II def. or WT) TCR transgenic donors. After 6 weeks, Foxp3+ (CD4+CD8-Foxp3gfp+) and Foxp3- (CD4+CD8-CD62LhiCD24loFoxp3gfp-) cells were sorted and the TCRs sequenced by 454. (B) Effect of filtering TCRs that are found > 0.1 % in at least one mouse in a given condition. Shown are plots of the total frequency captured by the filtered TCRs (left) and the average frequency in a given experimental condition of the TCRs lost by this filtering criteria in the WT -» WT Treg and Tconv repertoires (right).
Figure S2, related to Figure 2. Role of BM APCs and mTECs in thymic Treg cell selection.
(A) Distribution of NS1 and NS3 in the TCR repertoires of WT, MHC II def. BM and C2TAkd conditions. (B) NS3 is negatively selected by BM APCs. Representative FACS plots of _Rag1_-/- thymocytes retrovirally-transduced with TCR NS3 and transferred into the thymi of WT, MHC II def. BM and C2TAkd chimeric mice. Plots are representative of 2 independent experiments with 1-2 replicates. (C) Assessment of similarity between Treg and Tconv TCR repertoires using Morisita-Horn analysis. Each Treg cell data set was compared to each Tconv data set for the indicated BM chimeras. (D) Principal component analysis comparing Foxp3+ versus Foxp3– CD4SP TCR data sets from the MHC II def. BM and C2TAkd conditions (left panels, Tconv variances: MHC II def. BM = 13.6%, C2TAkd = 7.6%; Treg variances: MHC II def. BM = 60.0%, C2TAkd = 39.2%), and the corresponding WT condition (right panels, Tconv variances: MHC II def. BM = 20.2%, C2TAkd = 9.1%; Treg variances: MHC II def. BM = 47.7%, C2TAkd = 30.0%). Red and blue dots/arrows indicate TCRs enriched in Tconv and Treg subsets respectively, whereas black dots/arrow indicate TCRs that overlap both subsets. Centroids represent the middle most point of a given cluster and the shorter the line the more similar a given TCR is to that centroid. (E) Assessment of intermouse variability using Morisita-Horn similarity analysis. TCR data sets from each WT mouse was compared with every other mouse within a given APC condition and T cell subset. (F) Principal component analysis of MHC II def. BM and C2TAkd TCR repertoires (Tconv variances: PC1 = 10.3%, PC2 = 54.2%; Treg variances: PC1 = 12.0%, PC2 = 25.1%). Dots/arrows are as described in (D). (G) Amino acid sequence of the top 15 WT TCRs and their frequencies in the WT, MHC II def. BM, and C2TAkd Treg and Tconv cell data sets.
Figure S3, related to Figure 3. mTEC antigen presentation is required for in vivo Treg cell selection of certain TCRs.
(A) Morisita-Horn similarity analyses between TCR repertoires of control WT -» WT BM chimeras in the MHC II def. -» WT and WT -» C2TAkd chimera experiments in Figure 3B. (B) As summarized in Figure 3C, TCRs dependent on autologous mTEC presentation for Treg cell selection (R25, G32) were retrovirally expressed in Rag1∼/∼ thymocytes and intrathymically injected into WT or C2TAkd hosts. After 2.5 weeks, thymi were analyzed by flow cytometry. Plots shown are gated on CD45 congenic markers, Va2+ and CD4SP for TCR expressing cells, and are representative of 3-4 replicates.
Figure S4, related to Figure 4. DCs are the primary BM APC subset involved in Treg cell selection.
(A) Analysis of BM APC-dependent Treg TCR G41 in vivo. Data shown are FACS plots of G41 expressing _Rag1_–/– thymocytes after intrathymic injection into WT, MHC II def. BM, and C2TAkd chimeric mice. Plots are representative of 2-3 replicates from 2 independent experiments. ***p < .001, Mann-Whitney U. (B) Clonal frequency plots after intrathymic injection of _Rag1_–/– thymocytes retrovirally-transduced with the indicated Treg TCRs for the experiments in Figure 4. Data shown represent the percentage of transferred compared to the total CD4SP population. Black dots represent WT hosts, blue dots represent C2TAkd hosts, and red dots represent CD11c-Cre ROSA-DTA hosts.
Figure S5, related to Figure 5. Aire selects a subset of thymic Treg cells.
(A) Summary of TCR sequences obtained from WT versus Aire-/- fixed TCRp mice. (B) Morisita-Horn similarity analysis between Treg and Tconv TCRs from WT and Aire-/- mice. (C) Principal component analysis of TCR frequencies between WT and Aire-/- mice (WT variances: PC1 = 15.2%, PC2 = 26.8%; Aire-/- variances: PC1 = 13.2%, PC2 = 44.9%) (D) Principal component analysis of the TCR frequencies between _Aire_-/- and WT mice for the indicated subset (Tconv variances: PC1 = 15.2%, PC2 = 26.8%; Treg variances: PC1 = 13.2%, PC2 = 44.9%). (E) Morisita-Horn similarity analysis between control WT(x00302) WT BM chimera Treg TCR repertoires from the _Aire_-/- and MHC II def. -> WT as well as WT (x00302) C2TAkd chimeric experiments in Figure 5D. (F) Representative FACS plots of Rag1-/- thymocytes retrovirally-transduced with indicated Treg TCRs and injected into Aire-/- hosts for the experiments summarized in Figure 5F. Data are representative of at least 2 independent experiments with 1-3 replicates per experiment.
Figure S6, related to Figure 6. CD8α+ DCs preferentially acquire and present Aire-dependent antigens to developing Treg cells.
(A) FACS plots of CD8α+ and SIRPa+ DCs from the thymi of Batf3+/∼ or _Batf3_-/- mice. Plots are representative of 4 replicates. (B) FACS plots after intrathymic injection of _Rag1_-/- thymocytes retrovirally-transduced with the indicated TCRs into _Batf3_-/- mice for the experiments summarized in Figure 6A. Plots are representative of at least 2 experiments with 1-3 replicates per experiment. (C) FACS plots of B220+ CD11c+ MHC II+ plasmacytoid DCs from _CLEC4C_-HBEGF mice treated with PBS or DT. Plots are representative of 3 replicates.
Acknowledgments
We thank Jinquin Luo (Div. of Biostatistics, WUSTL) for consultation regarding statistical analysis; T. Egawa and E. Unanue (both WUSTL) for critical reading of the manuscript and advice; L. Klein (LMU Munich), A. Rudensky (MSK), and M. Colonna (WUSTL) for gifts of reagents and mice. C.S.H. is supported by NIH NIAID AI079187 and the Burroughs Wellcome Fund; J.S.A.P. is the recipient of an R01 Research Supplement to Promote Diversity in Health-Related Research, NIH NIAID AI079187-06S1. A.K is the recipient of an NIH NRSA post-doctoral fellowship.
Footnotes
Author Contributions: J.SAP., C.W.L, K.M., and C.S.H. conceived of the project and designed the experiments; J.S.A.P., C.W.L., K.N., and Z.Y. performed the experiments; A.K. and JIG. performed the 454 sequencing; A.K. assisted in TCR sequence data analysis; and J.SAP., C.W.L. and C.S.H. wrote the manuscript.
Competing Financial Interests: The authors declare no competing financial interests.
Publisher's Disclaimer: This is a PDF file of an unedited manuscript that has been accepted for publication. As a service to our customers we are providing this early version of the manuscript. The manuscript will undergo copyediting, typesetting, and review of the resulting proof before it is published in its final citable form. Please note that during the production process errors may be discovered which could affect the content, and all legal disclaimers that apply to the journal pertain.
References
- Aichinger M, Wu C, Nedjic J, Klein L. Macroautophagy substrates are loaded onto MHC class II of medullary thymic epithelial cells for central tolerance. The Journal of Experimental Medicine. 2013;210:287–300. doi: 10.1084/jem.20122149. [DOI] [PMC free article] [PubMed] [Google Scholar]
- Anderson MS, Su MA. Aire and T cell development. Current Opinion in Immunology. 2011;23:198–206. doi: 10.1016/j.coi.2010.11.007. [DOI] [PMC free article] [PubMed] [Google Scholar]
- Anderson MS, Venanzi ES, Chen Z, Berzins SP, Benoist C, Mathis D. The Cellular Mechanism of Aire Control of T Cell Tolerance. Immunity. 2005;23:227–239. doi: 10.1016/j.immuni.2005.07.005. [DOI] [PubMed] [Google Scholar]
- Aschenbrenner K, D'Cruz LM, Vollmann EH, Hinterberger M, Emmerich J, Swee LK, Rolink A, Klein L. Selection of Foxp3+ regulatory T cells specific for self antigen expressed and presented by Aire+ medullary thymic epithelial cells. Nat Immunol. 2007;8:351–358. doi: 10.1038/ni1444. [DOI] [PubMed] [Google Scholar]
- Atibalentja DF, Murphy KM, Unanue ER. Functional Redundancy between Thymic CD8α+ and Sirpα+ Conventional Dendritic Cells in Presentation of Blood-Derived Lysozyme by MHC Class II Proteins. The Journal of Immunology. 2011;186:1421–1431. doi: 10.4049/jimmunol.1002587. [DOI] [PMC free article] [PubMed] [Google Scholar]
- Bensinger SJ, Bandeira A, Jordan MS, Caton AJ, Laufer TM. Major Histocompatibility Complex Class II –Positive Cortical Epithelium Mediates the Selection of Cd4+25+ Immunoregulatory T Cells. The Journal of Experimental Medicine. 2001;194:427–438. doi: 10.1084/jem.194.4.427. [DOI] [PMC free article] [PubMed] [Google Scholar]
- Bonasio R, Scimone ML, Schaerli P, Grabie N, Lichtman AH, von Andrian UH. Clonal deletion of thymocytes by circulating dendritic cells homing to the thymus. Nat Immunol. 2006;7:1092–1100. doi: 10.1038/ni1385. [DOI] [PubMed] [Google Scholar]
- Cowan JE, Parnell SM, Nakamura K, Caamano JH, Lane PJL, Jenkinson EJ, Jenkinson WE, Anderson G. The thymic medulla is required for Foxp3+ regulatory but not conventional CD4+ thymocyte development. The Journal of Experimental Medicine. 2013;210:675–681. doi: 10.1084/jem.20122070. [DOI] [PMC free article] [PubMed] [Google Scholar]
- Daniely D, Kern J, Cebula A, Ignatowicz L. Diversity of TCRs on Natural Foxp3+ T Cells in Mice Lacking Aire Expression. The Journal of Immunology. 2010;184:6865–6873. doi: 10.4049/jimmunol.0903609. [DOI] [PMC free article] [PubMed] [Google Scholar]
- Derbinski J, Kyewski B. How thymic antigen presenting cells sample the body's self-antigens. Current Opinion in Immunology. 2010;22:592–600. doi: 10.1016/j.coi.2010.08.003. [DOI] [PubMed] [Google Scholar]
- Fierer N, Hamady M, Lauber CL, Knight R. The influence of sex, handedness, and washing on the diversity of hand surface bacteria. Proceedings of the National Academy of Sciences. 2008 doi: 10.1073/pnas.0807920105. [DOI] [PMC free article] [PubMed] [Google Scholar]
- Gallegos AM, Bevan MJ. Central Tolerance to Tissue-specific Antigens Mediated by Direct and Indirect Antigen Presentation. The Journal of Experimental Medicine. 2004;200:1039–1049. doi: 10.1084/jem.20041457. [DOI] [PMC free article] [PubMed] [Google Scholar]
- Giudicelli V, Duroux P, Ginestoux C, Folch G, Jabado-Michaloud J, Chaume D, Lefranc MP. IMGT/LIGM-DB, the IMGT® comprehensive database of immunoglobulin and T cell receptor nucleotide sequences. Nucleic Acids Research. 2006;34:D781–D784. doi: 10.1093/nar/gkj088. [DOI] [PMC free article] [PubMed] [Google Scholar]
- Hildner K, Edelson BT, Purtha WE, Diamond M, Matsushita H, Kohyama M, Calderon B, Schraml BU, Unanue ER, Diamond MS, et al. Batf3 Deficiency Reveals a Critical Role for CD8α+ Dendritic Cells in Cytotoxic T Cell Immunity. Science. 2008;322:1097–1100. doi: 10.1126/science.1164206. [DOI] [PMC free article] [PubMed] [Google Scholar]
- Hinterberger M, Aichinger M, da Costa OP, Voehringer D, Hoffmann R, Klein L. Autonomous role of medullary thymic epithelial cells in central CD4+ T cell tolerance. Nat Immunol. 2010;11:512–519. doi: 10.1038/ni.1874. [DOI] [PubMed] [Google Scholar]
- Hinterberger M, Wirnsberger G, Klein L. B7/CD28 in central tolerance: costimulation promotes maturation of regulatory T cell precursors and prevents their clonal deletion. Frontiers in immunology. 2011;2 doi: 10.3389/fimmu.2011.00030. [DOI] [PMC free article] [PubMed] [Google Scholar]
- Hsieh CS, Lee HM, Lio CWJ. Selection of regulatory T cells in the thymus. Nat Rev Immunol. 2012;12:157–167. doi: 10.1038/nri3155. [DOI] [PubMed] [Google Scholar]
- Hsieh CS, Liang Y, Tyznik AJ, Self SG, Liggitt D, Rudensky AY. Recognition of the Peripheral Self by Naturally Arising CD25+ CD4+ T Cell Receptors. Immunity. 2004;21:267–277. doi: 10.1016/j.immuni.2004.07.009. [DOI] [PubMed] [Google Scholar]
- Hubert FX, Kinkel SA, Crewther PE, Cannon PZF, Webster KE, Link M, Uibo R, O'Bryan MK, Meager A, Forehan SP, et al. Aire-Deficient C57BL/6 Mice Mimicking the Common Human 13-Base Pair Deletion Mutation Present with Only a Mild Autoimmune Phenotype. The Journal of Immunology. 2009;182:3902–3918. doi: 10.4049/jimmunol.0802124. [DOI] [PubMed] [Google Scholar]
- Hubert FX, Kinkel SA, Davey GM, Phipson B, Mueller SN, Liston A, Proietto AI, Cannon PZF, Forehan S, Smyth GK, et al. Aire regulates the transfer of antigen from mTECs to dendritic cells for induction of thymic tolerance. Blood. 2011;118:2462–2472. doi: 10.1182/blood-2010-06-286393. [DOI] [PubMed] [Google Scholar]
- Humblet C, Rudensky AY, Kyewski B. Presentation and intercellular transfer of self antigen within the thymic microenvironment: expression of the Eα peptide-l-Ab complex by isolated thymic stromal cells. International Immunology. 1994;6:1949–1958. doi: 10.1093/intimm/6.12.1949. [DOI] [PubMed] [Google Scholar]
- Joffre OP, Segura E, Savina A, Amigorena S. Cross-presentation by dendritic cells. Nat Rev Immunol. 2012;12:557–569. doi: 10.1038/nri3254. [DOI] [PubMed] [Google Scholar]
- Jordan MS, Boesteanu A, Reed AJ, Petrone AL, Holenbeck AE, Lerman MA, Naji A, Caton AJ. Thymic selection of CD4+CD25+ regulatory T cells induced by an agonist self-peptide. Nat Immunol. 2001;2:301–306. doi: 10.1038/86302. [DOI] [PubMed] [Google Scholar]
- Josefowicz SZ, Lu LF, Rudensky AY. Regulatory T Cells: Mechanisms of Differentiation and Function. Annual Review of Immunology. 2012;30:531–564. doi: 10.1146/annurev.immunol.25.022106.141623. [DOI] [PMC free article] [PubMed] [Google Scholar]
- Klein L, Kyewski B, Allen PM, Hogquist KA. Positive and negative selection of the T cell repertoire: what thymocytes see (and don't see) Nat Rev Immunol advance. 2014 doi: 10.1038/nri3667. online publication. [DOI] [PMC free article] [PubMed] [Google Scholar]
- Koble C, Kyewski B. The thymic medulla: a unique microenvironment for intercellular self-antigen transfer. The Journal of Experimental Medicine. 2009;206:1505–1513. doi: 10.1084/jem.20082449. [DOI] [PMC free article] [PubMed] [Google Scholar]
- Lee HM, Bautista JhoanneL, Scott-Browne J, Mohan JamesF, Hsieh CS. A Broad Range of Self-Reactivity Drives Thymic Regulatory T Cell Selection to Limit Responses to Self. Immunity. 2012;37:475–486. doi: 10.1016/j.immuni.2012.07.009. [DOI] [PMC free article] [PubMed] [Google Scholar]
- Lei Y, Ripen AM, Ishimaru N, Ohigashi I, Nagasawa T, Jeker LT, Bösl MR, Holländer GA, Hayashi Y, de Waal Malefyt R, et al. Aire-dependent production of XCL1 mediates medullary accumulation of thymic dendritic cells and contributes to regulatory T cell development. The Journal of Experimental Medicine. 2011;208:383–394. doi: 10.1084/jem.20102327. [DOI] [PMC free article] [PubMed] [Google Scholar]
- Lio CWJ, Dodson LF, Deppong CM, Hsieh CS, Green JM. CD28 Facilitates the Generation of Foxp3- Cytokine Responsive Regulatory T Cell Precursors. The Journal of Immunology. 2010;184:6007–6013. doi: 10.4049/jimmunol.1000019. [DOI] [PMC free article] [PubMed] [Google Scholar]
- Liston A, Lesage S, Wilson J, Peltonen L, Goodnow CC. Aire regulates negative selection of organ-specific T cells. Nat Immunol. 2003;4:350–354. doi: 10.1038/ni906. [DOI] [PubMed] [Google Scholar]
- Liston A, Nutsch KM, Farr AG, Lund JM, Rasmussen JP, Koni PA, Rudensky AY. Differentiation of regulatory Foxp3+ T cells in the thymic cortex. Proceedings of the National Academy of Sciences. 2008;105:11903–11908. doi: 10.1073/pnas.0801506105. [DOI] [PMC free article] [PubMed] [Google Scholar]
- Malchow S, Leventhal DS, Nishi S, Fischer BI, Shen L, Paner GP, Amit AS, Kang C, Geddes JE, Allison JP, et al. Aire-Dependent Thymic. Development of Tumor-Associated Regulatory T Cells. Science. 2013;339:1219–1224. doi: 10.1126/science.1233913. [DOI] [PMC free article] [PubMed] [Google Scholar]
- Mathis D, Benoist C. Aire. Annual Review of Immunology. 2009;27:287–312. doi: 10.1146/annurev.immunol.25.022106.141532. [DOI] [PubMed] [Google Scholar]
- Metzger TC, Anderson MS. Control of central and peripheral tolerance by Aire. Immunological Reviews. 2011;241:89–103. doi: 10.1111/j.1600-065X.2011.01008.x. [DOI] [PMC free article] [PubMed] [Google Scholar]
- Moran AE, Holzapfel KL, Xing Y, Cunningham NR, Maltzman JS, Punt J, Hogquist KA. T cell receptor signal strength in Treg and iNKT cell development demonstrated by a novel fluorescent reporter mouse. The Journal of Experimental Medicine. 2011;208:1279–1289. doi: 10.1084/jem.20110308. [DOI] [PMC free article] [PubMed] [Google Scholar]
- Nedjic J, Aichinger M, Emmerich J, Mizushima N, Klein L. Autophagy in thymic epithelium shapes the T-cell repertoire and is essential for tolerance. Nature. 2008;455:396–400. doi: 10.1038/nature07208. [DOI] [PubMed] [Google Scholar]
- Ohnmacht C, Pullner A, King SBS, Drexler I, Meier S, Brocker T, Voehringer D. Constitutive ablation of dendritic cells breaks self-tolerance of CD4 T cells and results in spontaneous fatal autoimmunity. The Journal of Experimental Medicine. 2009;206:549–559. doi: 10.1084/jem.20082394. [DOI] [PMC free article] [PubMed] [Google Scholar]
- Pacholczyk R, Kern J, Singh N, Iwashima M, Kraj P, Ignatowicz L. Nonself-Antigens Are the Cognate Specificities of Foxp3+ Regulatory T Cells. Immunity. 2007;27:493–504. doi: 10.1016/j.immuni.2007.07.019. [DOI] [PMC free article] [PubMed] [Google Scholar]
- Palmer E. Negative selection [mdash] clearing out the bad apples from the T-cell repertoire. Nat Rev Immunol. 2003;3:383–391. doi: 10.1038/nri1085. [DOI] [PubMed] [Google Scholar]
- Proietto AI, Lahoud MH, Wu L. Distinct functional capacities of mouse thymic and splenic dendritic cell populations. Immunol Cell Biol. 2008a;86:700–708. doi: 10.1038/icb.2008.63. [DOI] [PubMed] [Google Scholar]
- Proietto AI, van Dommelen S, Zhou P, Rizzitelli A, D'Amico A, Steptoe RJ, Naik SH, Lahoud MH, Liu Y, Zheng P, et al. Dendritic cells in the thymus contribute to T-regulatory cell induction. Proceedings of the National Academy of Sciences. 2008b;105:19869–19874. doi: 10.1073/pnas.0810268105. [DOI] [PMC free article] [PubMed] [Google Scholar]
- Román E, Shino H, Qin FXF, Liu YJ. Cutting Edge: Hematopoietic-Derived APCs Select Regulatory T Cells in Thymus. The Journal of Immunology. 2010;185:3819–3823. doi: 10.4049/jimmunol.0900665. [DOI] [PMC free article] [PubMed] [Google Scholar]
- Rudensky AY, Rath S, Preston-Hurlburt P, Murphy DB, Janeway CA. On the complexity of self. Nature. 1991;353:660–662. doi: 10.1038/353660a0. [DOI] [PubMed] [Google Scholar]
- Sawicka M, S Gretta, Reynolds Joseph, Abourashchi Niloufar, Lythe Grant, Molina-Paris Carmen, Hogquist Kristin. From pre-DP, post-DP, SP4 and SP8 thymocyte cell counts to a dynamical model of cortical and medullary selection. Frontiers in Immunology. 2014;5 doi: 10.3389/fimmu.2014.00019. [DOI] [PMC free article] [PubMed] [Google Scholar]
- Stritesky GL, Jameson SC, Hogquist KA. Selection of Self-Reactive T Cells in the Thymus. Annual Review of Immunology. 2012;30:95–114. doi: 10.1146/annurev-immunol-020711-075035. [DOI] [PMC free article] [PubMed] [Google Scholar]
- Taniguchi RT, DeVoss JJ, Moon JJ, Sidney J, Sette A, Jenkins MK, Anderson MS. Detection of an autoreactive T-cell population within the polyclonal repertoire that undergoes distinct autoimmune regulator (Aire)-mediated selection. Proceedings of the National Academy of Sciences. 2012;109:7847–7852. doi: 10.1073/pnas.1120607109. [DOI] [PMC free article] [PubMed] [Google Scholar]
- van Meerwijk JPM, Marguerat S, Lees RK, Germain RN, Fowlkes BJ, MacDonald HR. Quantitative Impact of Thymic Clonal Deletion on the T Cell Repertoire. The Journal of Experimental Medicine. 1997;185:377–384. doi: 10.1084/jem.185.3.377. [DOI] [PMC free article] [PubMed] [Google Scholar]
- Weissler KAC, Andrew J. The role of T cell receptor recognition of peptideMHC complexes in the formation and activity of Foxp3+ regulatory T cells. Immunological Reviews. 2014;259:11–22. doi: 10.1111/imr.12177. [DOI] [PMC free article] [PubMed] [Google Scholar]
- Wing K, Sakaguchi S. Regulatory T cells exert checks and balances on self tolerance and autoimmunity. Nat Immunol. 2010;11:7–13. doi: 10.1038/ni.1818. [DOI] [PubMed] [Google Scholar]
- Wong J, Obst R, Correia-Neves M, Losyev G, Mathis D, Benoist C. Adaptation of TCR Repertoires to Self-Peptides in Regulatory and Nonregulatory CD4+ T Cells. The Journal of Immunology. 2007;178:7032–7041. doi: 10.4049/jimmunol.178.11.7032. [DOI] [PubMed] [Google Scholar]
Associated Data
This section collects any data citations, data availability statements, or supplementary materials included in this article.
Supplementary Materials
Figure S1, related to Figure 1. Both BM and mTEC APCs mediate negative selection.
(A) 454 pyrosequencing of TCRs from MHC II deficient (def.) BM and C2TAkd chimeras and the corresponding controls which are wild-type (WT) for MHC expression. Chimeras were generated using TClip Tcra+/∼ (MHC II def. or WT) TCR transgenic donors. After 6 weeks, Foxp3+ (CD4+CD8-Foxp3gfp+) and Foxp3- (CD4+CD8-CD62LhiCD24loFoxp3gfp-) cells were sorted and the TCRs sequenced by 454. (B) Effect of filtering TCRs that are found > 0.1 % in at least one mouse in a given condition. Shown are plots of the total frequency captured by the filtered TCRs (left) and the average frequency in a given experimental condition of the TCRs lost by this filtering criteria in the WT -» WT Treg and Tconv repertoires (right).
Figure S2, related to Figure 2. Role of BM APCs and mTECs in thymic Treg cell selection.
(A) Distribution of NS1 and NS3 in the TCR repertoires of WT, MHC II def. BM and C2TAkd conditions. (B) NS3 is negatively selected by BM APCs. Representative FACS plots of _Rag1_-/- thymocytes retrovirally-transduced with TCR NS3 and transferred into the thymi of WT, MHC II def. BM and C2TAkd chimeric mice. Plots are representative of 2 independent experiments with 1-2 replicates. (C) Assessment of similarity between Treg and Tconv TCR repertoires using Morisita-Horn analysis. Each Treg cell data set was compared to each Tconv data set for the indicated BM chimeras. (D) Principal component analysis comparing Foxp3+ versus Foxp3– CD4SP TCR data sets from the MHC II def. BM and C2TAkd conditions (left panels, Tconv variances: MHC II def. BM = 13.6%, C2TAkd = 7.6%; Treg variances: MHC II def. BM = 60.0%, C2TAkd = 39.2%), and the corresponding WT condition (right panels, Tconv variances: MHC II def. BM = 20.2%, C2TAkd = 9.1%; Treg variances: MHC II def. BM = 47.7%, C2TAkd = 30.0%). Red and blue dots/arrows indicate TCRs enriched in Tconv and Treg subsets respectively, whereas black dots/arrow indicate TCRs that overlap both subsets. Centroids represent the middle most point of a given cluster and the shorter the line the more similar a given TCR is to that centroid. (E) Assessment of intermouse variability using Morisita-Horn similarity analysis. TCR data sets from each WT mouse was compared with every other mouse within a given APC condition and T cell subset. (F) Principal component analysis of MHC II def. BM and C2TAkd TCR repertoires (Tconv variances: PC1 = 10.3%, PC2 = 54.2%; Treg variances: PC1 = 12.0%, PC2 = 25.1%). Dots/arrows are as described in (D). (G) Amino acid sequence of the top 15 WT TCRs and their frequencies in the WT, MHC II def. BM, and C2TAkd Treg and Tconv cell data sets.
Figure S3, related to Figure 3. mTEC antigen presentation is required for in vivo Treg cell selection of certain TCRs.
(A) Morisita-Horn similarity analyses between TCR repertoires of control WT -» WT BM chimeras in the MHC II def. -» WT and WT -» C2TAkd chimera experiments in Figure 3B. (B) As summarized in Figure 3C, TCRs dependent on autologous mTEC presentation for Treg cell selection (R25, G32) were retrovirally expressed in Rag1∼/∼ thymocytes and intrathymically injected into WT or C2TAkd hosts. After 2.5 weeks, thymi were analyzed by flow cytometry. Plots shown are gated on CD45 congenic markers, Va2+ and CD4SP for TCR expressing cells, and are representative of 3-4 replicates.
Figure S4, related to Figure 4. DCs are the primary BM APC subset involved in Treg cell selection.
(A) Analysis of BM APC-dependent Treg TCR G41 in vivo. Data shown are FACS plots of G41 expressing _Rag1_–/– thymocytes after intrathymic injection into WT, MHC II def. BM, and C2TAkd chimeric mice. Plots are representative of 2-3 replicates from 2 independent experiments. ***p < .001, Mann-Whitney U. (B) Clonal frequency plots after intrathymic injection of _Rag1_–/– thymocytes retrovirally-transduced with the indicated Treg TCRs for the experiments in Figure 4. Data shown represent the percentage of transferred compared to the total CD4SP population. Black dots represent WT hosts, blue dots represent C2TAkd hosts, and red dots represent CD11c-Cre ROSA-DTA hosts.
Figure S5, related to Figure 5. Aire selects a subset of thymic Treg cells.
(A) Summary of TCR sequences obtained from WT versus Aire-/- fixed TCRp mice. (B) Morisita-Horn similarity analysis between Treg and Tconv TCRs from WT and Aire-/- mice. (C) Principal component analysis of TCR frequencies between WT and Aire-/- mice (WT variances: PC1 = 15.2%, PC2 = 26.8%; Aire-/- variances: PC1 = 13.2%, PC2 = 44.9%) (D) Principal component analysis of the TCR frequencies between _Aire_-/- and WT mice for the indicated subset (Tconv variances: PC1 = 15.2%, PC2 = 26.8%; Treg variances: PC1 = 13.2%, PC2 = 44.9%). (E) Morisita-Horn similarity analysis between control WT(x00302) WT BM chimera Treg TCR repertoires from the _Aire_-/- and MHC II def. -> WT as well as WT (x00302) C2TAkd chimeric experiments in Figure 5D. (F) Representative FACS plots of Rag1-/- thymocytes retrovirally-transduced with indicated Treg TCRs and injected into Aire-/- hosts for the experiments summarized in Figure 5F. Data are representative of at least 2 independent experiments with 1-3 replicates per experiment.
Figure S6, related to Figure 6. CD8α+ DCs preferentially acquire and present Aire-dependent antigens to developing Treg cells.
(A) FACS plots of CD8α+ and SIRPa+ DCs from the thymi of Batf3+/∼ or _Batf3_-/- mice. Plots are representative of 4 replicates. (B) FACS plots after intrathymic injection of _Rag1_-/- thymocytes retrovirally-transduced with the indicated TCRs into _Batf3_-/- mice for the experiments summarized in Figure 6A. Plots are representative of at least 2 experiments with 1-3 replicates per experiment. (C) FACS plots of B220+ CD11c+ MHC II+ plasmacytoid DCs from _CLEC4C_-HBEGF mice treated with PBS or DT. Plots are representative of 3 replicates.