Leptin regulates the reward value of nutrient (original) (raw)
. Author manuscript; available in PMC: 2014 Nov 20.
Published in final edited form as: Nat Neurosci. 2011 Nov 13;14(12):1562–1568. doi: 10.1038/nn.2977
Abstract
We developed an assay for quantifying the reward value of nutrient and used it to analyze the effects of metabolic state and leptin. In this assay, mice chose between two sippers, one of which dispensed water and was coupled to optogenetic activation of dopaminergic (DA) neurons and the other of which dispensed natural or artificial sweeteners. This assay measured the reward value of sweeteners relative to lick-induced optogenetic activation of DA neurons. Mice preferred optogenetic stimulation of DA neurons to sucralose, but not to sucrose. However, the mice preferred sucralose plus optogenetic stimulation versus sucrose. We found that food restriction increased the value of sucrose relative to sucralose plus optogenetic stimulation, and that leptin decreased it. Our data suggest that leptin suppresses the ability of sucrose to drive taste-independent DA neuronal activation and provide new insights into the mechanism of leptin's effects on food intake.
Dieting is widely prescribed as a therapy for obese individuals, but long-term compliance is low, partly as a result of the high reward value of palatable nutrients such as sugars1–5. In humans, the reward value of food is usually assessed using a subjective rating scale for ‘liking’. Assays of liking in animals are limited by the fact that they cannot verbally report their ratings. Instead, measures of liking in rodents have been made by subjective monitoring of orofacial expressions, analogous to studies of human infants6. As an alternative to this method, we implemented a choice assay that measures preference for a nutrient versus a reference stimulus in which ingestion of water (or solutions of sweeteners) induces optogenetic stimulation of DA neurons. In this assay, changes in preference relative to this reference stimulus reflect changes in the reward value of the ingested agent7–10. We used this assay to analyze the effects of changes in metabolic state on the reward value of sucrose in animals that were fasted or received leptin.
Leptin is an adipose tissue hormone that functions as an afferent signal in a negative feedback loop that maintains homeostatic control of adipose tissue mass and reduces food intake11. Leptin- deficient individuals report higher liking ratings for food, and leptin replacement therapy normalized liking ratings even before weight loss was achieved12. However, the net effect of leptin on DA signaling is unclear. Leptin receptors are expressed in DA and GABAergic neurons in the ventral tegmental area (VTA)13,14, and supra-physiological doses of leptin in anesthetized rats were reported to reduce extracellular firing in the VTA, including identified DA neurons (1,660 g ml−1)14. Although this study concluded that leptin acts pharmacologically to suppress the activity of these pathways, another study reported that leptin increased tyrosine hydroxylase levels and enhanced sensitization to amphetamine, suggesting an excitatory role of leptin on reward pathways13. We used our assay for quantifying the value of nutrient to study the contributions of taste and post-ingestive effects to nutrient preference under different metabolic conditions, including leptin treatment.
RESULTS
To couple DA activation to ingestive behavior, we directed the expression channelrhodopsin-2 (ChR2) to DA neurons of the midbrain15. We injected a Cre-inducible adeno-associated virus carrying the gene encoding ChR2 fused to mCherry (AAV-DIO–ChR2-mCherry). The nonrecombined construct is in the antisense orientation and is not expressed. Cre-mediated recombination activates ChR2-mCherry expression16. AAV-DIO–ChR2-mCherry virus was injected stereotactically into the VTA of Dat-cre mice16. The specificity of ChR2-expression in DA neurons was confirmed using immunohistochemistry, which revealed colocalization of mCherry and tyro-sine hydroxylase. Transduction efficiency averaged ~70% of tyrosine hydroxylase–positive neurons expressing channelrhodopsin-2 (Fig. 1a). We next implanted an optical fiber into the VTA region of Dat-cre; AAV-DIO–ChR2-mCherry mice (Fig. 1b and Supplementary Fig. 1). To verify optogenetic activation of neurons in this region, we measured opto–functional magnetic resonance imaging (ofMRI)17 signals with a 7 T MRI scanner (see Online Methods). ofMRI activation maps of ChR2-expressing mice revealed an optogenetic blood oxygen level–dependent (BOLD) effect, mainly surrounding the tip of the fiber, in the VTA (correlation coefficient R > 0.35, P < 10−16), but not in control mice that did not express ChR2 (**Fig. 1c**). The BOLD signal was steady across sequential stimulus interval onsets (average across 14 repetitions, _n_ = 3) and across mice (across 28 repetitions, _n_ = 3; **Fig. 1d**) in all of the active voxels in the main cluster surrounding the tip of the fiber. Secondary activation in other areas was also observed elsewhere when using a lower significance threshold (_R_ > 0.1, P < 2 × 10⁻⁵ (data not shown)). Finally, optogenetic DA neuron activation was also confirmed using immunohistochemistry; increased nuclear c-Fos was evident in optogenetically stimulated neurons in Dat-cre; Rosa26-YFP mice injected with AAV-DIO–ChR2-mCherry (Dat-cre; Rosa26-YFP; AAV-DIO–ChR2-mCherry; Supplementary Fig. 2).
Figure 1.

Optogenetic activation of DA neurons. (a) AAV-DIO–ChR2-mCherry injection into Dat-cre mice led to ChR2-mCherry expression in VTA neurons colocalizing with tyrosine hydroxylase (TH), a marker for DA neurons. Scale bars represent 1 μm. (b) Optical fibers implanted above the VTA for photoactivation of DA neurons. (c) ofMRI activation in ChR2-expressing (top) and control (bottom) mice, near the fiber tip. Red to yellow colors indicate correlation coefficients. Scale bars represent 1 mm. (d) The ofMRI signal was steady across sequential stimulus onsets (top, average across 14 repetitions) and across mice (bottom, n = 3), in all of the active voxels in the main cluster located near the end tip of the fiber. Error bars show error of the mean, in percentage of baseline signal activity (see Online Methods). Scale bars represent 1 mm.
Implanted mice were then placed into a chamber in which each lick was recorded from a port dispensing liquid (sipper) and coupled to the laser such that five licks triggered a 1-s-long laser pulse to activate ChR2 through the optical fiber (Fig. 2). This protocol was designed to mimic the tonic increases in dopamine observed during sustained sucrose intake18. When licks were coupled to light emission, mice showed a marked increase in licking behavior. On average, ChR2-expressing mice (n = 2) with the laser on licked the sipper 904.2 times in 1 h versus 225.2 times in control mice (n = 2) (ANOVA, P < 0.041; Fig. 2b). There was a marked difference in the responses of ChR2-expressing and control mice (Fig. 2a). An example ChR2-expressing mouse licked the water sipper 1,815 times in 2 h, which is a 17-fold increase compared with a representative control mouse (Fig. 2a**). This effect of the laser was not observed in control mice or in ChR2-expressing mice assayed with the laser off (P > 0.15, ANOVA Tukey-Kramer post hoc comparison; Fig. 2b). The effect of the laser was also lost on blockade of DA transmission (Supplementary Fig. 3**).
Figure 2.
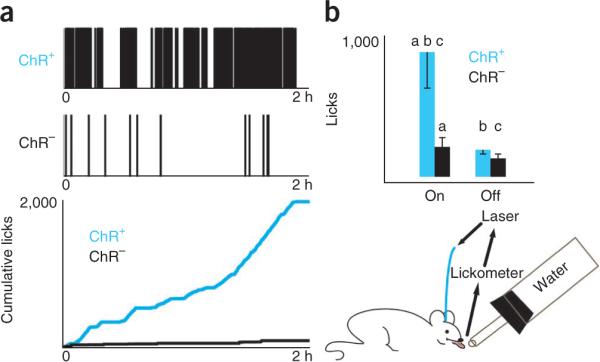
The optogenetic licking assay drives voluntary ingestion in nondeprived mice. (a) Drinking behavior was monitored using a contact lickometer, which is connected to a laser switch. The switch was activated for 1 s after every five licks. Single-animal data obtained during a 2-h session are shown. Top, a lick raster plot for a ChR2-expressing mouse (ChR2+, 1,815 licks, top raster) and a control mouse (ChR−, 101 licks, bottom raster). Bottom, cumulative lick count throughout a 2-h session for both mice. (b) In 1 h, nondeprived ChR2-expressing mice with the laser on (n = 22) licked the spout 904.2 ± 265 times versus 225.2 ± 58 times for control mice (ANOVA, P < 0.041; pairs of letters indicate significant pairs using Tukey-Kramer _post hoc_ comparison). The effect was not observed in control mice (_n_ = 14, 2 mice) assayed with the laser on or in control mice assayed with the laser off (_n_ = 20) (_P_ > 0.15, ANOVA Tukey-Kramer post hoc comparison).
The behavioral assay was next modified such that, over a 10-min interval, mice had a choice of two sippers, one of which coupled licks of water to laser activation and the other of which contained natural or artificial sweeteners (Fig. 3). This assay provides a means for comparing the value of ingested liquids relative to that conferred by optogenetic activation of DA neurons that serve as the reference stimulus. We first coupled water to activation of DA neurons at one sipper and provided competing sucrose at different concentrations in the other sipper (Fig. 3). The sucrose concentrations that were chosen were in the dynamic range for its behavioral effects and were also capable of increasing blood glucose concentration under the experimental conditions that we used (Supplementary Figs. 4–6).
Figure 3.
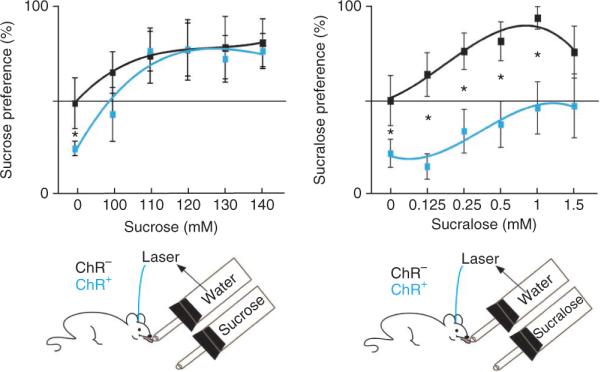
Sucrose has higher value than sucralose. ChR2-expressing (n = 5) and control (n = 4) mice were given a choice between either water and laser or sucrose (or sucralose) for 10 min. At baseline (0 mM), ChR2-expressing mice (n = 21) showed a high preference for water and laser activation (70 ± 3%), as compared with control animals (50 ± 2%, n = 23). *P < 0.05. Left, sucrose was preferred at all concentrations to water and laser. ChR2-expressing and control mice had similar preference scores (all _P_ > 0.13). Preference scores among ChR2-expressing mice were significantly different from baseline (P < 0.05 for 100 mM and P < 0.008 for 110–140 mM). Right, ChR2-expressing mice were given a choice between either sucralose or water and laser. Coupling laser to water significantly shifted an animal's preference away from sucralose, which was not observed in control animals (P < 0.002 for 0.125 mM, P < 0.0056 for 0.25 mM, P < 0.0095 for 0.5 mM, P < 0.0032 for 1 mM). Error bars represent s.e.m.
At 0 mM sucrose, ChR2-expressing mice prefer water and laser, scoring 28.4 ± 4.3% preference for the non-laser sipper (water), which was significantly different from that of control mice (n = 4) (47.1 ± 6.8%, P < 0.013, two sample t test). This bias toward the laser side decreased as sucrose was added to the opposite sipper. For 100 mM sucrose, ChR2-expressing mice (n = 5) showed a 44.4 ± 10% preference for water and laser, which was significantly different from baseline (P < 0.05, t test). At higher concentrations, 110 mM, 120 mM, 130 mM and 140 mM, ChR2-expressing mice further shifted preference toward the sucrose (P < 0.008, P < 0.004, P < 0.0012 and P < 0.00035, respectively). Both ChR2-expressing and control mice showed a significant preference for the sucrose sipper despite the fact that the other sipper was coupled to laser activation of DA neurons (P < 0.05, bootstrap-based t test for all concentrations, except 100 mM). These results indicate that the value of sucrose was higher than that of optogenetic DA stimulation (Fig. 3). In contrast, the same ChR2-expressing mice still showed preference for water and laser when sucralose was provided as an alternative at the second sipper (0.125 mM sucralose: ChR2-expressing, 22.9 ± 5.2%; control, 57 ± 9.1%; P < 0.002; 0.25 mM sucralose: ChR2-expressing, 37.4 ± 9%; control, 70 ± 7.9%; P < 0.0056; 0.5 mM sucralose: ChR2-expressing, 40.2 ± 9.4%; control, 72.2 ± 8.2%; P < 0.0095; 1 mM sucralose: ChR2-expressing, 47 ± 10.8%; control, 85.3 ± 4.4%; P < 0.0032, two sample t test; Fig. 3). Although we noted a tendency of animals to take fewer total licks at the end versus the start of the dark cycle, this preference was maintained in all of the experiments, irrespective of the total number of licks that were produced (Supplementary Figs. 7 and 8). These results establish that the concentrations of sucralose that we tested have a lower value than that of optogenetic stimulation of DA neurons, which in turn has lower value than sucrose.
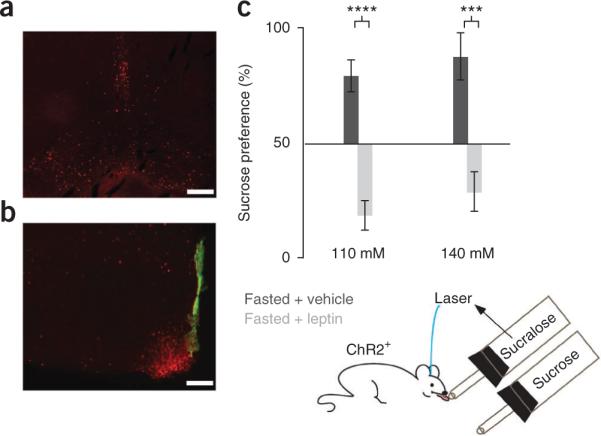
The assay was next configured such that mice were given a choice between sucralose and laser at one sipper versus sucrose at the other (Fig. 4). To avoid saturation of taste receptors by high doses of sweeteners, we selected sucrose and sucralose concentrations in the dynamic range of the dose response curves (Fig. 3 and Supplementary Fig. 4). ChR2-expressing mice (n = 5) showed a significant preference for sucralose and laser as compared with sucrose. We observed that control mice (n = 4) preferred 110 mM sucrose and 140 mM sucrose to 0.5 mM sucralose and laser (72 ± 12% and 90 ± 3% preference ratios, respectively), whereas ChR2-expressing mice showed a highly significant preference for sucralose and laser (13 ± 5% and 16 ± 7% sucrose preference, respectively; P < 0.0000007; Fig. 4 and Supplementary Fig. 9). Note that sucralose alone, even at much higher concentrations, was never preferred to sucrose (Supplementary Fig. 4), indicating that optogenetic stimulus was required to shift an animal's preference from sucrose to sucralose. Previous studies have suggested that the preference for sucrose versus sucralose is a result of its post-ingestive effect to increase dopamine release in forebrain18. This is consistent with our finding that laser activation of DA neurons can change an animal's preference from sucrose to sucralose. We next tested whether this change in preference was correlated with a change in DA neuronal activity by measuring the levels of nuclear c-Fos. Dat-cre;Rosa26-YFP mice injected with AAV-DIO–ChR2-mCherry (Rosa26-YFP; AAV-DIOChR2-mCherry) were given either sucrose (140 mM) or sucralose (0.5 mM) plus optogenetic stimulation for 10 min, and nuclear c-Fos/YFP immunohistochemistry was performed (see Online Methods). Sucralose and laser resulted in a significantly greater number of neurons with colocalization of Nu-c-Fos and YFP than did sucrose, sucralose alone, or water and laser (sucralose and laser, sucrose, sucralose, and water and laser activated, respectively, 34.2 ± 3, 14 ± 2, 14.8 ± 2 and 11.8 ± 1 DA neurons per 512 pixel2, n = 5, P < 0.0005; Fig. 4b).
Figure 4.
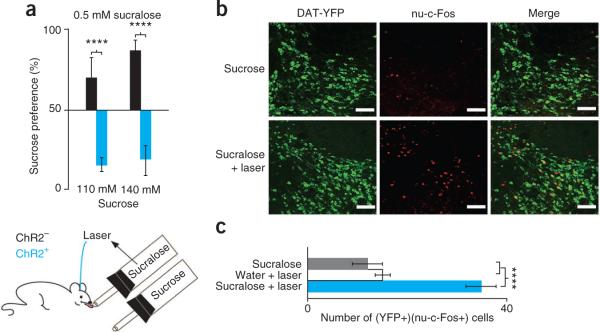
Optogenetic activation of DA neurons reverses the preference of sucrose over sucralose and elicits activation of DA neurons. (a) Control (n = 4) and ChR2-expressing (n = 5) mice were given a choice between either sucrose or sucralose and laser (bottom). Control mice preferred 110 mM and 140 mM sucrose to 0.5 mM sucralose and laser (sucrose, 72 ± 12%, n = 6; sucralose, 90 ± 3%, n = 5; black bars), but ChR2-expressing mice preferred the reverse, with sucrose preference ratios of 13 ± 12% for 110 mM and 16 ± 7% for 140 mM (n = 9, blue bars). (b) Colocalization of nuclear c-Fos (nu-c-Fos) and YFP in Dat-cre; Rosa26-YFP mice revealed that sucralose and laser (34.2 ± 3 DA neurons per 512 pixel2) activated more DA neurons than sucrose (14 ± 2 DA neurons per 512 pixel2) (n = 5). Scale bars represent 20 μm. (c) Sucralose and laser activated more DA neurons than either sucralose (14.8 ± 2 DA neurons per 512 pixel2) or water and laser (11.8 ± 1 DA neurons per 512 pixel2) (n = 5). ****P < 0.0005. Error bars represent s.e.m.
We next assayed whether changes in metabolic state, including leptin levels, can modulate an animal's preference for sucrose versus sucralose and laser (Fig. 5 and Supplementary Fig. 10). ChR2-expressing mice (n = 6) were food deprived for 24 h and treated with either vehicle or leptin (2 mg per kg of body weight)15. In contrast with fed mice, vehicle-treated fasted mice preferred sucrose (85 ± 4% and 93 ± 3% preference for 110 mM and 140 mM sucrose, P < 0.0001), indicating that fasting is associated with an increase in the value of sucrose compared with sucralose and laser. In contrast, the fasted mice that were treated with leptin showed 22 ± 7% preference for 110 mM sucrose (_P_ < 0.0001) and 31 ± 11% preference for 140 mM sucrose (_P_ < 0.0003), indicating that leptin reversed the preference of fasted mice for sucrose. Indeed, the preference for 0.5 mM sucralose and laser versus sucrose was indistinguishable between the free fed group and the fasted group that was treated with leptin, indicating that the effect of fasting to increase sucrose preference in this assay is likely mediated by the fall in plasma leptin that accompanies a fast (110 mM, _P_ > 0.35; 140 mM, P > 0.22).
Figure 5.
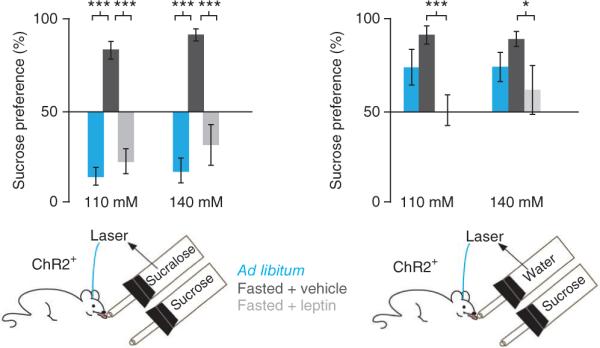
Fasting increases the value of sucrose, and leptin reverses this effect. ChR2-expressing mice (n = 6) were fasted for 24 h and treated with leptin (gray bars) or vehicle (black bars). Left, fasted animals, injected with vehicle, preferred 110 mM and 140 mM sucrose to sucralose and laser, with sucrose preferences of 85 ± 4% and 93 ± 3%, respectively. Fasted mice injected with leptin (2 mg per kg) displayed 22 ± 7% preference for 110 mM sucrose and 31 ± 11% preference for 140 mM sucrose. Preference for 0.5 mM sucralose and laser in the ab libitum and leptin-treated groups were not significantly different (P > 0.35 for 110 mM and P > 0.22 for 140 mM) (blue bars, as in Fig. 4). Right, vehicle-treated fasted mice preferred 110 mM and 140 mM sucrose to water and laser (85 ± 6% and 83 ± 3%, respectively). Leptin-treated fasted mice had reduced preference for sucrose (110 mM, 51 ± 7%; 140 mM, 60 ± 8%). ***P < 0.0035, *P < 0.018. Error bars represent s.e.m.
We next tested the effect of leptin in fasted ChR-expressing animals given a choice between laser alone versus sucrose. The preference for laser and sucrose was still evident in leptin-treated fasted mice, even when sucralose was replaced with water (Fig. 5). Vehicle-treated fasted mice preferred 110 mM and 140 mM sucrose to water and laser (85 ± 6% and 83 ± 3%, respectively; Fig. 5 and Supplementary Fig. 10). Leptin-treated animals showed a reduced preference for sucrose versus water and laser (110 mM, 51 ± 7%, P < 0.0035; 140 mM, 60 ± 8%, _P_ < 0.018 compared with the fasted controls). These preference ratios for sucrose are equivalent (_P_ > 0.5) to those of sucralose in mice fed ab libitum (see Fig. 3), which is consistent with the possibility that leptin reduces the rewarding post-ingestive effect of sucrose.
The changes in preference that resulted from fasting or leptin treatment were correlated with change in the activity of DA neurons as assayed by staining for c-Fos. Dat-cre; Rosa26-YFP; AAV-DIO–ChR2-mCherry mice were given 140 mM sucrose or 0.5 mM sucralose and laser for 10 min, and sections were stained for nuclear c-Fos and YFP (see Online Methods and Supplementary Fig. 11). Quantification of nuclear c-Fos and YFP colocalization revealed that sucrose activated significantly more DA neurons in fasted mice than in mice fed ad libitum (sucrose, 49.4 ± 4 DA neurons per 512 pixel2; sucralose and laser activated, 34.8 ± 4 DA neurons per 512 pixel2; n = 5, P < 0.0153; Supplementary Fig. 11). Conversely, in leptin-treated mice that were fasted, sucrose resulted in a significantly lower number of DA neurons that expressed c-Fos compared with similar analyses of mice given sucralose and laser (sucrose, 11.8 ± 2 DA neurons per 512 pixel2; sucralose and laser activated, 32 ± 2 DA neurons per 512 pixel2; n = 5, P < 0.00011; Supplementary Fig. 11). We also found that the effect of optogenetic activation of DA neurons by licking was similar in all of the different groups (Supplementary Fig. 11). These findings suggest that changes in the activity of DA neurons are responsible for the effects of leptin and fasting on nutrient preference.
However, as leptin receptor expression has been reported on taste buds, we directly tested whether these behavioral effects of leptin were centrally mediated19 (Fig. 6). A cannula was implanted in the lateral ventricle, ipsilateral to the optic fiber (Supplementary Fig. 1). Leptin was acutely injected intracerebroventricularly at doses (100 ng in 2 μl of vehicle/FlouroSpheres) that were previously shown to substantially reduce daily food intake in rodents14. In mice, this dose of leptin decreased food intake by 48% (P < 0.02). We confirmed leptin's action in the hypothalamus and VTA by immunostaining for phosphorylated Stat3, a marker of leptin bioactivity (Fig. 6a,b). Mice (n = 6) were food deprived for 24 h and assayed 1 h after injection of leptin or vehicle. Leptin and vehicle groups (n = 3 each) were reversed 2 d later and the results were pooled. The results replicated those for peripheral injections (Fig. 5). Vehicle-treated fasted mice preferred 110 mM and 140 mM sucrose (77 ± 6% and 85 ± 9%, respectively), whereas leptin-treated fasted mice showed a preference for 0.5 mM sucralose and laser, similar to ad libitum fed mice. When given a choice between 0.5 mM sucralose and laser versus sucrose, the leptin-treated mice showed a 22 ± 6% preference for 110 mM sucrose (P < 0.0001) and 31 ± 8% preference for 140 mM sucrose (P < 0.0012) (Fig. 6c and Supplementary Fig. 12).
Figure 6.
Leptin corrects the fasting-induced increase in the value of sucrose via the CNS. (a,b) Acute intracerebroventricular injection of 100 ng of leptin leads to Stat3 phosphorylation in the VTA (a) and hypothalamus (b). Fluorospheres (green) labeled the third ventricle. Scale bars represent 100 μm. (c) We assayed mice (n = 6) for their preference for sucrose 1 h after leptin (light gray bars, right) or vehicle injection (dark gray bars, right). Vehicle-treated fasted mice preferred sucrose (110 mM, 77 ± 6%; 140 mM, 85 ± 9%), but leptin-treated fasted mice do not (110 mM, 22 ± 6%; 140 mM, 31 ± 8%). ****P < 0.0001, ***P < 0.0035. Error bars represent s.e.m.
Finally we tested whether leptin modulated the post-ingestive effect of sucrose to activate DA neurons by delivering sucrose directly into the stomach18,20 (Fig. 7). Fasted Dat-cre; Rosa26-YFP mice treated with either leptin (2 mg per kg, intraperitoneal) or vehicle were given 0.5 ml of 30% sucrose by gavage to specifically elicit the post-ingestive effect of sucrose independently of the activation of oral taste receptors. Immunohistochemistry for nuclear c-Fos and YFP (Fig. 7) revealed that leptin reduced the level of DA neuron activation by intragastric sucrose (leptin, 10.4 ± 2 DA neurons per 512 pixel2; vehicle, 48.6 ± 4 DA neurons per 512 pixel2; n = 5, P < 0.00005; Fig. 7**). In these studies, blood glucose levels were increased by gavage, but the plasma glucose levels were similar in the vehicle- and leptin-treated groups (214 ± 16 and 185 ± 21 mg dl−1, P > 0.14) and in animals gavaged with the same volume of water (Supplementary Fig. 13**).
Figure 7.
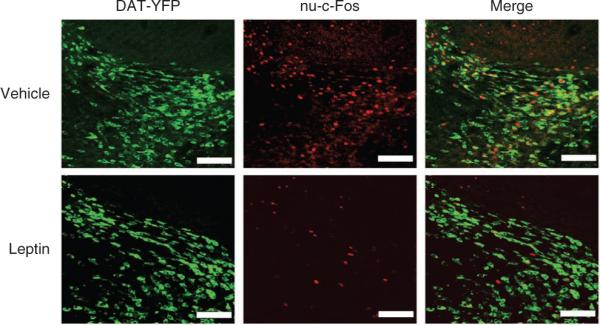
Leptin supresses post-ingestive sucrose-induced DA neuron activation. Fasted Dat-cre; Rosa26-YFP mice were gavaged with 0.5 ml of 30% sucrose 1 h after an intraperitoneal injection of leptin or vehicle, and analyzed after 20 min. Colocalization of nuclear c-Fos and YFP revealed that leptin reduced DA neuron activation in response to sucrose. Scale bars represent 20 μm.
DISCUSSION
We developed a murine choice assay that quantifies the value of nutrients and used it to show that leptin regulates the reward (hedonic) value of sucrose (Supplementary Fig. 14). This assay is complementary to other assays of the value of nutrient in animals6,21,22. We also found that leptin reduced the post-ingestive effect of sucrose and report, to the best of our knowledge, the first ofMRI of DA neurons.
Theories of the valuation of food dissociate ‘wanting’ and liking into separate, although interconnected, dimensions of reward23. Although liking is measured by using a subjective rating scale in humans, no such self-reporting methods can be applied to animal studies. In fact, currently available assays of liking in animals use indirect measures such as orofacial expressions6. Wanting, on the other hand, is quantified by progressive ratio schedules of reinforcement, a method that is widely used in both human and animal studies22. In the progressive ratio task, the subject triggers an increasing number of operant responses for reward. The number of responses triggered to obtain reward is an index of the willingness to work for food23,24. According to these theories, dopamine is involved in attributing incentive salience to reward-related stimuli, being primarily involved in wanting rather than liking23,25. However, the observation that neuroleptics cause anhedonia has suggested that dopamine may also be involved in liking25,26. Thus, the precise mechanism of dopamine action on reward is unclear, despite the fact that it is known to be important in many different behaviors. To address this issue and further study the effect of metabolic state on reward, we created an experimental system in which we can control dopamine activation as an independent variable using optogenetics, thereby allowing us to quantitate its effects on behavior. Our data indicate that dopamine can alter an animal's preference for nutritive versus non-nutritive sweeteners and that this effect can be modulated by changes in metabolic state, such as fasting and leptin treatment.
Previous studies have shown that leptin can modulate reward, and our results are consistent with these reports. In one such study, leptin's effects on reward were assayed using progressive ratio schedules associated with electrical intracranial self-stimulation (ICSS) of the lateral hypothalamus, rather than the midbrain, which was the focus of our study27. However, as ICSS lacks cellular resolution, the cell type on which leptin exerted its effect remains unknown. In addition, leptin's effects on ICSS were still evident in obese rats lacking functional leptin receptors28. Another study reported that leptin reduces the reward value of sucrose as measured by progressive ratio schedules and conditioned place preference tasks associated with food, both of which assay wanting food21,29. Although this study revealed that leptin could alter an animal's motivation to work for food, the study was not designed to assay the value of nutrient independently of motivational state, as our study did. It has been suggested that assays of licking microstructure can reveal changes in reward. However, this is not always the case, as neuroleptic drugs, such as PCP, cause anhedonia in humans, but do not change lick microstructure during sucrose intake in animals, at doses that do not cause motor impairment30. The design of our choice assay is based on the neuroeconomic principle that, if animals choose between two options that require the same of work, the option chosen provides a measure of the value of that option9,31,32. Such symmetric choice tasks are invariant to drifts in task engagement, such as circadian influence (Supplementary Fig. 8), as well as pharmacological and surgical interventions that reduce motor output or alter overall motivational state. It therefore provides a robust measure of the reward value of ingested nutrients.
We used this optogenetic preference assay to measure the reward value of sucrose in mice under different metabolic conditions. We found that food deprivation, which lowers serum leptin levels, increased the value of sucrose, a finding that is consistent with studies of human preferences after weight loss with or without leptin treatment1,4,12. Taken together with these human studies, our data suggest that leptin reduces the activation of DA neurons by sucrose in the midbrain. Two previous studies of leptin in animals reported conflicting data with respect to leptin's effects on DA signaling in the midbrain. One group showed that leptin reduced the firing rate of DA neurons, suggesting that leptin reduced DA transmission, whereas an independent study reported that leptin increased amphetamine sensitization, consistent with leptin augmenting DA transmission13,14. Although both studies found that a subpopulation of DA neurons express the leptin receptor, neither showed a functional effect of leptin on the reward value of nutrient. Our data provide functional evidence that leptin modulates the (hedonic) reward value of sucrose and that this modulation is correlated with a leptin's ability to reduce the post-ingestive effect of sucrose on the activity of DA neurons. Our experiments employing ventricle brain infusions of leptin also confirmed that this effect is centrally mediated rather than by peripheral taste organs, where leptin receptor expression has also been reported19. However, although our data showing changes in c-Fos immunoreactivity in DA neurons after leptin treatment strongly suggest that leptin decreases the post-ingestive effects of sucrose, leptin's effects are unlikely to be limited to DA modulation, and may include effects of this hormone on orofacial sensation and other neural pathways.
The biological mechanisms underlying an animal's preference for natural sugars versus artificial sweeteners such as sucralose (at comparable concentrations regimes; Supplementary Fig. 4a–c)33–40 are poorly understood. This preference does not appear to be a result of differential activation of taste receptors41, as both sugars and artificial sweeteners can be adjusted in concentration to activate T1R2/T1R3 receptors with equivalent potency42 to recreate equivalent sweetness ratings33–40 (Supplementary Fig. 4a–c). Even if, as has been suggested, artificial sweeteners also interact at low affinity with bitter receptors, taste-blind animals still prefer sucrose to sucralose18,41,43,44, suggesting that animals can sense sucrose independently of taste. This preference for sucrose is a result of what is referred to as its post-ingestive effect, by which the caloric value, possibly ATP content, of nutrient is sensed. Sucrose intake quickly led to an increase in blood glucose (Supplementary Fig. 6c), which is correlated with dopamine release18. The rapid post-ingestive effect of sucrose is of clinical importance in humans, where 1 cup of 143 mM sucrose solution (1 spoon in 1 cup) is routinely used as an emergency treatment for hypoglycemia (http://www.ncbi.nlm.nih.gov/pubmedhealth/PMH0001423/). This dose of sucrose is capable of suppressing the signs and symptoms of hypoglycemia, whereas sucralose does not. An equivalent amount of sucrose was ingested in our studies, which, according to some simple calculations and assumptions based on comparative sizes, equals approximately 60 licks of a 143 mM solution (this is less than the average amount of sucrose animals ingested during the testing period, see Supplementary Fig. 6a for the relevant calculations).
Although animals and humans are capable of adjusting glucose intake according to physiological state, the precise anatomic sites at which this sensing takes place remain unknown. The linking of hypoglycemia to a specific behavior can be learned, as evidenced by the fact that diabetic individuals often consume juice with sucrose when they note symptoms of hypoglycemia. However, the behavioral effects of decreased glucose concentration do not necessarily require prior experience linking low blood glucose to specific behaviors, suggesting that the behavioral response to glucoprivation is innate. For example, a single injection of 2-deoxyglucose, a non-metabolizable glucose competitor, is sufficient to induce robust increases in food intake in several strains of mice (independent of previous experience associating food pellets with glucoprivation45). A single injection of 2-deoxyglucose is also sufficient to induce substantial increases in licks for glucose in sweet-blind mice that have never received this drug, indicating that the effect is not dependant on taste3. Instead, data suggest that nutrient-sensing mechanisms can be linked to behavioral responses in animals that cannot taste and had never previously received 2-deoxyglucose. These findings suggest that the lack of preference for artificial sweeteners derives from a lack of a post-ingestive effect with concomitant DA activation, which natural sugars provide. This predicts that the combination of ‘pure’ taste (sucralose) plus dopamine release should mimic the effects of sucrose, which activates both pathways. We tested this hypothesis by combining optogenetic activation of DA neurons with the sweet taste of sucralose and found that optogenetic activation of DA neurons synergizes with the taste of sucralose, creating a stimulus with higher value than sucrose.
In summary, our optogenetic assay provides a new platform for dissecting the neural circuitry representing the reward value of ingested nutrients and the mechanisms by which changes in metabolic state can alter the value of food. This assay is generally applicable and can be used to establish the reward value of other nutrients and the effects of other hormones46 or drugs. Using this assay, we found that fasting increased and leptin reduced the reward value of sucrose via a reduction in DA signaling, establishing a role for this hormone in the regulation of food reward. These findings add important new information about the mechanism of leptin action and its effect on the reward value of nutrient.
ONLINE METHODS
Animals and virus
Dat-cre mice were donated by N.-G. Larsson (Karolinska Institutet)16. The mice shown in Figure 2 were of 129/C57BL6 mixed background, and C57BL/7 otherwise. Mice were single housed and maintained under an inverted 12 h light-dark cycle. Experimental protocols were approved both by the John B. Pierce Laboratory and Rockefeller University Institutional Animal Care and Use Committees and met the guidelines of the US National Institutes of Health guide for the Care and Use of Laboratory Animals. AAVDIO–ChR2mCherry vectors have been described elsewhere16.
Surgeries
Surgical procedures were as described previously16, with modifications. We delivered ~0.5 μl of AAV virus through a pulled-glass pipette and a pressure micro-injector (Toohey). The fiber optic (Thorlabs) was chronically implanted and secured with dental cement (Lang). Control mice were treated the same way as Chr2-expressing mice, but were injected with phosphate-buffered saline (PBS). For the dual implants, procedures were as above, but before implanting the fiber, a canula (PlasticsOne) was secured in the right lateral ventricle.
Immunohistochemistry
Dat-cre mice transduced with AAV-DIO–ChR2-mCherry virus were perfused transcardially with PBS followed by 10% formalin (wt/vol, Sigma). The brains were post-fixed by 10% formalin overnight at 4 °C; 50-μm brain slices were collected with a vibratome and blocked with 2% normal goat serum (vol/vol) and 0.1% Triton X-100 (vol/vol). DA cell bodies and fibers were marked with rabbit antibody to tyrosine hydroxylase (1:1,000, Pel-Freez #P40101)16. For c-Fos immunohistochemistry in Dat-cre; Rosa26-YFP; AAVDIO–ChR2-mCherry mice, perfusion and slicing was carried out as described above; a subset of slices was incubated in 1% H2O2/1% NaOH (vol/vol) for 10 min to quench mCherry fluorescence. Blocking was carried out as described above, and labeling was done with rabbit antibody to c-Fos and chicken antibody to GFP (1:1,000, Santa Cruz L1809 and Abcam 13970-100). For Stat3 immunoreactivity, animals were injected intracerebroventricularly with 100 ng of murine leptin (Amgen, 2008067H7) and killed 1 h later. Sections were treated with 1% H2O2/1% NaOH for 10 min, 0.3% glycine (wt/vol) in PBS for 10 min, and 0.03% SDS (vol/vol) in PBS for 10 min. Sections were blocked (PBS containing 0.1% Triton X-100, 2% goat serum, 3% bovine serum albumin (vol/vol)) for 1 h, and stained for 48 h at 4 °C with Phospho-Stat3 (Tyr705) antibody (#9131, Cell Signaling, 1:1,000). Sections were then washed and incubated with secondary antibody for 2 h (Alexa 594–conjugated goat antibody to rabbit, Invitrogen).
ofMRI
Imaging was performed on a 7.0 T 70/30 Bruker small animal MRI system with 450 mT/m gradient amplitude and a 4,500 T m−1 s−1 slew rate. Anesthesia was approximately 1.4 ± 0.3% isoflurane/O2, maintained to 60 breaths per minute, measured with a pneumatic sensor below the animal. Body temperature was monitored by a rectal sensor and maintained at 37.0 ± 1.5 °C with a water bed. The head was immobilized with a bite ring and ear bars. A circular surface coil 10 mm in diameter was centered on the optic fiber. A linear coil with 7-cm diameter was used for excitation. Six coronal anatomical images were acquired from caudal to rostral, with the second slice being centered on the fiber tip. Six BOLD sensitive EPI image slices were aligned with the anatomical slices and acquired with echo time = 16 ms, repetition time = 250 ms, number of shots = 4 (yielding an effective repetition time = 1 s per data point), navigator echo to reduce ghosting, four discarded scans at the beginning to allow for magnetization equilibrium, field of view = 1.75 cm, matrix size 80 × 64, acquisition matrix size 80 × 44, spatial image resolution = 0.22 × 0.27 × 0.8 mm, with a gap between slices of 0.2 mm, and interleaved acquisition mode at a bandwidth of 250 kHz. For each animal, 1,800 EPI volumes, equaling 30 min of scan time, were acquired. The VTA was light (473-nm laser)16 stimulated at 1 Hz, starting at 120 s of scan time for 20 s, and off for 40 s. This cycle was repeated 28 times. Data was analyzed with AFNI (Cox 1996) and MATLAB (Mathworks). EPI series were motion corrected and each voxel correlated with the block function indicating the stimulus. The correlation maps were overlaid onto the anatomical images, only taking into account positive correlations. Average activation time series for ChR2-expressing mice (Fig. 2d) were obtained by averaging the data from three animals over the cluster of positive BOLD signal located at the tip of the fiber and defined by voxels with a correlation coefficient of R > 0.1 (P < 2 × 10⁻⁵).
Behavior and data analysis
MedAssociates chambers were equipped with two contact lickometers1 and a laser source (solid state crystal laser, 473-nm wavelength)14,15 controlled by MedPC via a transistor-transistor logic impulse. Animals were water deprived for 23 h, and were given water inside the chamber for 1 h, for four consecutive days. On day 1, mice were given water though the left sipper (only one sipper was given), with the laser source being triggered on licking (as shown in Fig. 2). To balance for any chamber biases, we conditioned half of the animals to the left sipper, whereas the other half was conditioned to the right sipper. On day 2, mice were only given the other sipper (control sipper, without laser activation). Day 3 and 4 were, respectively, repetitions of day 1 and 2. On the fifth day, animals were not deprived and were given laser sipper and control sipper simultaneously for 10 min. Once a clear bias toward laser sipper was established (above 55%), animals were subject to experiments as in Figures 4–7. For each mouse, flavor presentation was randomized to avoid expectation; preference tests lasted 10 min, unless otherwise noted. Chr2-expressing and control mice were run in parallel. Two-bottle preference was calculated as the ratio
preference for sipper1=number of licks on sipper1number of licks on sipper1+number of licks on sipper2
and expressed as percentage values, with 50% representing the indifference ratio.Behavioral data was analyzed with Matlab (v7, Mathworks) and Excel (Microsoft) and expressed as mean ± s.e.m. Significance tests comparing control and ChR2-expressing groups were t tests and, when appropriate (Fig. 3), two-way ANOVAs followed by pairwise post hoc Tukey-Kramer corrections for multiple comparisons. Preference scores for sucrose versus water (dataset A) and sucralose versus water (dataset B) were compared to a preference score of indifference (that is, water versus water, dataset C) using nonparametric resampling methods (bootstrap based t test) to calculate P values. Briefly, for each concentration of sucrose, we computed the mean (μ) difference μ(A) − μ(C) of the two measured datasets (A and C) of size _n_A and _n_C. We pooled the measured datasets A and C (AUC) into one distribution of size _n_A _+ n_C. We randomly collected two datasets A’ and C’ of the same size, _n_A and _n_C from AUC. Then, we computed the difference between the mean of A’ and the mean of C’, μ(A’) − μ(C’), and stored the value. We repeated this 10,000 times (bootstrap) to construct a distribution of differences and compute the mean of this distribution. We computed the probability (p) that the observed difference in the data is different from the mean of the distribution of differences. This is equivalent to a t test. If p was smaller than 0.05, then the difference between A and C was significant. Same procedure applies for B and C.
Glycemic measurements
Blood glucose was measured with Ascencia Elite XL (Bayer, 3918A) and blood samples withdrawn from the tail.
Supplementary Material
Data
ACKNOWLEDGMENTS
We thank F. Pestilli for helping with the bootstrap analysis. We thank the Klarman Family Foundation for Eating Disorders (KFFfED) for supporting this work. A.I.D. was supported by Fundação para a Ciência e Tecnologia (Portugal) and KFFfED. J.V. was supported by KFFfED. X.R. and I.E.d.A. were supported by US National Institutes of Health grant DC009997 to I.E.d.A. F.Z., V.G. and K.D. were supported by the US National Institutes of Health (grant MH075957), the Gatsby Foundation and Defense Advanced Research Projects Agency. H.U.V. was partially supported by the Nancy M. and Samuel C. Fleming Research Scholar Award in Intercampus Collaborations.
Footnotes
AUTHOR CONTRIBUTIONS
A.I.D. contributed to all data. J.V. collected behavioral data. H.U.V. collected and analyzed the ofMRI data and generated the graphs and statistical parametric maps in Figure 1c,d. F.Z., V.G. and K.D. provided viral vectors. X.R. and I.E.d.A. contributed to Figure 2a. A.D., I.E.d.A. and J.F. wrote the manuscript.
COMPETING FINANCIAL INTERESTS
The authors declare no competing financial interests.
Supplementary information is available on the Nature Neuroscience website.
References
- 1.Cameron JD, et al. The effects of prolonged caloric restriction leading to weight-loss on food hedonics and reinforcement. Physiol. Behav. 2008;94:474–480. doi: 10.1016/j.physbeh.2008.02.014. [DOI] [PubMed] [Google Scholar]
- 2.Epstein LH, et al. Effects of deprivation on hedonics and reinforcing value of food. Physiol. Behav. 2003;78:221–227. doi: 10.1016/s0031-9384(02)00978-2. [DOI] [PubMed] [Google Scholar]
- 3.Ren X, et al. Nutrient selection in the absence of taste receptor signaling. J. Neurosci. 2010;30:8012–8023. doi: 10.1523/JNEUROSCI.5749-09.2010. [DOI] [PMC free article] [PubMed] [Google Scholar]
- 4.Rozin P. Acquisition of food preferences and attitudes to food. Int. J. Obes. 1980;4:356–363. [PubMed] [Google Scholar]
- 5.Umabiki M, et al. The improvement of sweet taste sensitivity with decrease in serum leptin levels during weight loss in obese females. Tohoku J. Exp. Med. 2010;220:267–271. doi: 10.1620/tjem.220.267. [DOI] [PubMed] [Google Scholar]
- 6.Berridge KC. Measuring hedonic impact in animals and infants: microstructure of affective taste reactivity patterns. Neurosci. Biobehav. Rev. 2000;24:173–198. doi: 10.1016/s0149-7634(99)00072-x. [DOI] [PubMed] [Google Scholar]
- 7.Glimcher PW, Rustichini A. Neuroeconomics: the consilience of brain and decision. Science. 2004;306:447–452. doi: 10.1126/science.1102566. [DOI] [PubMed] [Google Scholar]
- 8.Padoa-Schioppa C, Assad JA. Neurons in the orbitofrontal cortex encode economic value. Nature. 2006;441:223–226. doi: 10.1038/nature04676. [DOI] [PMC free article] [PubMed] [Google Scholar]
- 9.Padoa-Schioppa C, Assad JA. The representation of economic value in the orbitofrontal cortex is invariant for changes of menu. Nat. Neurosci. 2008;11:95–102. doi: 10.1038/nn2020. [DOI] [PMC free article] [PubMed] [Google Scholar]
- 10.Roesch MR, Calu DJ, Schoenbaum G. Dopamine neurons encode the better option in rats deciding between differently delayed or sized rewards. Nat. Neurosci. 2007;10:1615–1624. doi: 10.1038/nn2013. [DOI] [PMC free article] [PubMed] [Google Scholar]
- 11.Friedman JM. Modern science versus the stigma of obesity. Nat. Med. 2004;10:563–569. doi: 10.1038/nm0604-563. [DOI] [PubMed] [Google Scholar]
- 12.Farooqi IS, et al. Leptin regulates striatal regions and human eating behavior. Science. 2007;317:1355. doi: 10.1126/science.1144599. [DOI] [PMC free article] [PubMed] [Google Scholar]
- 13.Fulton S, et al. Leptin regulation of the mesoaccumbens dopamine pathway. Neuron. 2006;51:811–822. doi: 10.1016/j.neuron.2006.09.006. [DOI] [PubMed] [Google Scholar]
- 14.Hommel JD, et al. Leptin receptor signaling in midbrain dopamine neurons regulates feeding. Neuron. 2006;51:801–810. doi: 10.1016/j.neuron.2006.08.023. [DOI] [PubMed] [Google Scholar]
- 15.Zhang F, et al. Channelrhodopsin-2 and optical control of excitable cells. Nat. Methods. 2006;3:785–792. doi: 10.1038/nmeth936. [DOI] [PubMed] [Google Scholar]
- 16.Tsai H, et al. Phasic firing in dopaminergic neurons is sufficient for behavioral conditioning. Science. 2009;324:1080–1084. doi: 10.1126/science.1168878. [DOI] [PMC free article] [PubMed] [Google Scholar]
- 17.Lee JH, et al. Global and local fMRI signals driven by neurons defined optogenetically by type and wiring. Nature. 2011;465:788–792. doi: 10.1038/nature09108. [DOI] [PMC free article] [PubMed] [Google Scholar]
- 18.de Araujo IE, et al. Food reward in the absence of taste receptor signaling. Neuron. 2008;57:930–941. doi: 10.1016/j.neuron.2008.01.032. [DOI] [PubMed] [Google Scholar]
- 19.Shigemura N, et al. Expression of leptin receptor (Ob-R) isoforms and signal transducers and activators of transcription (STATs) mRNAs in the mouse taste buds. Arch. Histol. Cytol. 2003;66:253–260. doi: 10.1679/aohc.66.253. [DOI] [PubMed] [Google Scholar]
- 20.Sclafani A. Post-ingestive positive controls of ingestive behavior. Appetite. 2001;36:79–83. doi: 10.1006/appe.2000.0370. [DOI] [PubMed] [Google Scholar]
- 21.Figlewicz DP, et al. Leptin reverses sucrose-conditioned place preference in food-restricted rats. Physiol. Behav. 2001;73:229–234. doi: 10.1016/s0031-9384(01)00486-3. [DOI] [PubMed] [Google Scholar]
- 22.Hodos W. Progressive ratio as a measure of reward strength. Science. 1961;134:943–944. doi: 10.1126/science.134.3483.943. [DOI] [PubMed] [Google Scholar]
- 23.Berridge KC. ‘Liking’ and ‘wanting’ food rewards: brain substrates and roles in eating disorders. Physiol. Behav. 2009;97:537–550. doi: 10.1016/j.physbeh.2009.02.044. [DOI] [PMC free article] [PubMed] [Google Scholar]
- 24.Finlayson G, King N, Blundell JE. Liking vs. wanting food: importance for human appetite control and weight regulation. Neurosci. Biobehav. Rev. 2007;31:987–1002. doi: 10.1016/j.neubiorev.2007.03.004. [DOI] [PubMed] [Google Scholar]
- 25.Berridge KC. The debate over dopamine's role in reward: the case for incentive salience. Psychopharmacology (Berl) 2007;191:391–431. doi: 10.1007/s00213-006-0578-x. [DOI] [PubMed] [Google Scholar]
- 26.Wise RA. Dopamine and reward: the anhedonia hypothesis 30 years on. Neurotox. Res. 2008;14:169–183. doi: 10.1007/BF03033808. [DOI] [PMC free article] [PubMed] [Google Scholar]
- 27.Fulton S, Woodside B, Shizgal P. Modulation of brain reward circuitry by leptin. Science. 2000;287:125–128. doi: 10.1126/science.287.5450.125. [DOI] [PubMed] [Google Scholar]
- 28.Fulton S, et al. Food restriction and leptin impact brain reward circuitry in lean and obese Zucker rats. Behav Brain Res. 2004;155:319–329. doi: 10.1016/j.bbr.2004.05.021. [DOI] [PubMed] [Google Scholar]
- 29.Figlewicz DP, et al. Intraventricular insulin and leptin decrease sucrose self-administration in rats. Physiol. Behav. 2006;89:611–616. doi: 10.1016/j.physbeh.2006.07.023. [DOI] [PubMed] [Google Scholar]
- 30.Lydall ES, Gilmour G, Dwyer DM. Analysis of licking microstructure provides no evidence for a reduction in reward value following acute or sub-chronic phencyclidine administration. Psychopharmacology (Berl) 2010;209:153–162. doi: 10.1007/s00213-010-1779-x. [DOI] [PubMed] [Google Scholar]
- 31.Glimcher PW, Rustichini A. Neuroeconomics: the consilience of brain and decision. Science. 2004;306:447–452. doi: 10.1126/science.1102566. [DOI] [PubMed] [Google Scholar]
- 32.Sugrue LP, Corrado GS, Newsome WT. Choosing the greater of two goods: neural currencies for valuation and decision making. Nat. Rev. Neurosci. 2005;6:363–375. doi: 10.1038/nrn1666. [DOI] [PubMed] [Google Scholar]
- 33.Ventura EE, Davis JN, Goran MI. Sugar content of popular sweetened beverages based on objective laboratory analysis: focus on fructose content. Obesity (Silver Spring) 2010;19:687. doi: 10.1038/oby.2010.255. [DOI] [PubMed] [Google Scholar]
- 34.Eric Walters D, et al. Sweeteners: Discovery, Molecular Design, and Chemoreception. Oxford University Press; 1991. [Google Scholar]
- 35.Bukowiecki LJ, et al. Effects of sucrose, caffeine, and cola beverages on obesity, cold resistance, and adipose tissue cellularity. Am. J. Physiol. 1983;244:R500–R507. doi: 10.1152/ajpregu.1983.244.4.R500. [DOI] [PubMed] [Google Scholar]
- 36.Glencoe C. Glencoe Chemistry: Matter and Change. McGraw Hill; New York: 2002. [Google Scholar]
- 37.Servant G, et al. Positive allosteric modulators of the human sweet taste receptor enhance sweet taste. Proc. Natl. Acad. Sci. USA. 2010;107:4746–4751. doi: 10.1073/pnas.0911670107. [DOI] [PMC free article] [PubMed] [Google Scholar]
- 38.Nie Y, et al. Distinct contributions of T1R2 and T1R3 taste receptor subunits to the detection of sweet stimuli. Curr. Biol. 2005;15:1948–1952. doi: 10.1016/j.cub.2005.09.037. [DOI] [PubMed] [Google Scholar]
- 39.Nelson G, et al. Mammalian sweet taste receptors. Cell. 2001;106:381–390. doi: 10.1016/s0092-8674(01)00451-2. [DOI] [PubMed] [Google Scholar]
- 40.Weijnen JA. Lick sensors as tools in behavioral and neuroscience research. Physiol. Behav. 1989;46:923–928. doi: 10.1016/0031-9384(89)90192-3. [DOI] [PubMed] [Google Scholar]
- 41.Bartoshuk LM. Bitter taste of saccharin related to the genetic ability to taste the bitter substance 6-n-propylthiouracil. Science. 1979;205:934–935. doi: 10.1126/science.472717. [DOI] [PubMed] [Google Scholar]
- 42.Li X, et al. Human receptors for sweet and umami taste. Proc. Natl. Acad. Sci. USA. 2002;99:4692–4696. doi: 10.1073/pnas.072090199. [DOI] [PMC free article] [PubMed] [Google Scholar]
- 43.Bellisle F, Drewnowski A. Intense sweeteners, energy intake and the control of body weight. Eur. J. Clin. Nutr. 2007;61:691–700. doi: 10.1038/sj.ejcn.1602649. [DOI] [PubMed] [Google Scholar]
- 44.Haley S. Sweetener Consumption in the United States (Electronic Outlook Report from the Economic Research Service) USDA; 2005. pp. 1–19. [Google Scholar]
- 45.Lewis SR, et al. Genetic variance contributes to ingestive processes: a survey of 2-deoxy-D-glucose-induced feeding in eleven inbred mouse strains. Physiol. Behav. 2006;87:595–601. doi: 10.1016/j.physbeh.2005.12.002. [DOI] [PubMed] [Google Scholar]
- 46.Abizaid A, et al. Ghrelin modulates the activity and synaptic input organization of midbrain dopamine neurons while promoting appetite. J. Clin. Invest. 2006;116:3229–3239. doi: 10.1172/JCI29867. [DOI] [PMC free article] [PubMed] [Google Scholar]
Associated Data
This section collects any data citations, data availability statements, or supplementary materials included in this article.
Supplementary Materials
Data