IL-35-producing B cells are critical regulators of immunity during autoimmune and infectious diseases (original) (raw)
. Author manuscript; available in PMC: 2014 Dec 9.
Published in final edited form as: Nature. 2014 Feb 23;507(7492):366–370. doi: 10.1038/nature12979
SUMMARY
B lymphocytes have critical roles as positive and negative regulators of immunity. Their inhibitory function has so far been associated primarily with interleukin (IL)-10 because B cell-derived IL-10 can protect against autoimmune disease and increase susceptibility to pathogens1,2. Here, we identify IL-35-producing B cells as novel key players in the negative regulation of immunity. Mice in which only B cells did not express IL-35 lost their ability to recover from the T cell-mediated demyelinating autoimmune disease experimental autoimmune encephalomyelitis (EAE). In contrast, these mice displayed a strikingly improved resistance to infection with the intracellular bacterial pathogen Salmonella typhimurium, as shown by their superior containment of the bacterial growth and their prolonged survival both after primary infection, and upon secondary challenge after vaccination, compared to control mice. The increased immunity found in mice lacking IL-35 production by B cells was associated with a higher activation of macrophages and inflammatory T cells, as well as an enhanced stimulatory function of B cells as antigen-presenting cells (APC). During Salmonella infection IL-35- and IL-10-producing B cells corresponded to two largely distinct sets of surface-IgM+CD138hiTACI+CXCR4+CD1dintTim1int plasma cells expressing the transcription factor Blimp1. During EAE CD138+ plasma cells were also the major source of B cell-derived IL-35 and IL-10. Collectively, our data unravel the importance of IL-35-producing B cells in regulation of immunity, and highlight IL-35 production by B cells as a novel therapeutic target for autoimmune and infectious diseases. More generally, this study emphasizes the central role of activated B cells, particularly plasma cells, and their production of cytokines in the regulation of immune responses in health and disease.
RESULTS & DISCUSSION
The inhibitory activities of B cells involve their production of IL-10, which in mice can protect from autoimmunity, but impair resistance to infection3-6. Such suppressive function could be relevant to human diseases. A defect in IL-10 secretion by B cells was observed in patients with multiple sclerosis (MS) and type 1 diabetes7,8. Furthermore, B cell depletion therapy had deleterious effects in some patients with MS or ulcerative colitis (UC)9,10. B cell depletion also led to UC or psoriasis in patients with Grave’s disease, or rheumatoid arthritis, respectively11,12. These effects were probably not all due to a loss of IL-10-producing B cells. Mouse B cells could inhibit immunity independently of IL-1013,14. However no other mediator to account for this has been characterized. There is an urgent need to identify additional factors mediating the regulatory functions of B cells.
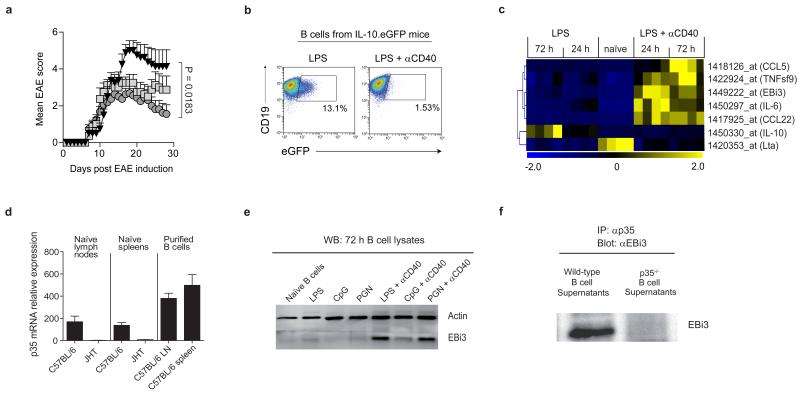
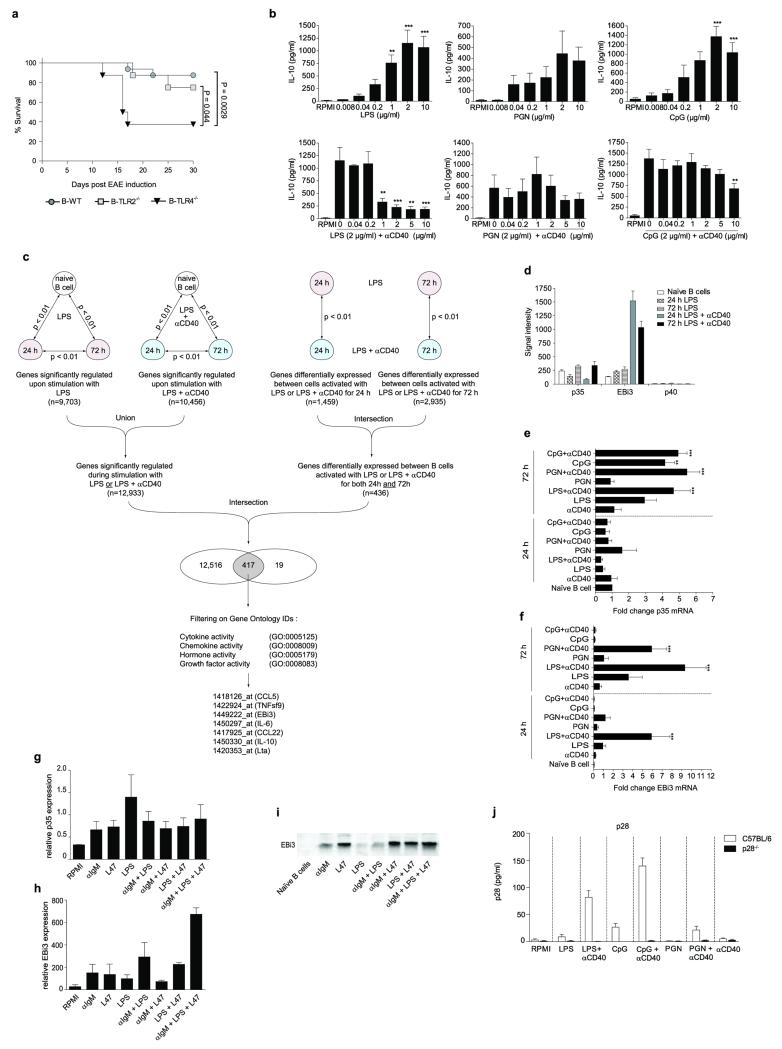
B cells require activation to exert suppressive activity, and Toll-like receptors (TLR) are critical in this process. In particular, mice with deficiencies in both TLR2 and TLR4 restricted to B cells developed a chronic EAE after immunization with the encephalitogenic peptide from myelin oligodendrocyte glycoprotein (MOG35-55), while control mice recovered from disease15. Using mice with single deficiencies in these TLR restricted to B cells (B-TLR2−/− and B-TLR4−/− mice, respectively), we found that TLR4 was the most critical for B cell-mediated suppression in EAE (Fig. 1a and Extended Data Fig. 1a). Together with previous studies3, these results establish TLR4 and CD40 as receptors essential for the regulatory function of B cells in EAE. CD40 also contributes to the protective roles of B cells in UC, and collagen-induced arthritis4,5.
Figure 1. B cells secrete IL-35 upon activation via TLR4 and CD40.
a, EAE was induced in B-TLR2−/− (grey squares; n=8), B-TLR4−/− (black triangles; n=8), and B-WT mice (grey circles; n=16) by immunization with MOG35-55 peptide in complete Freund’s adjuvant. Data show clinical EAE scores from two independent experiments (mean ± SEM). Cumulative disease scores were compared using unpaired t-test. b, Splenic B cells from IL-10.eGFP mice were stimulated for 72 h with LPS (1 μg/ml) or LPS (1 μg/ml)+αCD40 (10 μg/ml), and eGFP expression was measured by flow cytometry. Plots show eGFP expression by live CD19+ cells. Results are representative of three independent experiments. c, Hierarchical cluster analysis of secreted factors differentially expressed between B cells activated with LPS or LPS+αCD40 (Pearson correlation with average linkage). Affymetrix microarrays were performed in quadruplicates from splenic naïve B cells, and from B cells activated with LPS (1 μg/ml) or LPS (1 μg/ml)+αCD40 (10 μg/ml) for 24 h and 72 h. Expression levels of each gene is shown for each array compared to its average value for the 20 arrays, with a scale ranging from two-fold increase (yellow) to two-fold decrease (blue) compared to average. d, p35 mRNA expression was quantified by real-time PCR in LN and spleen from naïve C57BL/6 and B cell-deficient JHT mice, as well as in B cells purified from LN and spleen of C57BL/6 mice. Data show the compilation of three independent experiments (mean ± SEM). e, Splenic B cells were activated as indicated for 72 h, and treated with GolgiStop for the last 4 h of culture. B cell lysates were separated on SDS-PAGE gel and blotted with anti-EBi3 or anti-actin antibody. Data show representative result from three independent experiments. f, B cells from C57BL/6 or p35-deficient mice were activated for 72 h with LPS+αCD40 (clone FGK-45; 10 μg/ml). Culture supernatants were subjected to immunoprecipitation with anti-p35 followed by Western blot with anti-EBi3 antibody. Data shown are representative of two independent experiments.
IL-10 production by B cells is required for recovery from EAE3. Naïve B cells produced IL-10 after TLR4 engagement, but not upon co-stimulation via TLR4+CD40 (Fig. 1b and Extended Data Fig. 1b). To assess whether B cells could express a distinct suppressive factor upon TLR4+CD40 stimulation, we performed Affymetrix array analyses on (i) naïve B cells, (ii) B cells activated via TLR4, and (iii) B cells activated via TLR4+CD40, and focused on genes coding for secreted molecules (Extended Data Fig. 1c). Among the genes differentially expressed, of particular interest was Epstein-Barr virus-induced gene 3 (EBi3), a member of the IL-12 cytokine family that can dimerize with p28 or p35 to generate IL-27 or IL-35, respectively, which both have suppressive functions16-19. B cells did not express p40 mRNA, highlighting its cell-type specific expression pattern20, but constitutively transcribed p35 (Extended Data Fig. 1d). In fact, B cells were the major source of p35 mRNA in secondary lymphoid tissues (Fig. 1d). B cells up-regulated expression of p35 and EBi3 mRNA, as well as EBi3 protein upon activation via TLR4+CD40, which was further increased upon BCR engagement, suggesting they could secrete IL-35 (Fig. 1e and Extended Data Fig. 1). This was confirmed by co-immunoprecipitation on supernatants from TLR4+CD40-activated B cells (Fig. 1f). We conclude that B cells can secrete IL-35 after activation via TLR4+CD40.
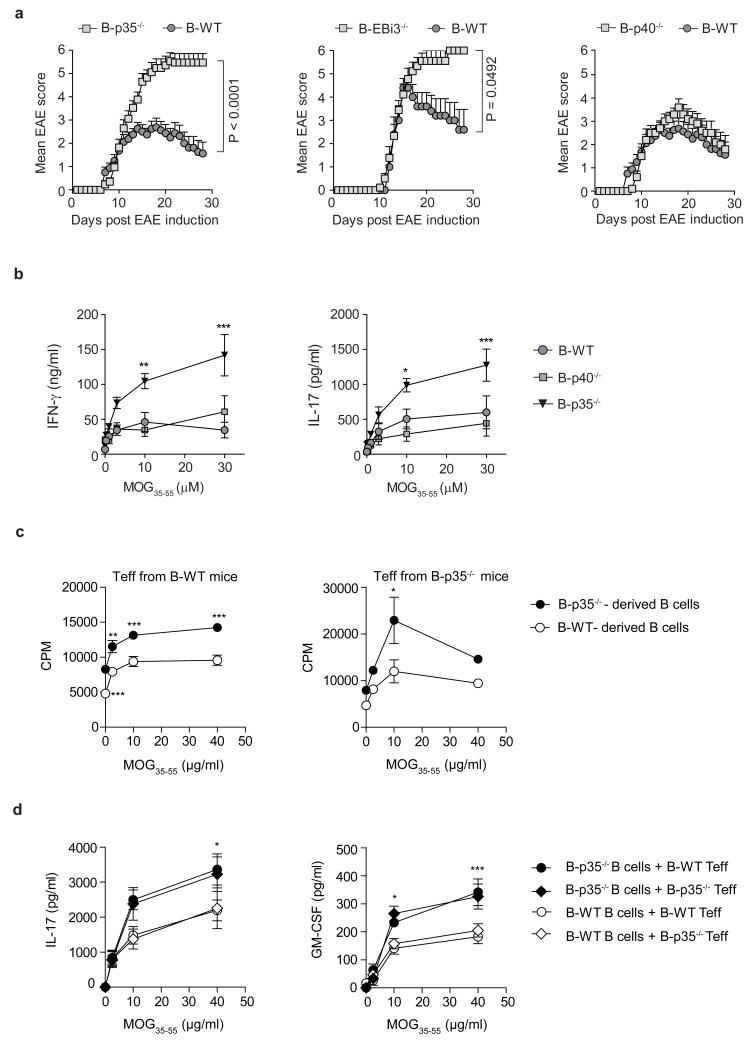
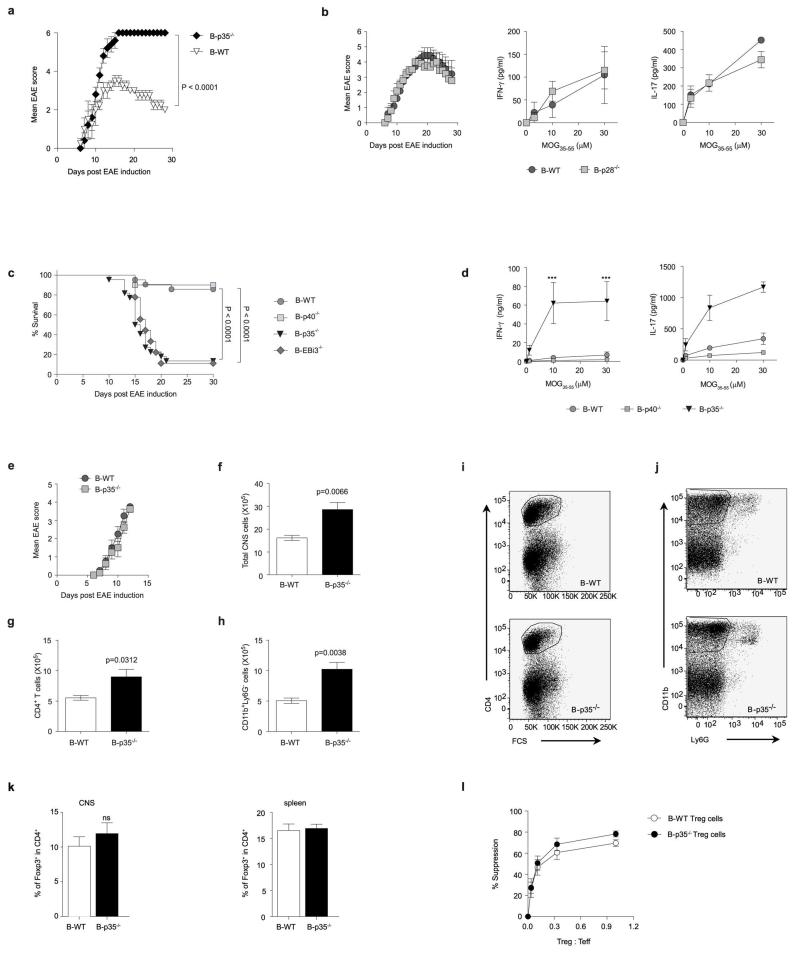
To evaluate the role of IL-35 expression by B cells during EAE, we used mice with B cell-restricted deficiency in p35 (B-p35−/−), or EBi3 (B-EBi3−/−), or control mice with wild-type B cells (B-WT). We also used mice in which B cells could not express p40 (B-p40−/−), or p28 (B-p28−/−), because p35 can dimerize with p40 to form IL-12, and EBi3 can associate with p28 to form IL-27. B cells secreted p28 after activation (Extended Data Fig. 1j). After immunization with MOG35-55, B-p35−/− and B-EBi3−/− mice developed exacerbated forms of EAE, while B-p40−/− and B-p28−/− mice had disease courses similar to B-WT controls (Fig. 2a and Extended Data Fig. 2). Therefore, B cells limited EAE pathogenesis through provision of IL-35. EAE pathogenesis involves TH1 and TH17 cells, which express IFN-γ and IL-17, respectively21,22. B-p35−/− mice displayed increased MOG-reactive IFN-γ and IL-17 production compared to control mice (Fig. 2b and Extended Data Fig. 2d). In contrast, B-p28−/− and B-p40−/− mice mounted normal T cell responses (Fig. 2b and Extended Data Fig. 2). B-p35−/− mice had more CD4+ T cells and mononuclear phagocytes in central nervous system than B-WT mice (Extended Data Fig. 2), suggesting that B cell-derived IL-35 limited disease by reducing the accumulation of pathogenic cells in the target organ. These data demonstrate that B cell-derived IL-35 is a critical regulator of T cell-mediated autoimmunity.
Figure 2. IL-35 expression by B cells is required for recovery from EAE.
a, EAE was induced in: left panel: B-p35−/− (grey squares; n=17) and B-WT mice (black circles; n=16), middle panel: B-EBi3−/− (grey squares, n=9) and corresponding B-WT mice (black circles; n=5), right panel: B-p40−/− (grey squares; n=10) and B-WT mice (black circles; n=16) by immunization with MOG35-55 peptide in Complete Freund’s adjuvant. Data show clinical EAE scores from two independent experiments (mean ± SEM). Cumulative disease scores were compared using unpaired t-test. b, Splenocytes were harvested from mice on day 10 after EAE induction, and pooled before re-stimulation for 48 h with MOG35-55 in increasing concentrations. Culture supernatants were analyzed by ELISA to determine IFN-γ and IL-17 concentrations. Data show representative result from two independent experiments. c, EAE was induced in B-p35−/− and corresponding B-WT mice by immunization with MOG35-55 peptide in Complete Freund’s adjuvant. B cells and CD4+CD25− T cells (Teff) were isolated from pooled draining LN and spleens on day 10 after immunization. 5×10⁵ B cells from B-p35−/− or B-WT mice were then cultured with 1×10⁴ Teff cells from B-p35−/− or B-WT mice in presence of MOG35-55 in increasing concentrations, as indicated. Proliferation was assessed after 64 h by 3H-thymidine incorporation. CPM: counts per minute. Data show representative results from two independent experiments. d, Supernatants from cultures as described in (c) were harvested after 48 h, and analyzed by Bio-Plex to determine the concentrations of IL-17 and GM-CSF. Data shown (mean ± SEM) are pooled from two independent experiments. b-d, Graphs show mean ± SEM. Results were compared using a Two-way ANOVA followed by a Bonferroni post-test (* p<0.05, ** p<0.01; *** p<0.001).
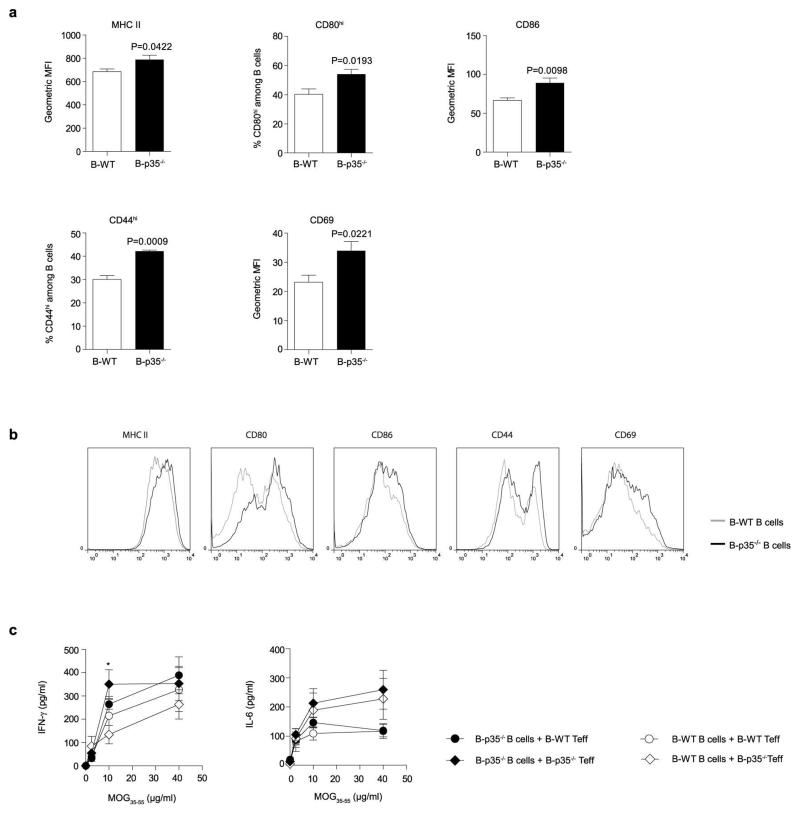
The mechanisms underlying the suppressive activities of IL-35 remain poorly understood23. During EAE, the increased T cell response observed in B-p35−/− mice was not due to a defect in CD4+Foxp3+ T regulatory (Treg) cells (Extended Data Fig. 2), which are protective in this disease24. B cells from B-p35−/− mice expressed higher levels of activation markers (CD44, CD69), and molecules involved in antigen presentation to CD4+ T cells (MHC-II, CD80, CD86) compared to control B cells (Extended Data Fig. 3). Accordingly, they were more potent APC than control B cells, stimulating higher proliferation and production of inflammatory cytokines (IL-17 and GM-CSF) by MOG-reactive CD4+ T cells (Fig. 2c, d and Extended Data Fig. 3c). Preliminary studies showed that B-p35−/− mice were susceptible to EAE induced with human MOG, a disease dependent on the pathogenic functions of B cells25. These findings introduce IL-35 as a regulator of the APC capacity of B cells.
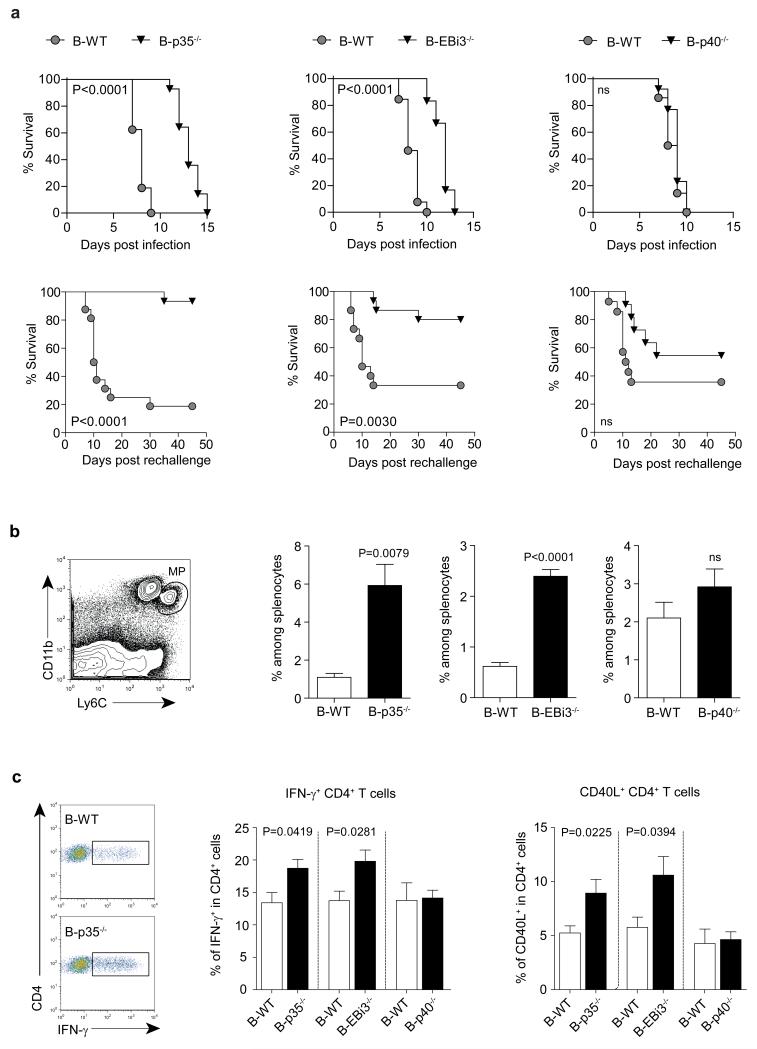
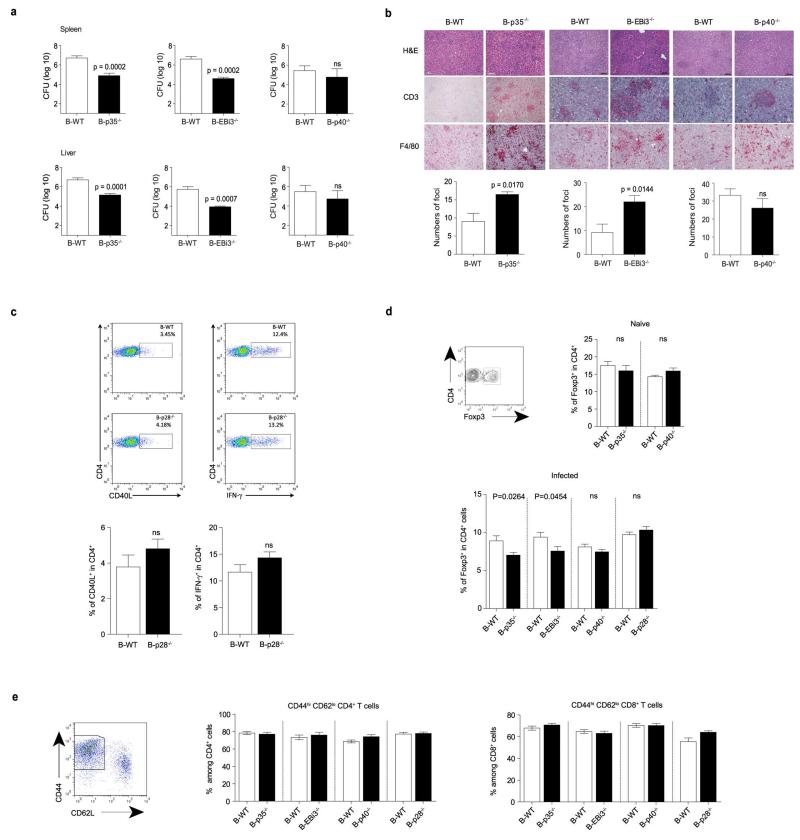
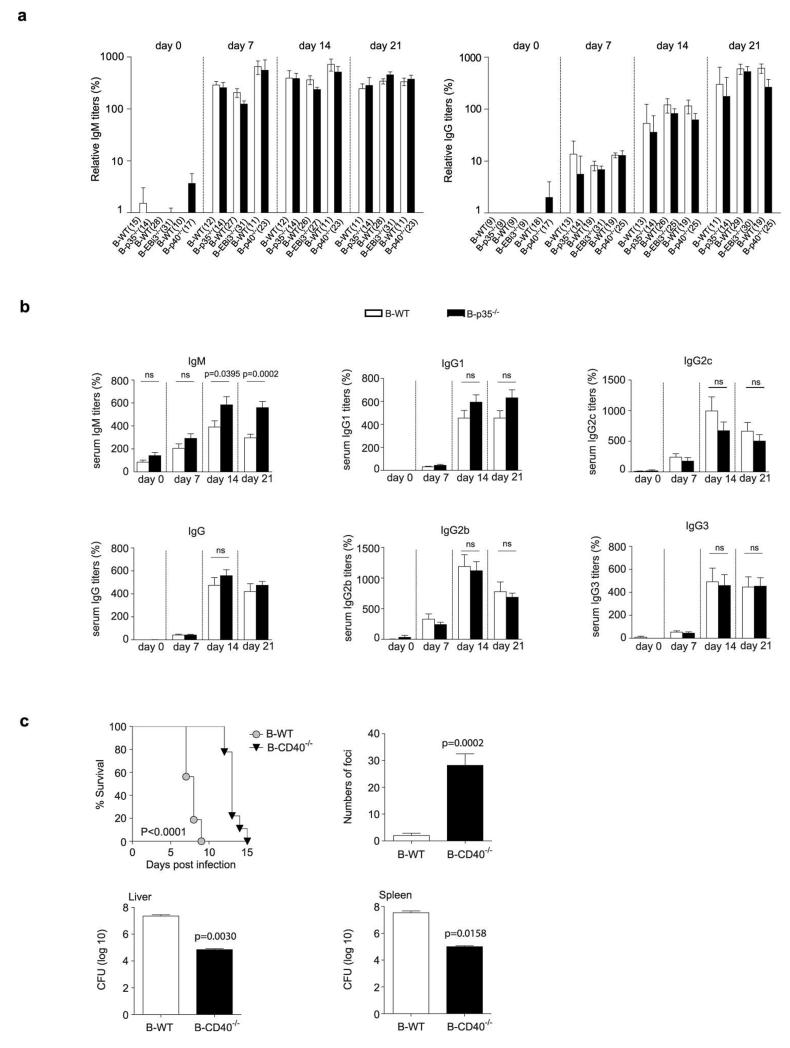
To test the role of B cell-derived IL-35 in infection, we challenged B-p35−/−, B-EBi3−/−, and B-p40−/− mice with the Gram-negative bacterium Salmonella typhimurium. This intracellular pathogen causes a disease in mice that resembles typhoid fever in humans, which is responsible for approximately 20 million cases and 600,000 deaths annually26. B-p35−/− and B-EBi3−/− mice displayed prolonged survival compared to B-p40−/− and B-WT mice, both after primary infection, and upon secondary challenge (Fig. 3a). This improved resistance correlated with better control of the bacterial burden in spleen and liver, increased accumulation of macrophages in these organs, and stronger inflammatory T cell responses towards the pathogen (Fig. 3b, c and Extended Data Fig. 4). In contrast, B cell-derived IL-35 had no effect on Treg frequencies, global frequencies of activated T cells, or humoral immunity against Salmonella (Extended Data Fig. 4 and 5a). B-p35−/− mice also mounted normal antibody responses against a hapten-protein antigen (Extended Data Fig. 5b). Consistent with the role of CD40 in IL-35 production by B cells (Fig. 1), mice with a B cell-restricted deficiency in CD40 displayed enhanced control of Salmonella infection (Extended Data Fig. 5c). These data demonstrate that B cells can inhibit anti-microbial immunity through production of IL-35.
Figure 3. B cell-derived IL-35 enhances susceptibility to Salmonella typhimurium.
a, Top panel shows survival curves of B-p35−/− (n=14) and their corresponding B-WT mice (n=16), B-EBi3−/− (n=12) and their corresponding B-WT mice (n=13), B-p40−/− (n=13) and their corresponding control B-WT mice (n=14) after i.v. infection with 100 colony-forming units (CFU) virulent Salmonella typhimurium strain (SL1344). Data are pooled from two independent experiments for each panel. Survival curves were compared using the Wilcoxon test. The bottom panel shows survival curves of B-p35−/− (n=15) and their corresponding B-WT mice (n=16), B-EBi3−/− (n=15) and their corresponding B-WT mice (n=15), B-p40−/− (n=11) and their corresponding control B-WT mice (n=14), which were vaccinated with attenuated Salmonella (SL7207) and 90 days later re-challenged with 100 CFU virulent Salmonella (SL1344). Data are pooled from two independent experiments. Survival curves were compared using the Wilcoxon test. b, (left panel) representative FACS plot of mononuclear phagocytes (MP) gated as CD11b+Ly6Chi cells among live splenocytes from a B-WT mouse at day 6 p.i. with SL1344; (right panel) frequencies of MP per spleen at day 6 p.i. in B-p35−/−, B-EBi3−/−, and B-p40−/− mice together with their corresponding control B-WT mice. Numbers of mice analyzed: B-p35−/− (n=6) and their corresponding B-WT mice (n=8), B-EBi3−/− (n=7) and their corresponding B-WT mice (n=5), B-p40−/− (n=8) and their corresponding control B-WT mice (n=8). Data are pooled from two independent experiments. Graphs show mean ± SEM. Data were analyzed with unpaired t-test. p-values > 0.05 are considered as non significant (ns). c, Indicated groups of mice were infected with attenuated Salmonella (SL7207). After 21 days cells from bone marrow were stained for surface CD4 and intracellular CD40L or IFN-γ after 6 h re-stimulation with heat-killed Salmonella. The left panel shows representative FACS plots of IFN-γ+ cells among CD4+ T cells from B-WT and B-p35−/− mice. Middle and right panels show, respectively, frequencies of IFN-γ+ and CD40L+ cells among CD4+ T cells. Data shown are pooled from two independent experiments with the following total number of mice: B-p35−/− (n=12) and their corresponding B-WT mice (n=10), B-EBi3−/− (n=8) and their corresponding B-WT mice (n=9), B-p40−/− (n=15) and their corresponding control B-WT mice (n=9). Graphs show mean ± SEM. Data were analyzed with an unpaired t-test.
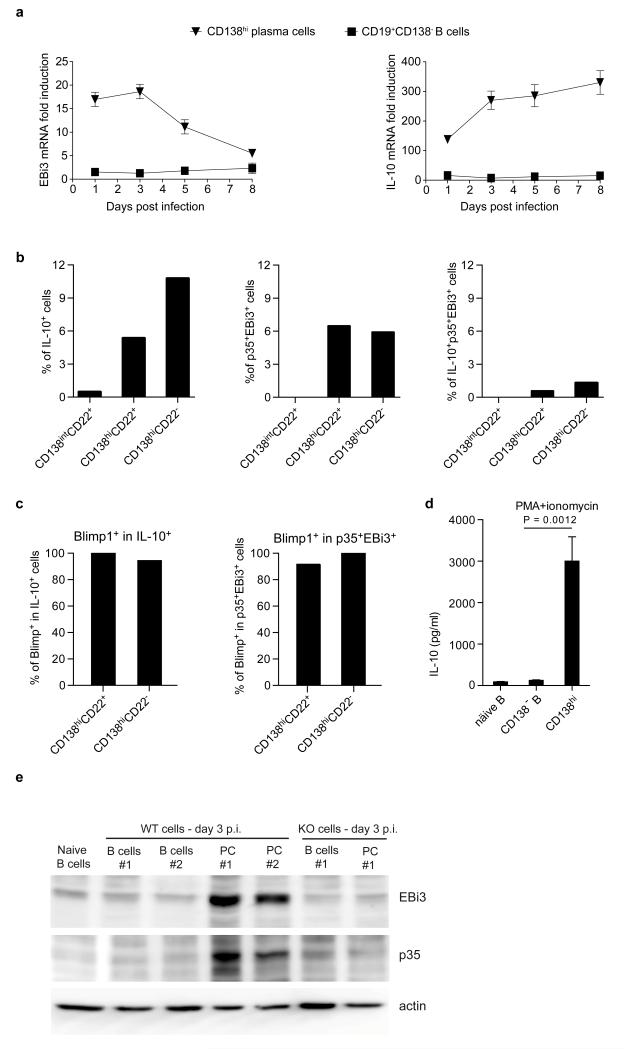
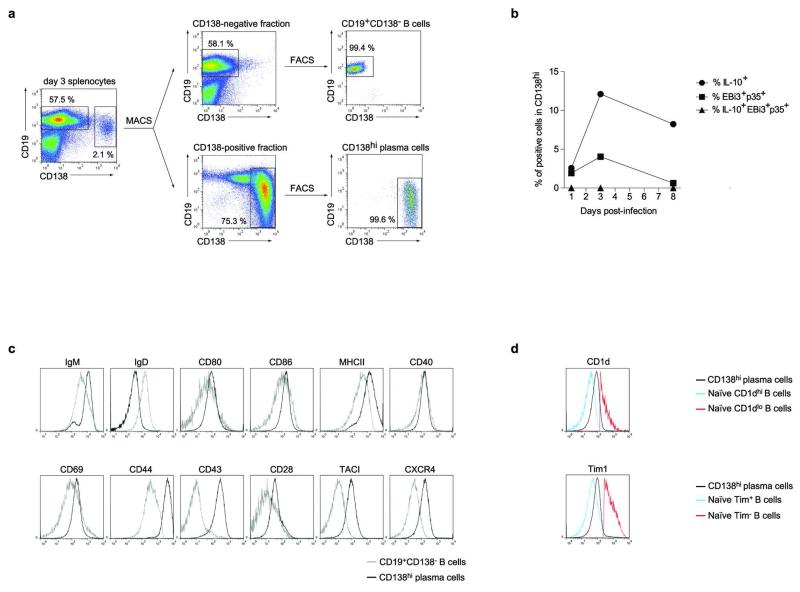
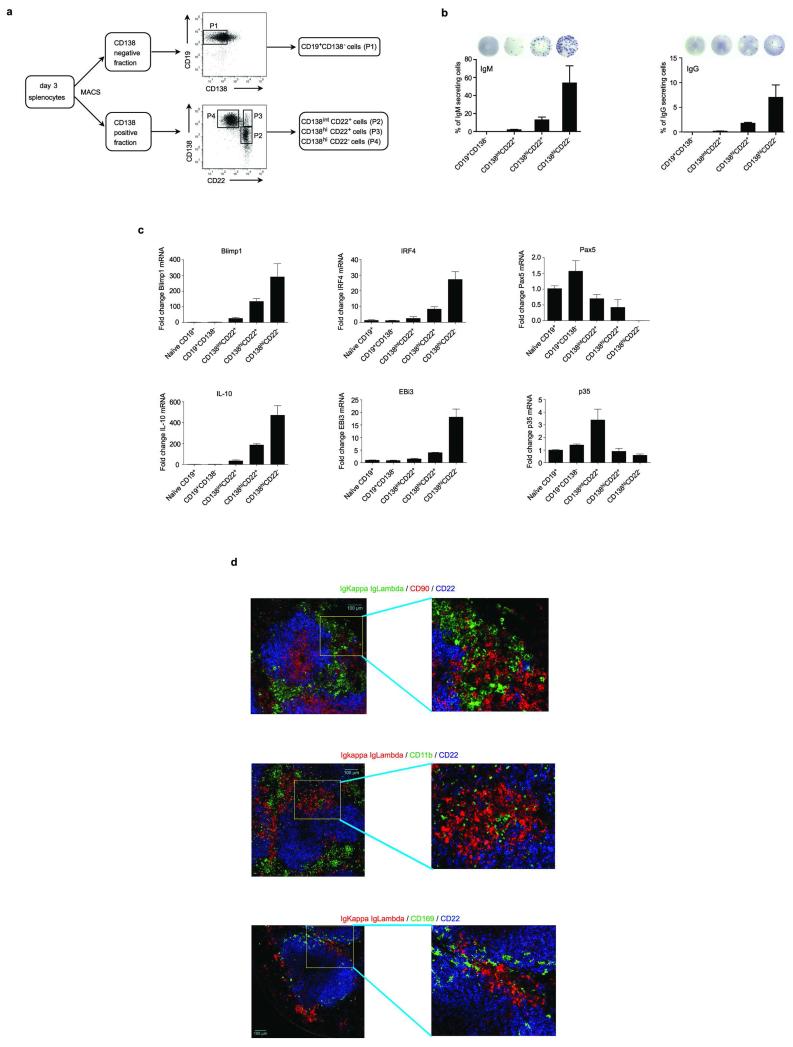
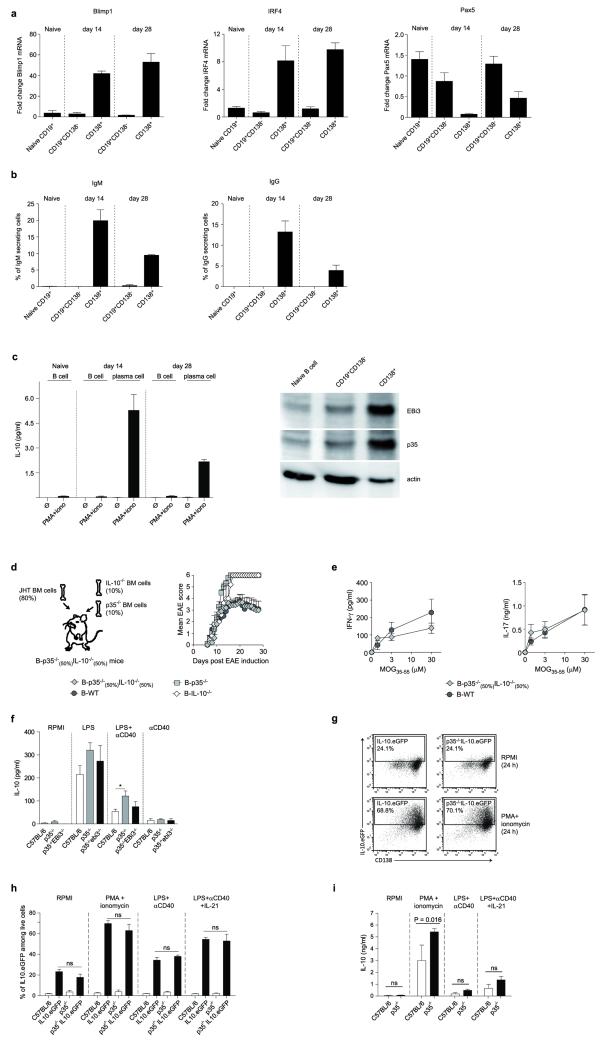
B cells can also inhibit anti-Salmonella immunity through provision of IL-106. To identify IL-10- and IL-35-producing B cells, and to clarify their relationship, we quantified EBi3 and IL-10 mRNA in CD19+CD138− B cells and CD138hi plasma cells during Salmonella infection (Fig. 4a and Extended Data Fig. 6). EBi3 and IL-10 were exclusively induced in CD138hi cells (Fig. 4a). Single cell PCR analyses indicated that distinct sets of CD138hi cells expressed the mRNA for IL-10 or for both IL-35 subunits EBi3 and p35 (Fig. 4b). We therefore characterized further these plasma cells. They expressed uniform surface levels of IgM, CD80, CD86, MHC-II, CD40, CD69, CD44, CD43, TACI, and CXCR4, as well as intermediate levels of CD1d and Tim1 (Extended Data Fig. 6a and d), yet three subsets could be distinguished according to CD138 and CD22 levels: CD138intCD22+, CD138hiCD22+, and CD138hiCD22− cells (Extended Data Fig. 7). These subsets differed by their capacity to produce antibodies, and expressed distinct amounts of mRNA for the transcription factors driving plasma cell development (Blimp1, IRF4), or maintaining B cell identity (Pax5) (Extended Data Fig. 7), demonstrating that they corresponded to different stages of plasma cell development. The expression levels of IL-10 and EBi3 mRNA in these subsets correlated with their degree of maturity, and were highest in the most differentiated CD138hiCD22− cells (Extended Data Fig. 7c). CD138hiCD22− plasma cells were mostly located at the interface between red and white pulp in spleen, in clusters also containing T cells, CD11b+ and CD169+ myeloid cells (Extended Data Fig. 7d). Single cell PCR analyses revealed that about 6-10% of CD138hi cells expressed IL-10 mRNA, and a similar frequency made both IL-35 subunits mRNA, whereas only few cells co-expressed these three transcripts (Fig. 4b). Nearly all CD138hi cells transcribing IL-10 or both IL-35 subunits co-expressed Blimp1 (Fig. 4c), as expected for plasma cells. The less mature CD138intCD22+ population contained little IL-10 or EBi3 mRNA (Extended Data Fig. 7c), and only rare cells contained IL-10 mRNA (Fig. 4b), suggesting that expression of IL-10 and both IL-35 subunits were acquired during plasma cell maturation. These data indicate that distinct sets of plasma cells provide IL-10 and IL-35 during Salmonella infection.
Figure 4. IL-10 and IL-35 are expressed by CD138hi plasma cells during Salmonella typhimurium infection.
a, Splenic plasma cells (CD138hi) and B cells (CD19+CD138−) were isolated from C57BL/6 mice on days 0, 1, 3, 5, and 8 after infection with 107 CFU attenuated Salmonella (SL7207). EBi3 and IL-10 mRNA expression were then quantified by real-time PCR. Data show fold induction of EBi3 (left) and IL-10 (right) mRNA expression in plasma and B cells during infection compared to naïve B cells. A compilation of five independent experiments is shown (mean ± SEM). b, Single cells of CD138intCD22+, CD138hiCD22+, and CD138hiCD22− plasma cells were sorted by FACS from C57BL/6 mice on day 3 after infection with 107 CFU attenuated Salmonella (SL7207). A total of 208 CD138intCD22+, 206 CD138hiCD22+, and 189 CD138+CD22− single cells gave a positive signal for β-actin, and were included in data shown. Data show percentages of IL-10+ (left), p35+EBi3+ (middle), and IL-10+p35+EBi3+ (right) cells among each subset. c, Blimp1 mRNA expression in those single cells analyzed in (c) were also detected by single-cell PCR. Data show the percentages of Blimp1+ cells among IL-10-expressing (left), as well as p35 and EBi3 co-expressing cells (right). d, CD138hi plasma cells and CD19+CD138− B cells were isolated from spleen of C57BL/6 mice on day 3 after infection with attenuated Salmonella (SL7207; 107 CFU) using a combination of magnetic and FACS methods. Naïve B splenic B cells were isolated from unchallenged C57BL/6 mice by magnetic selection. Isolated cells were activated for 24 h with PMA+ionomycin, and IL-10 concentrations in culture supernatants were determined by Bio-Plex. Data shown are pooled from 5 independent experiments. Results were compared suing unpaired t-test. d, Splenic CD19+CD138− B cells (B cells) and CD138+ plasma cells (PC) were isolated from spleens of C57BL/6 (WT) and p35−/−EBi3−/−p40−/− (KO) mice on day 3 p.i. with attenuated Salmonella (SL7207; 107 CFU). B cell lysates were separated on SDS-PAGE gel and blotted with anti-EBi3, anti-p35, or anti-actin antibodies. Data show results from two independent cell preparations for WT samples, and one preparation for p35−/−EBi3−/−p40−/− B and plasma cells.
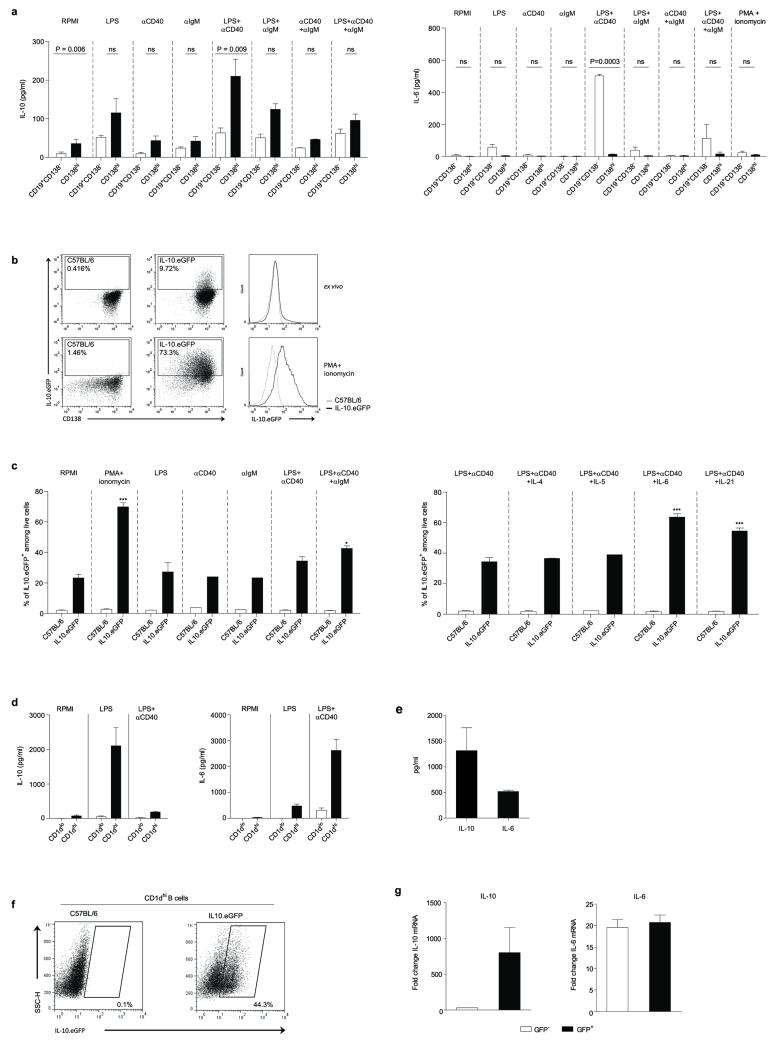
To study further cytokine production by plasma cells, we isolated CD138hi and CD19+CD138− B cells from mice infected with Salmonella, and re-stimulated them ex vivo. Plasma cells consistently secreted more IL-10 than B cells (Fig. 4d and Extended Data Fig. 8). Around 70% of CD138hi plasma cells up-regulated IL-10 expression after stimulation with phorbol 12-myristate 13-acetate plus ionomycin, a classical treatment for identifying cytokine-producing cells (Extended Data Fig. 8). CD138+ plasma cells were also the major B cell subtype expressing the proteins EBi3 and p35 that compose IL-35 compared to CD19+CD138− B cells (Fig. 4e). In contrast, CD138hi plasma cells did not secrete IL-6, a mediator of the pro-inflammatory functions of B cells27, unlike CD19+CD138− B cells (Extended Data Fig. 8). This lack of IL-6 production, which may be due to a repressive effect of Blimp128 distinguishes IL-10- and IL-35-expressing plasma cells from IL-10-producing CD1dhi B cells (Extended Data Fig. 8). These data demonstrate that CD138hi plasma cells have a remarkable propensity to express anti-inflammatory cytokines but not IL-6 during Salmonella infection. Our results emphasize the regulatory potential of plasma cells compared to other B cell subsets.
Our study demonstrates that B cells can produce IL-35, and identifies IL-35-producing B cells as novel critical regulators of immunity. At a time window during Salmonella infection when both B cell-derived IL-106 and IL-35 exerted suppressive functions, plasma cells were the major B cell type expressing these cytokines. Plasma cells were also the major B cell subset expressing IL-10 and IL-35 subunits during EAE (Extended Data Fig. 9). During Salmonella infection, IL-10 and IL-35 were made by distinct sets of plasma cells, suggesting that these two suppressive axes can operate in parallel. In line with this, mice in which individual B cells could express either IL-10, or IL-35, but not both cytokines, displayed a normal EAE course (Extended Data Fig. 9). Accordingly, B and plasma cells could produce IL-10 without concomitant IL-35 secretion (Extended Data Fig. 9). Future studies shall assess whether “regulatory plasma cells” producing IL-10 and IL-35 (but not IL-6) can provide novel opportunities for immune intervention.
Methods
Mice, immunization and infection
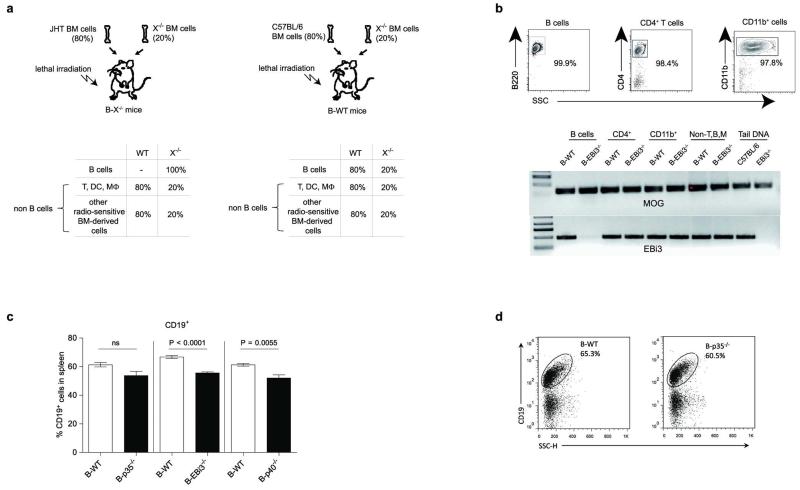
C57BL/6, TLR2−/−, TLR4−/−, EBi3−/−, p28−/−, p35−/−, p40−/−, CD40−/−, IL-10−/−, IL-10−/−p35−/−, p35−/− EBi3−/−p40−/−, JHT, IL-10.eGFP6, and p35−/−IL10.eGFP mice were bred under specific pathogen-free conditions. B-TLR2−/−, B-TLR4−/−, B-p28−/−, B-p35−/−, B-EBi3−/−, B-p40−/−, B-CD40−/−, B-IL-10−/−, and B-IL-10−/−p35−/− mice were obtained by a previously described mixed bone marrow chimera approach using lethally irradiated C57BL/6 or JHT mice as recipients3,6. Briefly, B-p35−/− mice were obtained by reconstituting recipient mice with a mixture of bone marrow cells from B cell-deficient JHT mice (80%) and p35-deficient mice (20%). Control B-WT chimera were obtained using a mixture of bone marrow cells from JHT mice (80%) and C57BL/6 mice (20%) for experiments shown in Fig. 1a, Fig. 2a left panel, and Fig. 2a right panel. For all other experiments (including Fig. 2a middle panel, and Extended Data Fig. 2a), corresponding B-WT control chimera were obtained as outlined in Extended Data Fig. 10, by reconstituting irradiated mice with a mixture of bone marrow cells from C57BL/6 mice (80%) and from mice deficient in the gene of interest (20%). The various control chimera are indistinctly called “corresponding B-WT mice” throughout the study. EAE was induced by immunization with MOG35-55 peptide, or recombinant human MOG extracellular domain emulsified in Complete Freund’s adjuvant (Sigma-Aldrich) and pertussis toxin (Sigma-Aldrich), and assessed as previously described3. Mice with a weight loss >20% were humanely euthanized according to ethical regulations. To measure the MOG-reactive T cell response, 8×10⁵ splenocytes were stimulated in flat-bottomed 96-well plates with different concentrations of MOG35-55 peptide for 2 days, and culture supernatants were then analyzed by ELISA to determine concentrations of IFN-γ and IL-17 (coating/detection with clones R4-6A2 and XMG1.2 for IFN-γ, and TC11-18H10 and TC11-8H4 for IL-17). Mice were infected intravenously with 100 colony-forming units (CFU) Salmonella typhimurium strain SL1344, and 106 or 107 CFU attenuated Salmonella typhimurium strain SL7207, and assessed as previously described, including for histological analyses6. All experiments were reviewed and approved by appropriate institutional review committees (University of Edinburgh ethical review committee, Comite d’Ethique Midi-Pyrenees, and LAGeSo Berlin), and were conducted in accordance with U.K., French, and German legislations, in compliance with European community council directive 68/609/EEC guidelines. Mice were of C57BL/6 strain, 6-12 weeks old at start of experiments, and of male and female genders. EAE experiments, and Salmonella infections were performed in a blinded manner, and identities of the mice were revealed upon termination of the experiment. No randomization was used. Estimation of size groups was based on our previous experience with these disease models, without a priori determination via power calculation.
B cell purification and activation
B cells were obtained by magnetic isolation using negative selection with αCD11b, αCD11c, and αCD43 microbeads (Miltenyi Biotec). B cells (>99% pure) were activated as previously described15 at 5×10⁵ cells/well in 96-well flat-bottom plates with LPS (Escherichia coli serotype 055:B5; Sigma-Aldrich), CpG-ODN-1826 (TIB MolBiol, Germany), PGN (Streptomyces species 79682; Sigma-Aldrich), agonistic αCD40 antibody (clone FGK-45, produced in house), mouse CD40L-expressing L47 cells (L47-CD40L+), or control L5 cells (L5-ctrl) as indicated. Culture supernatants were harvested at 72 h, and IL-10 concentrations measured by Bio-Plex (Bio-Rad, USA). For the microarray experiments, B cells purified as described above were further depleted of possible contaminants by another round of magnetic negative selection after re-labelling with αCD11b, αCD11c, αCD43, αCD90, and αDX5 microbeads (Miltenyi Biotec). B cells were activated with LPS (1μg/ml) or LPS (1μg/ml) + αCD40 (10 μg/ml). Dead cells were eliminated from the 24 h and 72 h activated culture by labelling with propidium iodide (PI), and sorting on FACS Diva (BD Biosciences). Cells were lysed in RLT buffer (Qiagen), and total RNA was extracted using RNeasy Mini Kit (Qiagen).
Gene array hybridization and data analysis
cRNA were hybridized on Affymetrix MG 430 2.0 arrays, using standard Affymetrix protocol after quality control with Agilent 2100 Bioanalyzer and quantification with NanoDrop ND-1000 spectrophotometer, as previously described29. The significantly differentially regulated genes were detected using a t-test based R-script, with p values adjusted using Benjamini Hochberg procedure. In order to be selected in a comparison of two conditions, each Affy IDs had to fulfill the following criteria: (i) be present in at least three of the four arrays for at least one of the two conditions compared, (ii) to have a mean signal intensity higher than 50 in at least one of the two conditions, and (iii) to show an adjusted p-value <0.01 (t-test) in the comparison of the two conditions. The genes differentially expressed between TLR4- and TLR4+CD40-activated B cells (t-test; p<0.01), and differentially modulated during B cell activation (t-test; p<0.01), were then selected and filtered using the gene ontology resource (www.geneontology.org) to focus on secreted molecules (Extended Data Fig. 1c). Seven genes fulfilled these criteria, among which five were uniquely increased in TLR4+CD40-stimulated B cells (Extended Data Fig. 1c). Hierarchical clustering was performed with the MeV program (version 4.8.1)30 using Pearson correlation and average Linkage.
Analysis of mRNA expression by B and plasma cells
Sorted B and plasma cells were lysed in Trizol, and RNA was prepared (AMS Biotechnology). After DNase treatment (Ambion), RNA was reverse-transcribed with a Reverse Transcription System (Promega). Quantitative RT-PCR was performed on an MX3005P QPCR System (Stratagene), with LightCycler FastStart DNA Master SYBR Green I (Roche). Transcripts were quantified using β-actin as standard, and the following forward (FP) and reverse (RP) primers (MWG Biotech): β-actin FP: 5′-TGGAATCCTGTGGCATCCATGAAAC-3′, β-actin RP: 5′-TAAAACGCAGCTCAGTAACAGTCC-3‘; EBi3 FP: 5‘-CGGTGCCCTACATGCTAAAT-3′, EBi3 RP: 5′- GCGGAGTCGGTACTTGAGAG-3′; p35 FP: 5′-CATCGATGAGCTGATGCAGT-3′, p35 RP: 5′-CAGATAGCCCATCACCCTGT-3′; IL-10 FP: 5′-AGC CGG GAA GAC AAT AAC TG-3′, IL-10 RP: 5′-CAT TTC CGA TAA GGC TTG G-3′; Blimp1 FP: 5′- GGC ATT CTT GGG AAC TGT GT-3′; Blimp1 RP: 5′- GAC AGA GGC CGA GTT TGA AG-3′; IRF4 FP: 5′- GCAGCTCACTTTGGATGACA-3′; IRF4 RP: 5′- CCAAACGTCACAGGACATTG-3′; Pax5 FP: 5′- AACTTGCCCATCAAGGTGTC-3′; Pax5 RP: 5′- CTGATCTCCCAGGCAAACAT-3′.
Western blot and immunoprecipitation
Activated B cells were treated with GolgiStop (BD Biosciences, Germany) to block protein secretion during the last 4 h of stimulation. B cells (2×10⁷) were lysed with 500 μl RIPA buffer (Thermo Fisher Scientific, USA) supplemented with protease inhibitors (Thermo Fisher Scientific, USA). Cells isolated from mice infected with Salmonella were directly lysed in RIPA buffer containing protease inhibitors. Protein concentrations of lysates were determined using the BCA Protein Assay Kit (Thermo Fisher Scientific, USA). Proteins were separated on a polyacrylamide gel and transferred to a PVDF membrane (Bio-Rad Laboratories, USA) using semi-dry blotting. EBi3, p35, and actin were detected using rabbit anti-EBi3 (M-75 polyclonal IgG, Santa Cruz Biotechnology, USA), rabbit anti-p35 (EPR5736 polyclonal IgG, Abcam, UK), or rabbit anti-actin (I-19 polyclonal Ab, Santa Cruz Biotechnology, USA) primary antibody, and horseradish peroxidase (HRP)-conjugated secondary anti-rabbit antibody (cat. number: 81-6120, Invitrogen, USA; or cat. number: 111-035-144, Jackson ImmunoResearch, USA) with ECL (GE Healthcare, UK) as HRP substrate. The chemiluminescence signal was measured using the Image-Reader LAS-3000 (Fujifilm, Japan). For immunoprecipitation supernatant from B cells activated with LPS+αCD40 (clone FGK-45, 10 μg/ml) were incubated overnight at 4°C with 2 μg/ml anti-p35 (C18.2, eBioscience). Immunoprecipitation was performed using μMACS Protein G Microbeads (Miltenyi Biotech), followed by immunoblot to detect EBi3.
B -T cell co-cultures
The protocol for B-T cell co-cultures was adapted from a previous report25. Briefly, B cells were magnetically sorted from pooled spleens and LN of B-p35−/− or B-WT mice on day 10 post-EAE induction as CD19+ cells (~98% pure), and Teff cells were FACS-sorted from the CD19-depleted fraction as previously described31. 50×104 B cells and 1×10⁴ CD4+CD25− T cells (Teff) were then co-cultured in the indicated combinations in presence of increasing concentrations of MOG35-55. After 48 h cultures received 1μCi 3H-thymidine, and 3H-thymidine incorporation was measured 16 h later with a Top-Count NXT liquid scintillation counter (Perkin Elmer). Before addition of 3H-thymidine, samples of culture supernatants were collected to quantify concentrations of IL-17, IFN-γ, GM-CSF and IL-6 using Bio-Plex (Bio-Rad).
Plasma cell purification
Plasma cells and B cells were obtained from C57BL/6, p35−/−, p35−/−EBi3−/−p40−/−, IL-10.eGFP, and p35−/−IL-10.eGFP mice on day 3 after infection with 107 CFU Salmonella (SL7207) by magnetic isolation using αCD138-PE (clone 281-2, BD Pharmingen) and α-PE microbeads (Miltenyi Biotec). The negative fraction was then subjected to FACS sorting to obtain high purity CD19+CD138− B cells. The positive fraction was then stained for CD22 (clone OX-97, Biolegend), and subjected to FACS sorting to obtain high purity plasma cells (CD138hi), and plasma cell subsets (CD138intCD22+, CD138hiCD22+, and CD138hiCD22− cells). For Western blot, CD138hi and CD138int cells were isolated as CD138+ plasma cells from infected mice by magnetic isolation using αCD138-PE (clone 281-2, BD Pharmingen) and α-PE microbeads (Miltenyi Biotec).
Single Cell PCR analysis
Single cells were sorted on a FACS Aria II (BD Biosciences) into a 96-well PCR plate, immediately frozen in liquid nitrogen and stored at −80°C until further use. For detection of respective transcripts a two-step PCR approach was used. Reverse transcription and the first PCR step were carried out in a one-step reaction using the QIAGEN OneStep RT-PCR kit according to the manufacturer’s instructions. As recommended in these instructions, specific nested primers (MWG Biotech) were used as follows: EBi3nested FP: 5‘-CCTTCATTGCCACTTACAGG-3′, EBi3nested RP: 5′- TAATCTGTGAGGTCCTGAGC-3′; p35nested FP: 5′- CATTCTAGACAAGGGCATGC-3′, p35nested RP: 5′-GTGATGGGAGAACAGATTCC-3′; IL-10nested FP: 5′- TCTTACTGACTGGCATGAGG-3′; IL-10nested RP: 5′- CTTCTACCAGGTAAAACTGG-3′; Blimp1nested FP: 5′-CGTGAAGTTTCAAGGACTGG-3′; Blimp1nested RP: 5′- GTGGTGGAACTCCTCTCTGG-3′. For validation of sorting β-actin primers were added to the reaction mixture. After this first reaction, an aliquot of the PCR product was loaded on an agarose gel, and only β-actin positive samples were considered to further analysis. A 100-fold dilution of the PCR product was subsequently used as template for the second PCR reaction using the primers described in the section “Analysis of mRNA expression by B and plasma cells”. Amplification of the respective transcript was verified on an agarose gel.
Additional reagents
Antibodies used in this study also included anti-Ly6C (clone AL21, cat number 557359, BD Pharmingen), anti-IFN-γ (clone XMG1.2, BD Pharmingen), anti-CD154 (cat number 130-092-105, Miltenyi Biotech), anti-CD62L (MEL14, in house).
Statistics
Statistical analysis was performed using GraphPad Prism (version 5.02 for Windows, GraphPad Software, USA). EAE data distribution did not differ from normal distribution, as evaluated using Kolmogorov-Smirnov test. Equality of variances between groups was assessed before analyses by ANOVA or t-test. Groups were compared using ANOVA, two-tailed t-test, or Wilcoxon test, as indicated in figure legends. t-test were modified using Welch’s correction in case of unequal variance. One-way and Two-way ANOVA were followed by Bonferroni post-test. No samples were excluded from analysis. Statistical analysis of the gene array data is described in “Gene array hybridization and data analysis”.
Extended Data
ACKNOWLEDGMENTS
We thank Heidi Schliemann, Heike Ruebsamen, Melania Spadaro, and Dieter Jenne for assistance and support. We thank Max Loehning for providing IL-12p40-deficient mice, and Shizuo Akira for providing TLR2- and TLR4-deficient mice. We thank Olivier Neyrolles for help with some of the in vivo experiments. We thank Eckart Schott for help with the AST/ALT measurements. S.F. is supported by grants from the Deutsche Forschungsgemeinschaft (SFB-650, TRR-36, TRR-130, FI-1238/02), Hertie Stiftung, and an advanced grant from the Merieux Institute. C.D and T.D. are supported by the Deutsche Forschungsgemeinschaft (SFB-650, Do491/7-2, 8-2). P.B and L.J are supported by INRA. AB-O is supported by a CIHR/MSSC New Emerging Team grant in Clinical Autoimmunity. Work in S.M.A.’s laboratory was supported by grants from the U.K. Medical research Council and the Wellcome Trust. E.M. is supported by the Clinical Competence Network for Multiple Sclerosis, and SFB-TR128.
Footnotes
SUPPLEMENTARY INFORMATION is linked to the online version of the paper at www.nature.com/nature
The authors have no competing financial interests.
REFERENCES
- 1.Fillatreau S, Gray D, Anderton SM. Not always the bad guys: B cells as regulators of autoimmune pathology. Nature reviews. Immunology. 2008;8:391–397. doi: 10.1038/nri2315. doi:10.1038/nri2315. [DOI] [PubMed] [Google Scholar]
- 2.Fillatreau S. Novel regulatory functions for Toll-like receptor-activated B cells during intracellular bacterial infection. Immunological reviews. 2011;240:52–71. doi: 10.1111/j.1600-065X.2010.00991.x. doi:10.1111/j.1600-065X.2010.00991.x. [DOI] [PubMed] [Google Scholar]
- 3.Fillatreau S, Sweenie CH, McGeachy MJ, Gray D, Anderton SM. B cells regulate autoimmunity by provision of IL-10. Nature immunology. 2002;3:944–950. doi: 10.1038/ni833. doi:10.1038/ni833. [DOI] [PubMed] [Google Scholar]
- 4.Mauri C, Gray D, Mushtaq N, Londei M. Prevention of arthritis by interleukin 10-producing B cells. The Journal of experimental medicine. 2003;197:489–501. doi: 10.1084/jem.20021293. [DOI] [PMC free article] [PubMed] [Google Scholar]
- 5.Mizoguchi A, Mizoguchi E, Takedatsu H, Blumberg RS, Bhan AK. Chronic intestinal inflammatory condition generates IL-10-producing regulatory B cell subset characterized by CD1d upregulation. Immunity. 2002;16:219–230. doi: 10.1016/s1074-7613(02)00274-1. [DOI] [PubMed] [Google Scholar]
- 6.Neves P, et al. Signaling via the MyD88 adaptor protein in B cells suppresses protective immunity during Salmonella typhimurium infection. Immunity. 2010;33:777–790. doi: 10.1016/j.immuni.2010.10.016. doi:10.1016/j.immuni.2010.10.016. [DOI] [PubMed] [Google Scholar]
- 7.Duddy M, et al. Distinct effector cytokine profiles of memory and naive human B cell subsets and implication in multiple sclerosis. Journal of immunology. 2007;178:6092–6099. doi: 10.4049/jimmunol.178.10.6092. [DOI] [PubMed] [Google Scholar]
- 8.Jagannathan M, et al. Toll-like receptors regulate B cell cytokine production in patients with diabetes. Diabetologia. 2010;53:1461–1471. doi: 10.1007/s00125-010-1730-z. doi:10.1007/s00125-010-1730-z. [DOI] [PMC free article] [PubMed] [Google Scholar]
- 9.Benedetti L, et al. Relapses after treatment with rituximab in a patient with multiple sclerosis and anti myelin-associated glycoprotein polyneuropathy. Archives of neurology. 2007;64:1531–1533. doi: 10.1001/archneur.64.10.1531. doi:10.1001/archneur.64.10.1531. [DOI] [PubMed] [Google Scholar]
- 10.Goetz M, Atreya R, Ghalibafian M, Galle PR, Neurath MF. Exacerbation of ulcerative colitis after rituximab salvage therapy. Inflammatory bowel diseases. 2007;13:1365–1368. doi: 10.1002/ibd.20215. doi:10.1002/ibd.20215. [DOI] [PubMed] [Google Scholar]
- 11.El Fassi D, Nielsen CH, Kjeldsen J, Clemmensen O, Hegedus L. Ulcerative colitis following B lymphocyte depletion with rituximab in a patient with Graves’ disease. Gut. 2008;57:714–715. doi: 10.1136/gut.2007.138305. doi:10.1136/gut.2007.138305. [DOI] [PubMed] [Google Scholar]
- 12.Dass S, Vital EM, Emery P. Development of psoriasis after B cell depletion with rituximab. Arthritis and rheumatism. 2007;56:2715–2718. doi: 10.1002/art.22811. doi:10.1002/art.22811. [DOI] [PubMed] [Google Scholar]
- 13.Wilson MS, et al. Helminth-induced CD19+CD23hi B cells modulate experimental allergic and autoimmune inflammation. European journal of immunology. 2010;40:1682–1696. doi: 10.1002/eji.200939721. doi:10.1002/eji.200939721. [DOI] [PMC free article] [PubMed] [Google Scholar]
- 14.Su Y, Zhang AH, Noben-Trauth N, Scott DW. B-Cell Gene Therapy for Tolerance Induction: Host but Not Donor B-Cell Derived IL-10 is Necessary for Tolerance. Frontiers in microbiology. 2011;2:154. doi: 10.3389/fmicb.2011.00154. doi:10.3389/fmicb.2011.00154. [DOI] [PMC free article] [PubMed] [Google Scholar]
- 15.Lampropoulou V, et al. TLR-activated B cells suppress T cell-mediated autoimmunity. Journal of immunology. 2008;180:4763–4773. doi: 10.4049/jimmunol.180.7.4763. [DOI] [PubMed] [Google Scholar]
- 16.Devergne O, Birkenbach M, Kieff E. Epstein-Barr virus-induced gene 3 and the p35 subunit of interleukin 12 form a novel heterodimeric hematopoietin. Proceedings of the National Academy of Sciences of the United States of America. 1997;94:12041–12046. doi: 10.1073/pnas.94.22.12041. [DOI] [PMC free article] [PubMed] [Google Scholar]
- 17.Collison LW, et al. The inhibitory cytokine IL-35 contributes to regulatory T-cell function. Nature. 2007;450:566–569. doi: 10.1038/nature06306. doi:10.1038/nature06306. [DOI] [PubMed] [Google Scholar]
- 18.Niedbala W, et al. IL-35 is a novel cytokine with therapeutic effects against collagen-induced arthritis through the expansion of regulatory T cells and suppression of Th17 cells. European journal of immunology. 2007;37:3021–3029. doi: 10.1002/eji.200737810. doi:10.1002/eji.200737810. [DOI] [PubMed] [Google Scholar]
- 19.Villarino A, et al. The IL-27R (WSX-1) is required to suppress T cell hyperactivity during infection. Immunity. 2003;19:645–655. doi: 10.1016/s1074-7613(03)00300-5. [DOI] [PubMed] [Google Scholar]
- 20.Brentano F, et al. Abundant expression of the interleukin (IL)23 subunit p19, but low levels of bioactive IL23 in the rheumatoid synovium: differential expression and Toll-like receptor-(TLR) dependent regulation of the IL23 subunits, p19 and p40, in rheumatoid arthritis. Annals of the rheumatic diseases. 2009;68:143–150. doi: 10.1136/ard.2007.082081. doi:10.1136/ard.2007.082081. [DOI] [PubMed] [Google Scholar]
- 21.Kuchroo VK, et al. Cytokines and adhesion molecules contribute to the ability of myelin proteolipid protein-specific T cell clones to mediate experimental allergic encephalomyelitis. Journal of immunology. 1993;151:4371–4382. [PubMed] [Google Scholar]
- 22.Park H, et al. A distinct lineage of CD4 T cells regulates tissue inflammation by producing interleukin 17. Nature immunology. 2005;6:1133–1141. doi: 10.1038/ni1261. doi:10.1038/ni1261. [DOI] [PMC free article] [PubMed] [Google Scholar]
- 23.Bettini M, Castellaw AH, Lennon GP, Burton AR, Vignali DA. Prevention of autoimmune diabetes by ectopic pancreatic beta-cell expression of interleukin-35. Diabetes. 2012;61:1519–1526. doi: 10.2337/db11-0784. doi:10.2337/db11-0784. [DOI] [PMC free article] [PubMed] [Google Scholar]
- 24.McGeachy MJ, Stephens LA, Anderton SM. Natural recovery and protection from autoimmune encephalomyelitis: contribution of CD4+CD25+ regulatory cells within the central nervous system. Journal of immunology. 2005;175:3025–3032. doi: 10.4049/jimmunol.175.5.3025. [DOI] [PubMed] [Google Scholar]
- 25.Weber MS, et al. B-cell activation influences T-cell polarization and outcome of anti-CD20 B-cell depletion in central nervous system autoimmunity. Annals of neurology. 2010;68:369–383. doi: 10.1002/ana.22081. doi:10.1002/ana.22081. [DOI] [PMC free article] [PubMed] [Google Scholar]
- 26.Mittrucker HW, Kaufmann SH. Immune response to infection with Salmonella typhimurium in mice. Journal of leukocyte biology. 2000;67:457–463. doi: 10.1002/jlb.67.4.457. [DOI] [PubMed] [Google Scholar]
- 27.Barr TA, et al. B cell depletion therapy ameliorates autoimmune disease through ablation of IL-6-producing B cells. The Journal of experimental medicine. 2012;209:1001–1010. doi: 10.1084/jem.20111675. doi:10.1084/jem.20111675. [DOI] [PMC free article] [PubMed] [Google Scholar]
- 28.Chan YH, et al. Absence of the transcriptional repressor Blimp-1 in hematopoietic lineages reveals its role in dendritic cell homeostatic development and function. Journal of immunology. 2009;183:7039–7046. doi: 10.4049/jimmunol.0901543. doi:10.4049/jimmunol.0901543. [DOI] [PubMed] [Google Scholar]
Additional references for Methods
- 29.Biesen R, et al. Sialic acid-binding Ig-like lectin 1 expression in inflammatory and resident monocytes is a potential biomarker for monitoring disease activity and success of therapy in systemic lupus erythematosus. Arthritis and rheumatism. 2008;58:1136–1145. doi: 10.1002/art.23404. doi:10.1002/art.23404. [DOI] [PubMed] [Google Scholar]
- 30.Saeed AI, et al. TM4: a free, open-source system for microarray data management and analysis. BioTechniques. 2003;34:374–378. doi: 10.2144/03342mt01. [DOI] [PubMed] [Google Scholar]
- 31.Hoehlig K, et al. Activation of CD4(+) Foxp3(+) regulatory T cells proceeds normally in the absence of B cells during EAE. European journal of immunology. 2012;42:1164–1173. doi: 10.1002/eji.201142242. doi:10.1002/eji.201142242. [DOI] [PubMed] [Google Scholar]
