Structure of the toxic core of α-synuclein from invisible crystals (original) (raw)
. Author manuscript; available in PMC: 2016 Mar 24.
Published in final edited form as: Nature. 2015 Sep 9;525(7570):486–490. doi: 10.1038/nature15368
Summary
The protein α-synuclein is the main component of Lewy bodies, the neuron-associated aggregates seen in Parkinson’s disease and other neurodegenerative pathologies. An 11-residue segment, which we term NACore, appears responsible for amyloid formation and cytotoxicity of α-synuclein. Here we report crystals of NACore having dimensions smaller than the wavelength of visible light and thus invisible by optical microscopy. Thousands of times too small for structure determination by synchrotron x-ray diffraction, these crystals have yielded an atomic resolution structure by the frontier method of Micro-Electron Diffraction. The 1.4 Å resolution structure demonstrates for the first time that this method can determine previously unknown protein structures and here yields the highest resolution achieved by any cryo-electron microscopy method to date. The structure reveals protofibrils built of pairs of face-to-face β-sheets. X-ray fiber diffraction patterns show the similarity of NACore to toxic fibrils of full-length α-synuclein. The NACore structure, together with that of a second segment, inspires a model for most of the ordered portion of the toxic, full-length α-synuclein fibril, opening opportunities for design of inhibitors of α-synuclein fibrils.
The presynaptic protein α-synuclein (α-syn), found in both soluble and membrane-associated fractions of the brain, aggregates in Parkinson’s Disease (PD). These aggregates are the main component of Lewy bodies, the defining histological feature of this neurodegenerative disease, and have been shown to accompany neuronal damage1. Two other observations point to aggregated α-syn as a molecular cause of Parkinson’s disease2. The first is that families with inherited forms of PD carry mutations in α-syn, such as A53T, and abundant Lewy bodies3,4,5. The second is that families with duplicated or triplicated genes encoding α-syn develop early onset PD, presumably because at high local concentrations α-syn is forced into amyloid6,7.
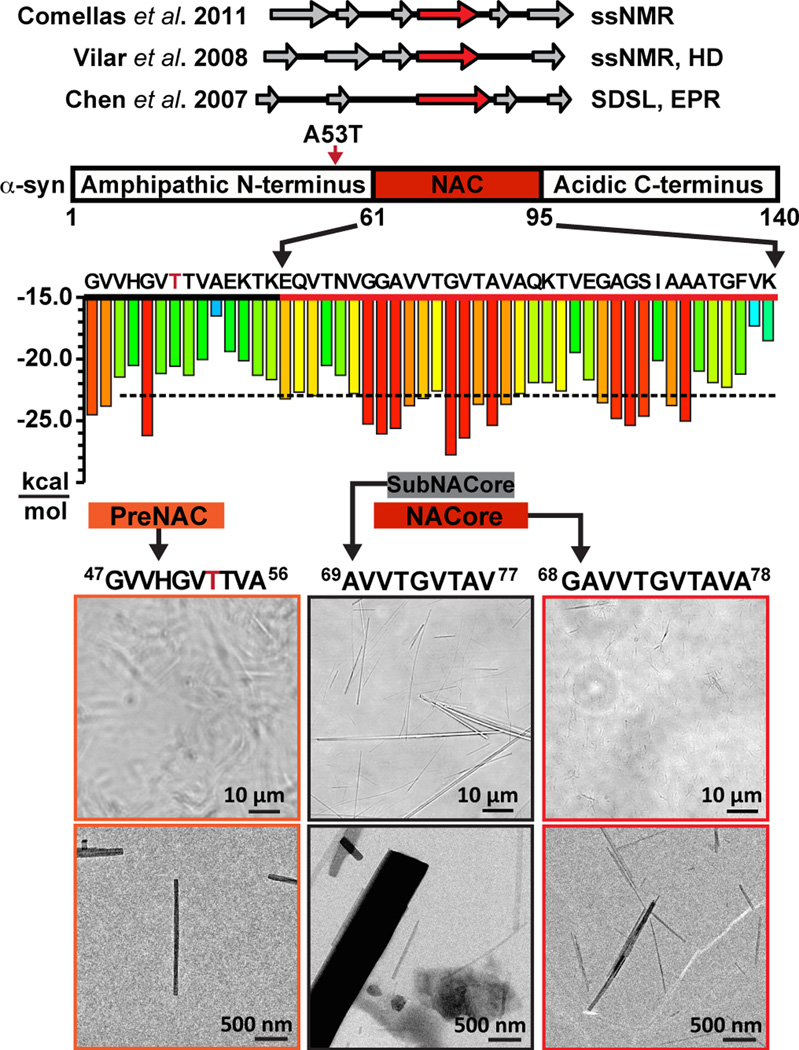
Our focus is on a central segment of α-syn, residues 68–78, that we call NACore (Figure 1), because of its critical role in both the aggregation and cytotoxicity of α-syn. NACore lies within a 35 residue domain of α-syn termed NAC (Non Amyloid-β Component, originally reported to be deposited with amyloid β in the brains of Alzheimer’s disease patients), which the studies of others have established as necessary and sufficient for aggregation and toxicity of α-syn8,9,10,11,12(Extended Data Figure 1). For example, deletion of residues 71–82 prevents aggregation of α-syn in vitro, and abolishes both its aggregation and neurotoxicity in a drosophila model of PD12. Yet this segment in isolation from the rest of α-syn readily forms amyloid fibrils and is highly cytotoxic13,14. Also, β-synuclein, the close homolog of α-syn, which does not aggregate and is not found in Lewy bodies, differs in sequence from α-syn principally by the lack of residues 74–84 that are part of NACore9.
Figure 1.
NACore (residues 68–78) is the fibril-forming core of the NAC domain of full-length α-syn. Top: beta strands indicated byNMR and EPR17,40,41. Center: red 6-residue segments are predicted to form amyloid fibrils42. The A53T early-onset Parkinson mutation is indicated by a red arrow and red letter T. Bottom: the miniscule size of the preNAC and NACore crystals used for MicroED is illustrated by this comparison to SubNACore microcrystals (middle. Scale comparisons are illustrated on two magnifications using phase contrast light microscope images and electron micrographs, in which individual NACore and PreNAC nanocrystals are indistinguishable by light microscopy.
Segments outside NAC also influence the aggregation of α-syn and have been associated with fibril structure15–17. In brain extracts from patients with multiple system atrophy, the core of α-syn fibrils extends approximately from residue 30 to 10018. Also the A53T mutation of α-syn can accelerate its transition into the amyloid state, and hence accelerate PD19. This mutation was found to induce the onset of PD at an early age20, and consistent with this, α-syn containing this A53T mutation forms fibrils in vitro more rapidly than wild type3. Thus we carried out screens for crystals of peptide segments within the NAC domain and adjacent regions, seeking structural information on the molecular basis of aggregation and toxicity of α-syn.
Extensive crystal screens of two segments, NACore, residues 68GAVVTGVTAVA78, and PreNAC, 47GVVHGVTTVA56, seemingly produced non-crystalline, amorphous aggregates. But on examination by electron microscopy, we found the aggregates to be clusters of elongated nanocrystals only 50–300 nm in cross section and thus invisible by conventional light microcopy (Figure 1). We confirmed well-ordered crystallinity of NACore at both the SACLA and LCLS free electron lasers. We also found that a 9-residue fragment within the NACore, which we term SubNACore, 69AVVTGVTAV77, yielded crystals 1,000 – 10,000 times larger in volume than the NACore nanocrystals (Figure 1). We were therefore able to apply synchrotron methods21,22 to these larger crystals to determine the structure of their amyloid-like fibrils. Although this 9-residue fragment is missing only two residues compared with NACore, it is not as toxic23, offering insight described below, into the toxicity of α-syn.
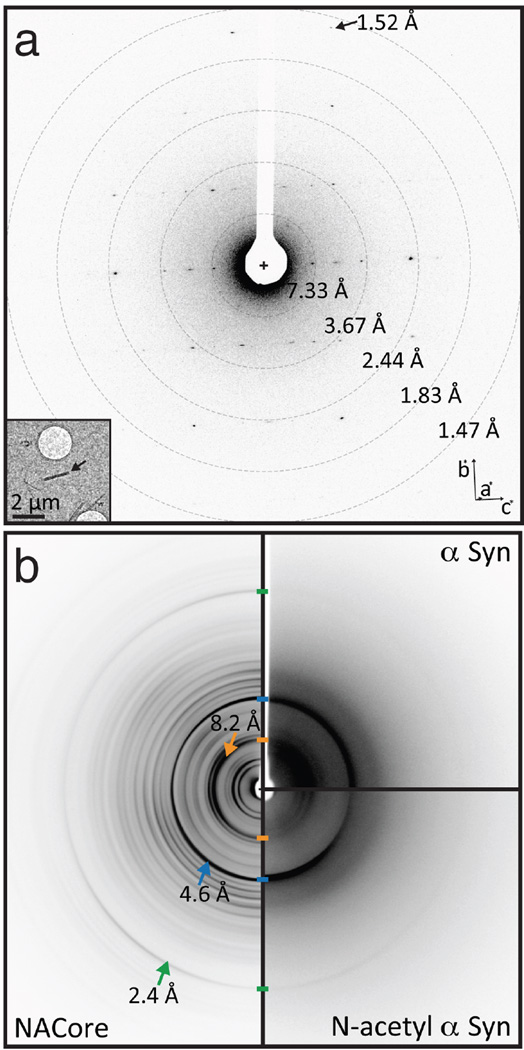
To determine the structure of the invisible crystals of NACore and PreNAC, we turned to Micro-Electron Diffraction (MicroED)24–26. In MicroED, an extremely low dose electron beam is directed on a nanocrystal within a transmission electron microscope under cryogenic conditions, yielding diffraction patterns such as that in Figure 2. As the wavelength used in our experiments at 200keV is very small (0.025Å), the Ewald sphere is essentially flat yielding diffraction patterns that closely resemble a 2D slice through 3D reciprocal space. As the crystal is continuously rotated in the beam, a series of such diffraction patterns is collected25. Scaling together diffraction data collected from multiple crystals produces a full 3D diffraction dataset. MicroED has been successfully applied to the well-known structures of hen egg-white lysozyme26,25, bovine liver catalase27 and Ca2+-ATPase28. But NACore and PreNAC are the first previously unknown structures determined by MicroED.
Figure 2.
Diffraction from NACore nano crystals is similar to that from full length α-syn fibrils. a, Single crystal electron diffraction pattern obtained duringMicroED data collection (see text). Equally spaced concentric rings denote resolution shells. An arrow points to The highest resolution spot is at 1.52 Å (arrow). The inset shows the overfocused image of the diffracting crystal (arrow), which is ~1480 × 200 × 200 nm. b, Composite of fibril diffraction patterns from α-syn preparations and NACore. Full-length α-syn reveals reflections that match those from NACore and N-terminally acetylated α-syn. The two patterns of full-length α-syn share with NACore three major peaks denoted by arrows: 8.2 Å (orange), 4.6 Å (blue), and 2.4 Å (green). The origin of these peaks can be traced to the (0 0 2), [(1,1,1),(−1 1 1)], and (0 2 0) planes in the NACore structure, respectively. The reflection at 8.2Å likely arises from adjacent pairs of β-sheets.
For NACore and PreNAC, we collected microED patterns from nano-crystals that lay preferentially oriented, flat on the surface of a holey carbon Quantifoil grid, in a frozen-hydrated state. Grids were first screened for appropriately sized crystals, and candidate crystals screened for diffraction. We used crystals showing strong diffraction for data collection by continuous unidirectional rotation about a fixed axis, acquiring a series of diffraction frames at fixed time intervals25. The needle-shaped crystals typically exceeded the length needed for MicroED; those that were unbent and 100 to 300 nm wide produced the best diffraction patterns. Data from multiple crystals were integrated, scaled and merged together (Extended Data Table 1).
The multi-crystal NACore and PreNAC datasets were phased by molecular replacement, using the atomic model of SubNACore and an ideal beta strand model, respectively, as probes. As shown in Extended Data Figure 2, diffraction phases calculated from the SubNACore probe structure and NACore structure factors yielded a difference density map (Extended Data Figure 2), which clearly reveals the positions of the missing residues, after subsequent refinement, two water molecules, and several hydrogen atoms (Figure 3e). Full models of NACore and PreNAC were refined against the MicroED data, producing structures at 1.4Å resolution with acceptable R-factors (Extended Data Table 1). Electron scattering factors were used in the refinement calculations29.
Figure 3.
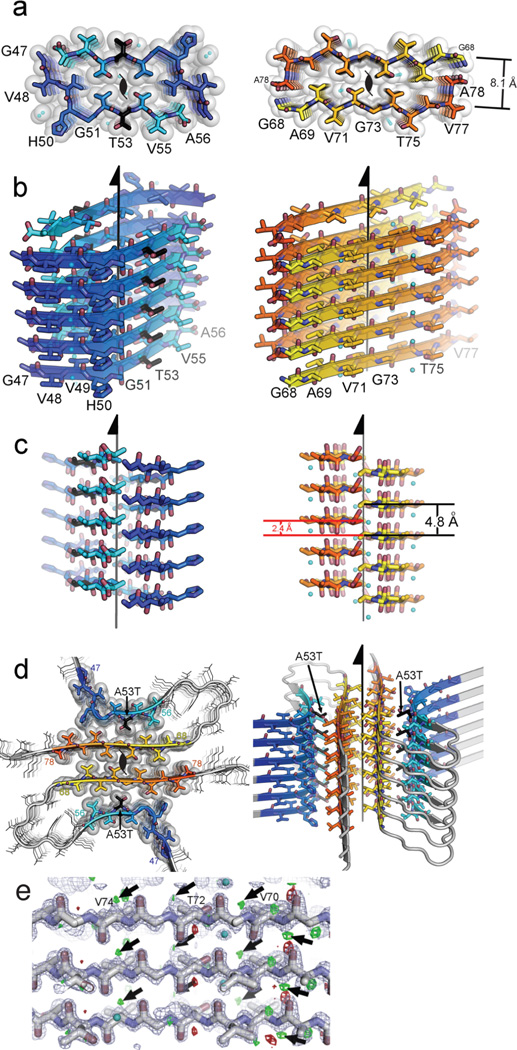
Structure of the amyloid core of α-syn. a, The crystal structure of NACore (orange) reveals pairs of sheets as in the spines of amyloid fibrils. The A53T mutation in PreNAC is shown in black. The sheets in both structures are related by the 21 fibril axes shown in black. The gaps left by the interface are filled with water molcules which hydrogen-bond to the threonine residues (partly showing aqua spheres). b, and c, are orthogonal views of the fibrillar assemblies. d, A speculative model of an α-syn protofibril containing the A53T mutation (black), where the strong interface of NACore (orange) forms the core of the fibril and its weaker interface interacts with PreNAC (blue). e, The locations of 5 out of a possible 73 protons are suggested by small, positive Fo-Fc density (green contoured at 2.8σ, shown by arrows.. The blue mesh is 2Fo-Fc density contoured at 1.4 σ.
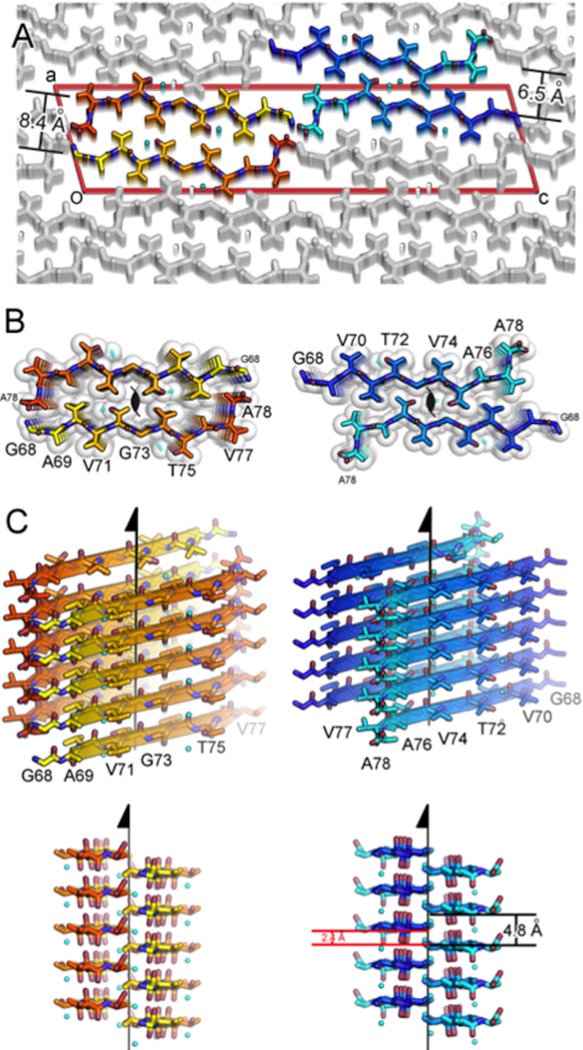
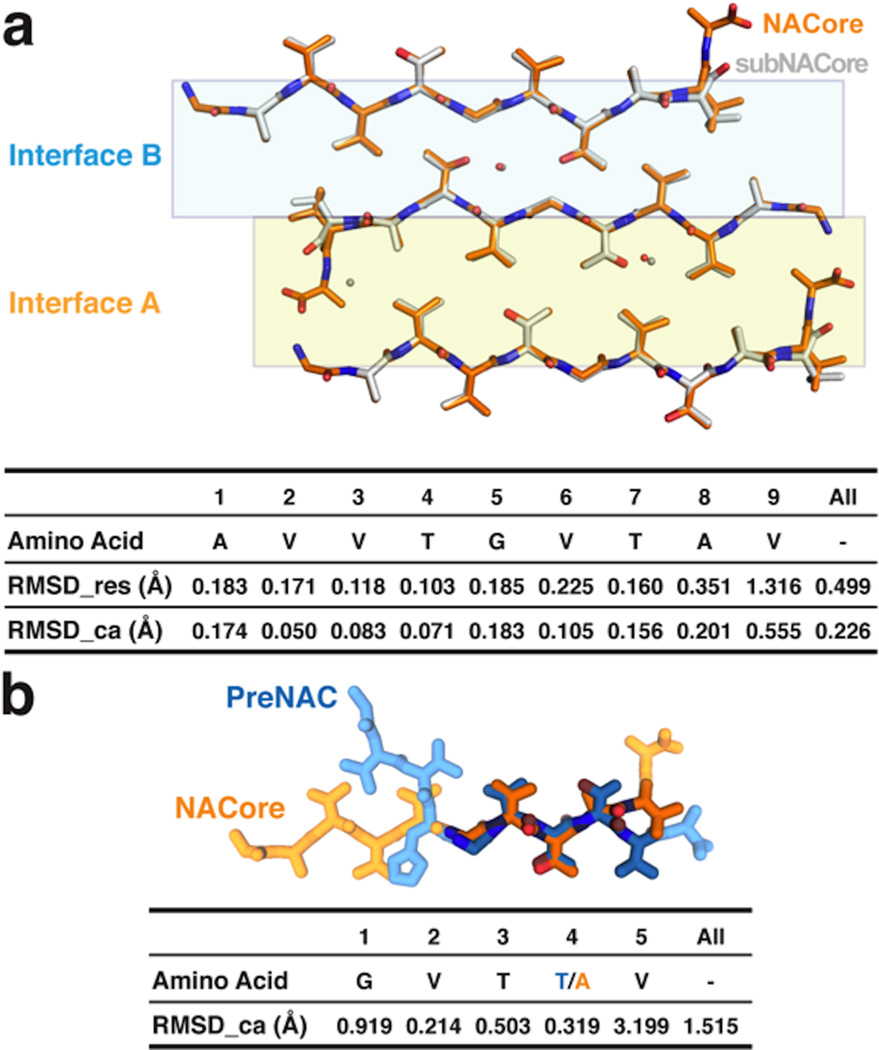
The structure of the NACore peptide chain is a nearly fully extended β-strand (Figure 3 and Extended Data Figure 3). These NACore strands stack in-register into β-sheets, as had been predicted by site-directed spin labeling16,17. The sheets are paired (Figure 3b), as is usual in amyloid spines, and the pairs of sheets form typical steric-zipper protofilaments (Figure 3c), previously seen as the spines in many amyloid-like fibrils formed from short segments of fibril-forming proteins21. The unusual features of this steric zipper are that the 11-residue width of the zipper is longer than has been previously observed22, and each pair of sheets contains two water molecules, each associated with a threonine sidechain, within the interface instead of being completely dry. Also, in our crystals of NACore, each sheet forms two snug interfaces: Interface A with 268 Å2 of buried accessible surface area per chain, is more extensive and presumably stronger than Interface B (167 Å2), because the terminal residues of the chains in opposing sheets bend towards each other (Figure 3, Extended Data Fig 4). The structure of PreNAC reveals a peptide chain that forms a β-strand kinked at residue glycine 51. These strands are arranged into pairs of β-sheets that like the NACore structure interdigitate to form steric zipper protofilaments (Figure 3). Of special note, a five residue segment of PreNAC (51GVTTV55) differs in only one residue from a five residue segment of NACore (73GVTAV77) and their backbones and identical sidechains superimpose closely with an alpha carbon RMS deviation of 1.5Å (Extended Data Figure 4). This means that weaker interface B of NACore mimics a hypothetical interface between NACore and PreNAC (Figure 3d). Below we suggest the significance of the possible contact between these two segments of α-syn.
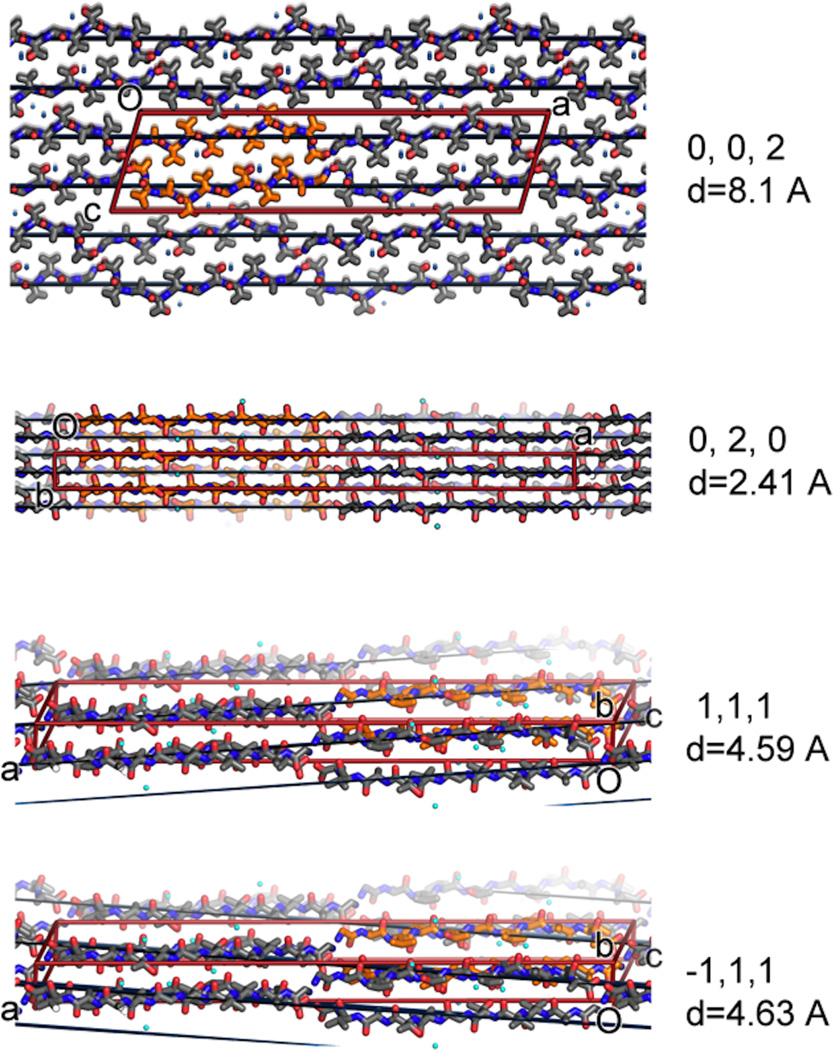
The relevance of the structure of NACore to fibrils of full length α-syn is established by the resemblance of their diffraction patterns. Specifically, the fiber diffraction pattern of aligned fibrils of full-length and N-terminally acetylated30 α-syn protein display the same principal peaks as the diffraction of aligned NACore nanocrystals (Figure 2). All three fibrils display the strong reflection at 2.4Å in their diffraction patterns. As seen in Figure 3 and Extended Data Figure 5 this reflection arises in NACore because one β-sheet of the steric zipper is translated along the fiber axis with respect to the other β-sheet by 2.4Å, one half the 4.8Å spacing between β-strands, permitting the two sheets to interdigitate tightly together. All three share a strong 4.6Å reflection, which in NACore results from both the stacking of β-strands and the staggering between adjacent β-sheets of the steric zipper, while a shared reflection at near 8.2Å likely arises from the distance between the adjacent pairs of β-sheets that make up the α-syn fibril (Figure 2 and Extended Data Figure 5). This comparison of fiber diffraction patterns (Extended Data Table 2) strongly suggests that the structure of NACore is similar to the spine of our toxic fibrils of full α-syn.
The combined structures of NACore and PreNAC allow us to construct a speculative model for much of the ordered segments of the A53T early onset mutant α-syn (Figure 3d). Experimental support of this model comes from the agreement of its simulated fiber diffraction with the measured diffraction patterns of α-syn and N-acetyl α-syn fibrils as well as aligned NACore nanocrystals (Extended Data Table 2). Above we hypothesized that the weaker Interface B of NACore might mimic an intramolecular interaction of PreNAC with NACore (Figure 3). In fact, the interacting sidechains in the weaker NACore Interface B (G73, T75, and V77) are identical to the sidechains (G51, T53, V55) interacting in the hypothetical interface of PreNAC with NACore. Assuming that this interface actually forms in fibrils of the early onset mutant A53T, we have built the model shown in Figure 3d. The hypothetical interface of this model offers a possible reason for a greater propensity of the A53T mutant to aggregate than the wild type sequence, conceivably leading to early onset of PD.
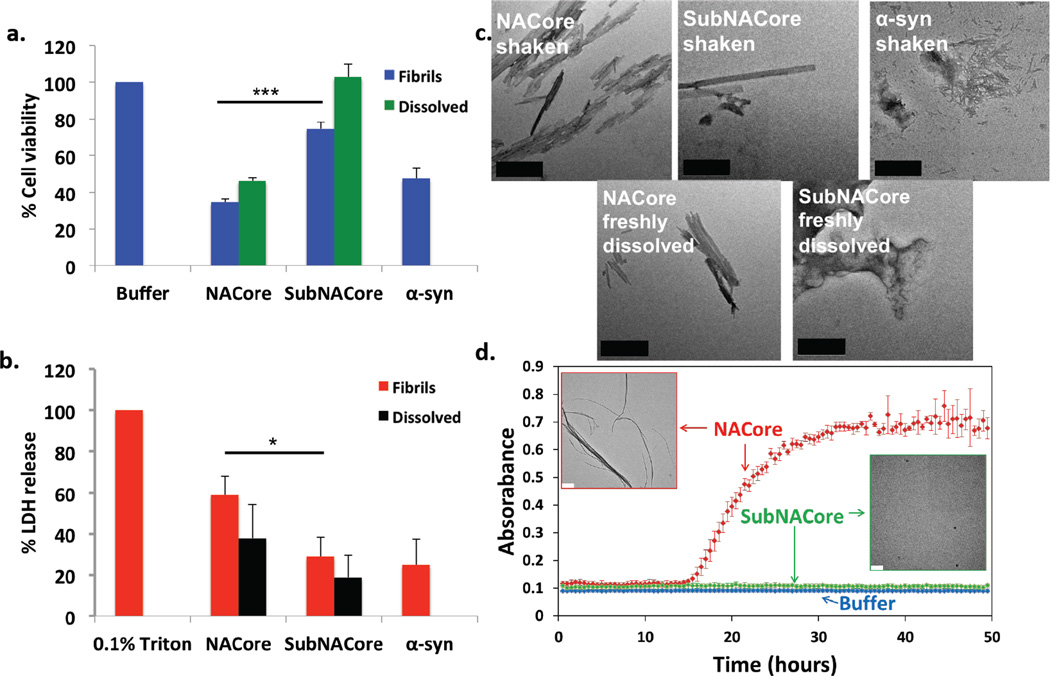
The identity and structure of the cytotoxic amyloid formed by α-syn remains a subject of intensive research19,31,32,33,34,35. The weight of evidence over the past decade has tilted scientific opinion from the fully developed amyloid fibrils found in Lewy bodies as the toxic entities to smaller, transient amyloid oligomers. Yet recently, quantitative arguments have been put forward in favor of fibrils36. Our experiments of the cytotoxicity of NACore on neuroblastoma cells (Figure 4) are consistent with the view that fibrils are toxic: we find that NACore shaken and aggregated for 72 hours displays abundant fibrils, is more toxic than freshly dissolved NACore (Figure 4) and is comparably toxic to similarly aggregated full α-syn. We also find greater cytotoxicity of NACore than SubNACore, which is shorter by two residues. This is consistent with the more rapid fibril formation of NACore than of SubNACore (Figure 4d). These observations do not rule out the formation of a non-fibrillar, oligomeric assembly, present, but undetected, in our aggregated samples of NACore and α-syn. Of course, NACore is merely a fragment of full length α-syn, and lacks most of the membrane-binding motifs of the N-terminus of the protein, which have been implicated in membrane disruption37,38. Yet it is clear that NACore is the minimum entity that recapitulates all the features of full length a-syn aggregation and toxicity.
Figure 4.
NACore aggregates faster than SubNACore and is more cytotoxic to cultured cells. Cytotoxicity of NACore, SubNACore and α-syn measured on PC12 cells using a, MTT assay and b, LDH release assay. In both assays NACore is more toxic than SubNACore. Also, shaken fibrils are more toxic than an equal concentration of freshly dissolved sample. Results shown as mean ± standard error of the mean from triplicate samples. A t-test was used to measure statistical significance * <0.05, **<0.01,***<0.001. c, Representative electron micrographs of NACore, SubNACore and α-syn samples tested for cytotoxicity. NACore and α-syn show abundant fibrils but SubNACore few. NACore also forms fibrils immediately upon dissolving whereas SubNACore shows no fibers, but instead amorphous aggregates. Scale 500nm. d, NACore and SubNACore were aggregated in identical conditions and monitored by turbidity. NACore begins to aggregate in 15 hours while SubNACore forms no aggregates for up to 50 hours. Electron microscopy of the samples at 50 hours confirmed the turbidity readings (insets, scale 2 µm), with error bars denoting standard deviation from triplicates.
The miniscule size of NACore crystals is typical of amyloid and also of various other biological crystals of interest. For amyloid crystals, our speculation is that the tiny size is a consequence of the natural twist of β-sheets that form the protofilaments of the fibrils. The crystal lattice restrains the twist, creating a strain in these crystals, which increases as crystals grow. Eventually this strain prevents further addition of β-strands, limiting the thickness of the needle crystals. In our experience, longer segments (for example, 11 residues compared to 9 residues) limit crystal growth even more; in the case of 11-residue NACore and 10-residue PreNAC, the strain produces nanocrystals, invisible by optical microscopy. These crystals are too small for mounting and conventional synchrotron data collection, but are ideally suited for analysis by MicroED. Our structures of NACore and PreNAC demonstrate that MicroED is capable of determining new and accurate structures of biological material at atomic resolution. This finding paves the path for applications of MicroED to other biological substances of importance, for which only nanocrystals can be grown. In our particular application, we have been able to learn the atomic arrangement of the core of the crucial NAC domain. This opens opportunities for structure-based design of inhibitors of amyloid formation of α–syn39.
Extended Data and Supplementary Information for: Structure of the toxic core of α-synuclein from invisible crystals
Methods
Crystallization
Microcrystals of SubNACore, 69AVVTGVTAV77, were grown from synthetic peptide purchased from CS Bio. Crystals were grown at room temperature by hanging drop vaporization. Lyophilized peptide was dissolved in water at 2.9 mg/ml concentration in 48 mM lithium hydroxide. Peptide was mixed in a 2:1 ratio with reservoir containing 0.9 M ammonium phosphate, and 0.1M sodium acetate pH 4.6.
Nanocrystals of NACore, 68GAVVTGVTAV78, were grown from synthetic peptide purchased from CS Bio. Ten batches of synthesized peptide (CSBio) at a concentration of 1 mg/ml in sterile water were shaken at 37°C on a Torrey Pines orbital mixing plate at speed setting 9, overnight. The insoluble material was washed in 30% (w/v) glycerol then stored in water at room temperature before diffraction. The sample contained a mixture of fibrils and crystals.
Nanocrystals of PreNAC, 47GVVHGVTTVA56, were grown from synthetic peptide purchased from InnoPep. Crystallization trials of synthesized peptide were prepared in batch. Peptide was weighed and dissolved in sterile-filtered 50mM phosphate buffer pH 7.0 with 0.1% DMSO at a concentration of 5mg/ml. This solution was shaken at 37°C on a Torrey Pines orbital mixing plate at speed setting 9, overnight.
Data Collection and Processing
X-ray diffraction data from microcrystals of SubNACore were collected using synchrotron radiation at the Advanced Photon Source, Northeast Collaborative Access Team micro focus beam line 24-ID-E. The beam line was equipped with an ADSC Quantum 315 CCD detector. Data from a single crystal were collected in 5° wedges at a wavelength of 0.9791 Å using a 5 µm beam diameter. We used data from three different sections along the needle axis. The crystals were cryo-cooled (100 K) for data collection. Data were processed and reduced using Denzo/Scalepack from the HKL suite of programs43.
Electron diffraction data from nanocrystals of NACore and PreNAC were collected using MicroED techniques25,26. These nanocrystals typically clump together. To break up the clumps, an approximately 100µL volume of nanocrystals was placed in a sonication bath for 30 minutes. Nanocrystals were deposited onto a Quantifoil holey-carbon EM grid in a 2–3µl drop after appropriate dilution, which optimized for crystal density on the grid. All grids were then blotted and vitrified by plunging into liquid ethane using a Vitrobot Mark IV (FEI), then transferring to liquid nitrogen for storage. Frozen hydrated grids were transferred to a cryo-TEM using a Gatan 626 cryo-holder. Diffraction patterns and crystal images were collected using an FEG-equipped FEI Tecnai F20 TEM operating at 200 kV and recorded using a bottom mount TVIPS F416 CMOS camera with a sensor size of 4000 squared pixels, each 15.6 µm in size per square dimension. Diffraction patterns were recorded by operating the detector in rolling shutter mode with 2×2 pixel binning, producing a final image 2000 squared pixels in size. Individual image frames were taken with exposure times of 3–4 seconds per image, using a selected area aperture with an illuminating spot size of approximately one micron. This geometry equates to an electron dose of less than 0.1 e−/Å2 per second. During each exposure, crystals were continuously rotated within the beam at a rate of 0.3° per second, corresponding to 1.2° wedge per frame. Diffraction data were collected from several crystals each oriented differently with respect to the rotation axis. These data sets each spanned wedges of reciprocal space ranging from 40° to 80°.
X-ray diffraction data from nanocrystals of NACore were collected using XFEL radiation at the CXI instrument (Coherent X-ray Imaging) at the Linear Coherent Light Source (LCLS)-SLAC. The photon energy of the X-ray pulses was 8.52 keV (1.45 Å). Each 40 fs pulse contained up to 6 × 10¹¹ photons at the sample position taking into account a beam line transmission of 60%. The diameter of the beam was approximately 1 µm. We used a concentration of approximately 25 µl of pelleted material suspended in 1 mL water. The sample was injected into the XFEL beam using a liquid jet injector and a gas dynamic virtual nozzle44. The micro jet width was approximately 4 µm and the flow rate was 40 µl/min. The sample caused noticeable sputtering of the liquid jet. XFEL data were processed using cctbx.xfel45,46.
Calibration of the sample to detector distance in microED was accomplished using a polycrystalline gold standard and by referencing the prominent reflections in the electron diffraction experiment with the corresponding reflections in the XFEL data. Calibration of the x/y locations of the 64-tile CSPAD detector was performed by cctbx.xfel by refining the optically measured tile positions against a thermolysin data set45.
To gain compatibility with conventional X-ray data processing programs, the microED diffraction images were converted from tiff or TVIPS format to the SMV crystallographic format. We used XDS to index the diffraction images47, and XSCALE for merging and scaling together data sets originating from different crystals. For NACore, data from four crystals were merged, while for PreNAC, data from three crystals were merged to assemble the final data sets (see Extended Data Table 1).
Structure Determination
The molecular replacement solution for SubNACore was obtained using the program Phaser48. The search model consisted of a geometrically ideal β-strand composed of nine alanine residues. Crystallographic refinements were performed with the program Refmac49.
The molecular replacement solution for NACore was obtained using the program Phaser48. The search model consisted of the SubNACore structure determined previously. Crystallographic refinements were performed with the program Phenix50 and Buster51.
The molecular replacement solution for PreNAC was obtained using the program Phaser48. The search model consisted of a geometrically ideal β-strand composed of six residues with sequence GVTTVA. Crystallographic refinements were performed with the program Phenix50 and Refmac49.
Model building for all segments was performed using COOT52. Data processing and refinement statistics are reported in Extended Data Table 1. The coordinates of the final models and the structure factors have been deposited in the Protein Data Bank with PDB code 4RIK for SubNACore, 4RIL for NACore, and 4ZNN for PreNAC. The structures were illustrated using Pymol53.
Protein expression and purification
The human wild type α-syn construct was previously characterized54 (pRK172, ampicillin, T7 promoter) with sequence: MDVFMKGLSKAKEGVVAAAEKTKQGVAEAAGKTKEGVLYVGSKTKEGVVHG VATVAEKTKEQVTNVGGAVVTGVTAVAQKTVEGAGSIAAATGFVKKDQLGKNEEGAPQEGILEDMPVDPDNEAYEMPSEEGYQDYEPEA.
Full length α-syn was purified according to published protocols34. The α-syn construct was transformed into E.coli expression cell line BL21 (DE3) gold (Agilent Technologies, Santa Clara, CA) for wild type α-syn protein expression. A single colony was incubated into 100 mL LB Miller broth (Fisher Scientific, Pittsburgh, PA) supplemented with 100 µg/mL ampicillin (Fisher Scientific, Pittsburgh, PA) and grown overnight at 37° C. One liter of LB (Miller) supplemented with 100 µg/mL ampicillin in 2 L shaker flasks was incubated with 10 mL of overnight culture and grown at 37° C until the culture reached an OD600 ~0.6–0.8 as measured by a BioPhotometer UV/VIS Photometer (Eppendorf, Westbury, NY). IPTG (Isopropyl β-D-1-thiogalactopyranoside) was added to a final concentration of 0.5 mM, and grown for 4–6 hours at 30° C. Cells were harvested by centrifugation at 5,500×g for 10 minutes at 4° C. The cell pellet was frozen and stored at −80° C.
The cell pellet was thawed on ice and resuspended in lysis buffer (100 mM Tris-HCl pH 8.0, 500 mM NaCl, 1 mM EDTA pH 8.0) and lysed by sonication. Crude cell lysate was clarified by centrifugation at 15,000 × g for 30 minutes at 4°C. The clarified cell lysate was boiled and cell debris was removed by centrifugation. Protein in the supernatant was precipitated in acid at pH 3.5 through addition of HCl by titration to protein solution on ice while stirring then centrifuged for an additional 15,000×g for 30 minutes at 4 °C. Supernatant was dialyzed against buffer A (20 mM Tris-HCl, pH 8.0). After dialysis the solution was filtered through a 0.45 µm syringe (Corning, NY 14831) before loading onto a 20 mL HiPrep Q HP 16/10 column (GE Healthcare, Piscataway, NJ). The Q-HP column was washed with five column volumes of buffer A and protein eluted using a linear gradient to 100% in five column volumes of buffer B (20 mM Tris-HCl, 1M NaCl, pH 8.0). Protein eluted at around 50–70% buffer B; peak fractions were pooled. Pooled samples were concentrated approximately tenfold using Amicon Ultra-15 centrifugal filters. Approximately 5 ml of the concentrated sample was loaded onto a HiPrep 26/60 Sephacryl S-75 HR column equilibrated with filtration buffer (25 mM sodium phosphate, 100 mM NaCl, pH 7.5). Peak fractions were pooled from the gel filtration column and dialyzed against 5 mM Tris-HCl, pH 7.5, concentrated to 3 mg/ml. These were filtered through a 0.2 µm pore size filter (Corning, NY 14831) and stored at 4 °C.
Recombinantly expressed full-length α-syn with an N-terminal acetylation was prepared and purified in the following way based on a protocol by Der-Sarkissian et al.16 The α-syn plasmid was co-expressed with a heterodimeric protein acetylation complex from S. pombe to acetylate the N-terminus (pACYC-DUET, chloramphenicol, T7 promoter)55. The two vectors were co-transformed into E. coli BL21 (DE3) using media containing both ampicillin and chloramphenicol. Cell cultures were grown in TB media containing ampicillin and chloramphenicol and induced to express α-syn with 0.5 mM IPTG overnight at 25° C. Cells were harvested by centrifugation, the cell pellet then resuspended in lysis buffer (100 mM Tris-HCl pH 8.0, 500 mM NaCl, 1 mM EDTA pH 8.0, and 1 mM phenylmethylsulfonyl fluoride) and cells lysed using an Emulsiflex homogenizer (Avestin). The lysate was boiled and debris removed by centrifugation. A protein fraction was also removed by precipitation at low pH on ice followed by centrifugation. The remaining supernatant was pH adjusted by titration and dialyzed against Buffer A (20 mM Tris-HCl, pH 8.0, 1 mM DTT, 1 mM EDTA, pH 8.0). The resulting protein solution was loaded onto a 5 mL Q-Sepharose FF column (GE Healthcare) equilibrated with Buffer A and eluted against a linear gradient of Buffer B (1M NaCl, 20 mM Tris-HCl, pH 8.0, 1 mM DTT, 1 mM EDTA, pH 8.0). Fractions containing α-syn were identified using SDS-PAGE, collected, concentrated and further purified by size exclusion (Sephacryl S-100 16/60, GE Healthcare) in 20 mM Tris pH 8.0, 100 mM NaCl, 1 mM DTT, 1 mM EDTA. Purity of fractions was assessed by SDS-PAGE.
Acetylated protein was characterized by LC-MS30,56. Expected average mass: 14460.1 Da for alpha-synuclein and 14502.1 for acetylated alpha-synuclein. Observed average mass: 14464.0 Da for alpha-synuclein and 14506.0 for acetylated alpha-synuclein (Extended Data Figure 6). The shift of 4 Da between observed and expected average masses is due to instrumental error.
Fibril formation and detection
Purified α-syn in 50mM Tris, 150 mM KCl pH 7.5 was shaken at a concentration of 500 µM at 37°C in Torey Pine shaker. To form the fibrillar samples of SubNACore and NACore, lyophilized peptides were dissolved to a final concentration of 500 µM in 5 mM lithium hydroxide, 20 mM sodium phosphate pH 7.5 and 0.1 M NaCl. All samples were shaken at 37°C in a Torey Pine shaker for 72 hours. Freshly dissolved samples were prepared by dissolving lyophilized peptides immediately prior to addition to cells for assays.
Turbidity measurements were used to compare NACore and SubNACore aggregation. Peptide samples were freshly dissolved to 1.6mM in a sample buffer with 5mM LiOH and 1% DMSO and then filtered through a PVDF filter (Millipore, 0.1µm). Measurements were performed using a black NUNC 96 well plate with 200µL of sample/well (3–4 replicates per sample). The plate was agitated at 37°C, with a 3mm rotation diameter, at 300rpm in a Varioskan microplate reader (Thermo). Absorbance readings were recorded every 3–15 minutes at 340nm.
Negative Stain Transmission Electron Microscopy
Cytotoxicity samples were evaluated for presence of fibrils by electron microscopy. Briefly, 5 µL samples were spotted directly on freshly glow-discharged carbon-coated electron microscopy grids (Ted Pella, Redding, CA). After 4 min incubation, grids were rinsed twice with 5-µL distilled water and stained with 2% uranyl acetate for 1 min. Specimens were examined on an FEI T12 electron microscope.
Fibril Diffraction
Fibrils formed from purified α-syn with and without N-terminal acetylation were concentrated by centrifugation, washed, and oriented while drying between two glass capillaries. Likewise, NACore nanocrystals were also concentrated, washed with nanopure water, and allowed to orient while drying between two glass capillaries. The glass capillaries holding the aligned fibrils or nanocrystals were mounted on a brass pin for diffraction at room temperature using 1.54Å x-rays produced by a Rigaku FRE+ rotating anode generator equipped with an HTC imaging plate. All patterns were collected at a distance of 180 mm and analyzed using the Adxv software package57. A simulated pattern from the full length α-syn model presented in Figure 3 was obtained by calculating structure factors from the model using the sfall module from CCP4, assigning the model a unit cell of 200×4.74×200 angstroms. Cylindrical averaging of these structure factors about the fiber axis (y axis) direction produced a set of simulated fibril diffraction intensities.
Cytotoxicity assays
Adherent PC12 cells were cultured in ATCC-formulated RPMI 1640 medium (ATCC; cat.# 30–2001) supplemented with 10% horse serum and 5% fetal bovine serum and plated at 10,000 per well to a final volume of 90 µl. All MTT assays were performed with Cell Titer 96 aqueous non-radioactive cell proliferation kit (MTT, Promega cat #4100). Cells were cultured in 96-well plates for 20h at 37°C in 5% CO2 prior to addition of samples (Costar cat. # 3596). 10 µL of sample was added to each well containing 90 µL medium and incubated for 24h at 37°C in 5% CO2. Then, 15 µL dye solution (Promega cat #4102) was added into each well, followed by incubation for 4h at 37°C in 5% CO2. This was followed by the addition of 100µl solubilization Solution/Stop Mix (Promega cat #4101) to each well. After 12h incubation at room temperature, the absorbance was measured at 570nm. Background absorbance was recorded at 700nm. The data was normalized with cells treated with 1% (w/v) SDS to 0% reduction, and cells treated with sample buffer to 100% reduction.
Lactose dehydrogenase assays were done using CytoTox-ONE™ Homogeneous Membrane Integrity, (Promega, cat #G7890) as per manufacturers instructions. Briefly, cells were plated in 96 well black-wall, clear bottom (Fisher Cat #07-200-588) tissue culture plates at 10,000 cells per well to a final volume of 90µL. Cells were incubated for an additional 20h at 37°C in 5% CO2 prior to addition of samples. Next, 10µl of sample was added to each well following which the cells were incubated for another 24 hours. 100µl of reagent was added to each well and incubated for 15mins at room temperature. The addition of 50µL of stop solution stopped the reaction. Fluorescence was measured in a Spectramax M5 (Molecular Devices) using excitation and emission wavelengths of 560 nm and 590 nm, respectively. Data was normalized using cells treated with buffer as 0% release and 0.1% triton X-100 as 100% release.
Construction of α-syn A53T fibril model
A model for full-length α-syn A53T mutant fibrils that are involved in the early onset of PD was constructed using a section of the NACore crystal packing as a scaffold. Figure 3 illustrates the four copies of the NACore segment used for the scaffold. The crystal structure of the two inner strands was adapted with minimal changes as the analogous segments 68–78. The structure of PreNAC was matched onto the weak interface of the NACore structure. Only four of the eleven sidechains in the segment 46–56 differ from those in the NACore segment 68–78 and residues V51-V55 can be closely matched to V71-V75. Hence the model for both the homotypic interface and heterotypic interface in the full-length fiber model closely resemble those observed in the NACore structure. The regions outside these segments were adapted from the structure of the native α-syn fold, PDB ID 2KKW58. These segments were spliced in manually using COOT. The models were energy minimized and temperature annealed using the program CNS59 with hydrogen bonding potential60. The simulated fiber diffraction pattern calculated from this model shows prominent reflections that agree with those observed in fiber diffraction patterns of NACore, α-syn, and N-acetyl α-syn (Extended Data Table 2).
Extended Data
Extended Data Figure 1.
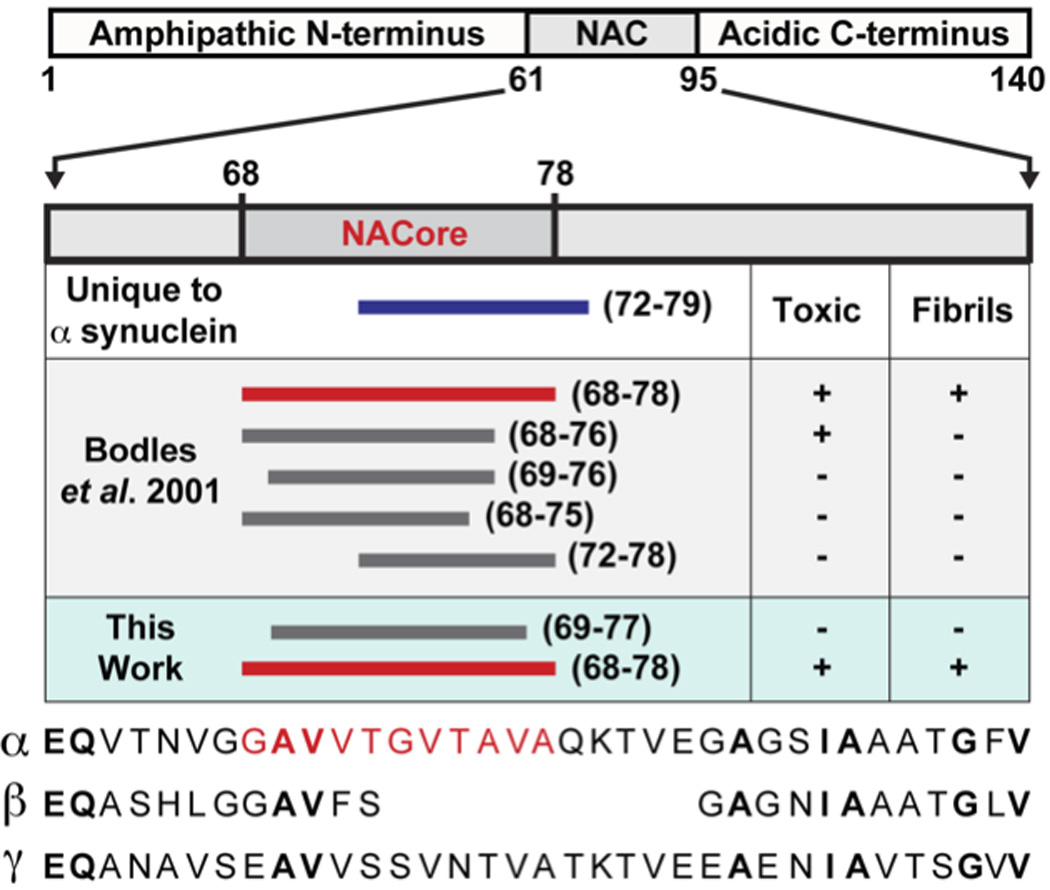
A schematic representation of α-syn, highlighting the NAC region (residues 61–95) and within it the NACore sequence (residues 68–78). A series of bars span regions of α-syn that are of interest to this work. Among the three synuclein paralogs (α, β, and γ), the region whose sequence is unique to α-syn is shown as a blue bar (residues 72–83) that overlaps with a large portion of NACore. Segments investigated by Bodles et al.23 are also shown. These span a variety of regions within NACore. Two of the segments we now investigate, SubNACore and NACore, are shown in this context. Only one of the segments studied by Bodles et al. is an exact match to our NACore sequence, and only this segment is both toxic and fibrillar. The sequences of α-synuclein, β-synuclein, and γ-synuclein are shown as a reference with conserved residues in bold and the NACore sequence in red.
Extended Data Figure 2.
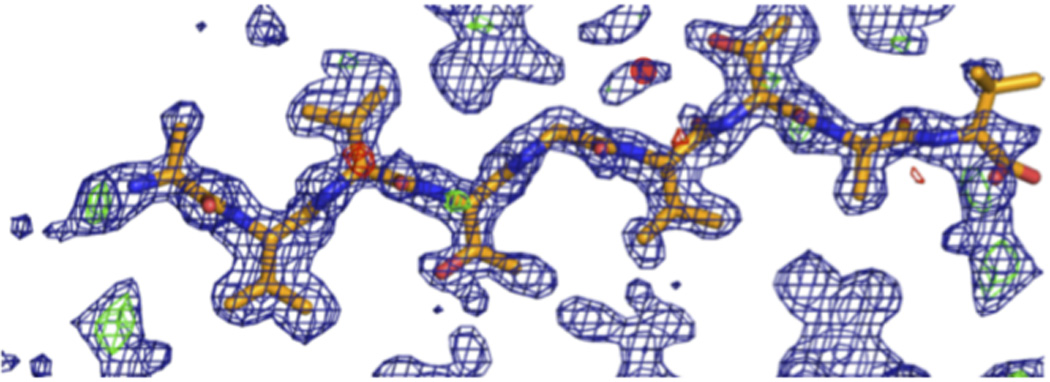
Difference density maps calculated after successful molecular replacement using the SubNACore search model clearly revealed the positions of the missing residues (positive Fo-Fc density at N and C termini corresponding to G68 and A78) and one water molecule near a threonine side chain (red circle); a second water was located during the refinement process. The blue mesh represents 2Fo-Fc density contoured at 1.2 σ level. The green and red mesh represent Fo-Fc density contoured at 3.0 and −3.0 σ, respectively. All maps were σa-weighted61.
Extended Data Figure 3.
The crystal structure of NACore reveals pairs of sheets as in the spines of amyloid fibrils. a, NACore’s two types of sheet-sheet interfaces: a larger interface (orange, 268 Å2 of buried accessible surface area per chain) we call interface A, and a weaker interface (blue, 167 Å2) we call interface B. The crystal is viewed along the hydrogen-bonding direction (crystal “b” dimension). The red lines outline the unit cell. b, The van der Waals packing between sheets.The sheets are related by a 21 screw axis denoted in black. The only gaps left by the interface are filled with water molcules which hydrogen-bond to the threonine residues (partly showing aqua spheres). The shape complementarity of both interfaces is 0.7. The viewing direction is the same as in a. c, Orthogonal view of the fibrillar assembly. The protofibril axis, coinciding with the 21 screw axis designated by the arrow, runs vertically between the pairs of sheets.
Extended Data Figure 4.
a, Comparison of the crystal packing for NACore (orange chain) and SubNACore (white chain). The face-to-face interactions are virtually the same for the pairs of NACore peptides in its crystal structure and the SubNACore peptides in its structure (A and B shown in gold and blue, respectively). The table below shows a pairwise the RMSD comparing the nine residues shared in common between the structures. RMSD_res is an all-atom comparison between residue pairs, while RMSD_ca compares only alpha carbon pairs. b, PreNAC (blue) is compared with NACore (orange). Five residues from each strand are shown in darker color and the RMS deviations between their alpha carbon pairs compared in the table below. Therefore the PreNAC-NACore interaction mimics weaker Interface B in the NACore structure.
Extended Data Figure 5.
Intense reflections common among the NACore and the two polymorphs of full length α-syn suggest common structural features. These features are illustrated here on the crystal packing diagrams of NACore. The (0,0,2) planes approximate the separation between sheets in interface A (orange). The (0,2,0), (−1,1,1), and (1,1,1) reflections are intense because the corresponding Bragg planes recapitulate the staggering of strands from opposing sheets. The red lines correspond to the unit cell boundaries and all planes are shown in black.
Extended Data Figure 6.

Mass spectrometry analysis of recombinantly expressed, full length α-syn, with and without N-terminal acetylation The mass profile of wild-type full length α-syn (left) is compared to that of an N-terminally acetylated form of the protein (right). The mass shift for the N-terminally acetylated form is appropriately shifted with respect to the native form of the protein (14464.0 Da for alpha-synuclein and 14506.0 for acetylated alpha-synuclein), within a margin of error of 4 Da.
Extended Data Table 1.
Statistics of data collection and atomic refinement for NACore, its fragment SubNACore, and PreNAC.
| Segment | SubNACoreAVVTGVTAV | NACoreGAVVTGVTAVA | PreNACGVVHGVTTVA |
|---|---|---|---|
| Data collection | |||
| Radiation source | Synchrotron | Electron | Electron |
| Space group | C2 | C2 | P21 |
| Cell dimensions | |||
| a,b,c (Å) | 61.9, 4.80, 17.3 | 70.8, 4.82, 16.79 | 17.9, 4.7, 33.0 |
| α,β,γ (°) | 90, 104.1, 90 | 90, 105.7, 90 | 90, 94.3, 90 |
| Resolution (Å) | 1.85 (1.95–1.85) | 1.43 (1.60–1.43) | 1.41 (1.56–1.41) |
| Wavelength (Å) | 0.9791 | 0.0251 | 0.0251 |
| _R_merge | 0.117 (0.282) | 0.173 (0.560) | 0.236 (0.535) |
| _R_r.i.m. | 0.135 (0.322) | 0.199 (0.647) | 0.264 (0.609) |
| _R_p.i.m. | 0.065 (0.154) | 0.093 (0.311) | 0.185 (0.305) |
| I/σ_I_ | 5.2 (2.7) | 5.5 (2.5) | 4.6 (1.8) |
| CC1/2 (%) | 99.5 (97.8) | 99.4 (92.3) | 96.7(74.0) |
| Completeness (%) | 97.9 (98.3) | 89.9 (82.6) | 86.9 (69.6) |
| Multiplicity | 4.1 (4.0) | 4.4 (4.3) | 3.7 (3.5) |
| Refinement | |||
| Resolution (Å) | 1.85 (2.07–1.85) | 1.43 (1.60–1.43) | 1.41 (1.41–1.57) |
| No. reflections | 470 (125) | 1073 (245) | 1006 (239) |
| _R_work | 0.176 (0.248) | 0.248 (0.253) | 0.235 (0.336) |
| _R_free | 0.221 (0.286) | 0.275 (0.331) | 0.282 (0.329) |
| CCwork | 0.964 (0.896) | 0.913 | |
| CCfree | 0.889 (0.993) | 0.900 | |
| No. atoms | |||
| Protein | 57 | 66 | 66 |
| Water | 3 | 2 | 4 |
| B-factors (Å2) | |||
| Protein | 17.1 | 9.0 | 16.1 |
| Water | 27.6 | 2.7 | 24.6 |
| Wilson B (Å2) | 11.8 | 10.3 | 13.8 |
| R.m.s deviations | |||
| Bond lengths (Å) | 0.005 | 0.010 | 0.020 |
| Bond angles (°) | 1.1 | 1.6 | 2.0 |
| PDB ID code | 4RIK | 4RIL | 4ZNN |
Extended Data Table 2.
Comparison of reflections observed in powder diffraction of fibrils of full-length α-syn, N-acetyl α-syn, and a synthetic pattern calculated from our α-syn model, to aligned nanocrystals of NACore. Bold reflections are strong and common to all three samples.
| Segment | Reflections (Å) |
|---|---|
| NACore GAVVTGVTAVA | 2.21, 2.26, 2.39, 2.52, 2.61, 2.68, 2.78, 3.02, 3.12, 3.34, 3.56, 3.86, 4.34, 4.57, 5.16, 5.98, 7.56, 8.19, 10.46, 11.63, 13.29, 16.61 |
| α-syn | 2.39, 4.64, 6.82, 8.29, 10.06 |
| N-acetyl α-syn | 2.38, 4.62, 8.18, 9.80, 11.90 |
| Simulated α-syn | 2.23, 2.25, 2.35, 3.29, 3.63, 3.70, 3.95, 4.08, 4.56,4.68, 8.36, 8.69, 21.76, 24.47, 27.61, 31.67 |
Acknowledgments
We thank Cong Liu for supplying PC12 cells; APS staff for beam line help solving SubNACore: Malcom Capel, Kanagalaghatta Rajashankar, Narayanasami Sukumar, Jon Schuermann, Igor Kourinov and Frank Murphy at NECAT beam lines 24-ID at APS funded by the National Institute of General Medical Sciences from the National Institutes of Health (P41 GM103403) and the DOE Office of Science by Argonne National Laboratory under Contract No. DE-AC02-06CH11357. We thank the LCLS injection staff support: Sabine Botha, Robert Shoeman, and Ilme Schlichting. A.S.B. and N.K.S. were supported by NIH grants GM095887 and GM102520 and by the Director, Office of Science, Department of Energy (DOE) under contract DE-AC02-05CH11231 for data-processing methods. This work was supported by the U.S. Department of Energy Office of Science, Office of Biological and Environmental Research program under award number DE-FC02-02ER63421. We also thank the award MCB-0958111 from the National Science Foundation, award 1R01-AG029430 from the National Institutes of Health, award NIH-AG016570 from Alzheimer’s Disease Research (ADRC) at UCLA, and HHMI for support. J.A.R. was supported by the Giannini Foundation.
Footnotes
Supplementary Information is linked to the online version of the paper at www.nature.com/nature.
Contributions: M.I.I. characterized the α-syn segments and crystals. M.I.I. and S.S. conducted the toxicity assays. L.M.J. synthesized and purified NACore peptide. M.A.A. prepared the N-terminally acetylated α-syn. S.S. and M.Z. prepared wild type α-syn. J.W. performed the mass spectrometry analyses of α-syn. M.I.I. and L.M.J. crystallized NACore. E.G. grew crystals of SubNACore. E.G., M.I.I. and M.R.S collected and processed the data and solved the structure of SubNACore. L.J. and J.A.R. identified and crystallized PreNAC. J.A.R., D.S., B.N. and T.G. collected MicroED data on PreNAC and NACore nanocrystals. J.A.R., F.R., J.H., T.G., L.J., M.R.S, and D.C. processed the MicroED data and solved the structure of PreNAC and NACore. J.A.R., M.R.S., D.C., M.M., and S.B. collected XFEL diffraction from NACore nanocrystals. A.S.B. and N.K.S. processed the XFEL data. M.R.S and L.J. built the structure model of A53T a-syn protofibril. J.A.R., M.I.I., M.R.S., D.C., S.S. and E.G. prepared the figures. J.A.R., M.I.I., M.R.S., D.C., T.G., and D.E. wrote the paper, and all authors commented on the paper.
Primary accessions: Atomic coordinates and structure factors have been deposited in the Protein Data Bank as 4RIK for SubNACore, 4RIL for NACore and 4ZNN for PreNAC. The maps for PreNAC and NACore have been deposited in the EMDB with accession codes EMD-3001 and EMD-3028, respectively.
References
- 1.Spillantini MG, et al. Alpha-synuclein in Lewy bodies. Nature. 1997;388:839–840. doi: 10.1038/42166. [DOI] [PubMed] [Google Scholar]
- 2.Goedert M, Spillantini MG, Del Tredici K, Braak H. 100 years of Lewy pathology. Nat. Rev. Neurol. 2013;9:13–24. doi: 10.1038/nrneurol.2012.242. [DOI] [PubMed] [Google Scholar]
- 3.Polymeropoulos MH, et al. Mutation in the alpha-synuclein gene identified in families with Parkinson’s disease. Science. 1997;276:2045–2047. doi: 10.1126/science.276.5321.2045. [DOI] [PubMed] [Google Scholar]
- 4.Krüger R. Ala30Pro mutation in the gene encoding alpha-synuclein in Parkinson’s disease. Nat. Genet. 1998;18:106–108. doi: 10.1038/ng0298-106. [DOI] [PubMed] [Google Scholar]
- 5.Zarranz JJ, et al. The new mutation, E46K, of alpha-synuclein causes Parkinson and Lewy body dementia. Ann. Neurol. 2004;55:164–173. doi: 10.1002/ana.10795. [DOI] [PubMed] [Google Scholar]
- 6.Ibáñez P. Causal relation between alpha-synuclein gene duplication and familial Parkinson’s disease. Lancet. 2004;364:1169–1171. doi: 10.1016/S0140-6736(04)17104-3. [DOI] [PubMed] [Google Scholar]
- 7.Singleton AB, et al. alpha-Synuclein locus triplication causes Parkinson’s disease. Science. 2003;302:841. doi: 10.1126/science.1090278. [DOI] [PubMed] [Google Scholar]
- 8.Uéda K, et al. Molecular cloning of cDNA encoding an unrecognized component of amyloid in Alzheimer disease. Proc. Natl. Acad. Sci. U. S. A. 1993;90:11282–11286. doi: 10.1073/pnas.90.23.11282. [DOI] [PMC free article] [PubMed] [Google Scholar]
- 9.Biere AL, et al. Parkinson’s disease-associated alpha-synuclein is more fibrillogenic than beta- and gamma-synuclein and cannot cross-seed its homologs. J. Biol. Chem. 2000;275:34574–34579. doi: 10.1074/jbc.M005514200. [DOI] [PubMed] [Google Scholar]
- 10.Giasson BI, Murray IVJ, Trojanowski JQ, Lee VM-Y. A Hydrophobic Stretch of 12 Amino Acid Residues in the Middle of α-Synuclein Is Essential for Filament Assembly. J. Biol. Chem. 2001;276:2380–2386. doi: 10.1074/jbc.M008919200. [DOI] [PubMed] [Google Scholar]
- 11.Du H-N, et al. A peptide motif consisting of glycine, alanine, and valine is required for the fibrillization and cytotoxicity of human alpha-synuclein. Biochemistry (Mosc.) 2003;42:8870–8878. doi: 10.1021/bi034028+. [DOI] [PubMed] [Google Scholar]
- 12.Periquet M, Fulga T, Myllykangas L, Schlossmacher MG, Feany MB. Aggregated α-Synuclein Mediates Dopaminergic Neurotoxicity In Vivo. J. Neurosci. 2007;27:3338–3346. doi: 10.1523/JNEUROSCI.0285-07.2007. [DOI] [PMC free article] [PubMed] [Google Scholar]
- 13.Han H, Weinreb PH, Lansbury PT. The core Alzheimer’s peptide NAC forms amyloid fibrils, which seed and are seeded by beta-amyloid: is NAC a common trigger or target in neurodegenerative disease? Chem. Biol. 1995;2:163–169. doi: 10.1016/1074-5521(95)90071-3. [DOI] [PubMed] [Google Scholar]
- 14.El-Agnaf OM, et al. Aggregates from mutant and wild-type alpha-synuclein proteins and NAC peptide induce apoptotic cell death in human neuroblastoma cells by formation of beta-sheet and amyloid-like filaments. FEBS Lett. 1998;440:71–75. doi: 10.1016/s0014-5793(98)01418-5. [DOI] [PubMed] [Google Scholar]
- 15.Crowther RA, Daniel SE, Goedert M. Characterisation of isolated alpha-synuclein filaments from substantia nigra of Parkinson’s disease brain. Neurosci. Lett. 2000;292:128–130. doi: 10.1016/s0304-3940(00)01440-3. [DOI] [PubMed] [Google Scholar]
- 16.Der-Sarkissian A, Jao CC, Chen J, Langen R. Structural organization of alpha-synuclein fibrils studied by site-directed spin labeling. J. Biol. Chem. 2003;278:37530–37535. doi: 10.1074/jbc.M305266200. [DOI] [PubMed] [Google Scholar]
- 17.Chen M, Margittai M, Chen J, Langen R. Investigation of alpha-synuclein fibril structure by site-directed spin labeling. J. Biol. Chem. 2007;282:24970–24979. doi: 10.1074/jbc.M700368200. [DOI] [PubMed] [Google Scholar]
- 18.Miake H, Mizusawa H, Iwatsubo T, Hasegawa M. Biochemical Characterization of the Core Structure of α-Synuclein Filaments. J. Biol. Chem. 2002;277:19213–19219. doi: 10.1074/jbc.M110551200. [DOI] [PubMed] [Google Scholar]
- 19.Conway KA, Harper JD, Lansbury PT. Accelerated in vitro fibril formation by a mutant alpha-synuclein linked to early-onset Parkinson disease. Nat. Med. 1998;4:1318–1320. doi: 10.1038/3311. [DOI] [PubMed] [Google Scholar]
- 20.Polymeropoulos MH, et al. Mutation in the alpha-synuclein gene identified in families with Parkinson’s disease. Science. 1997;276:2045–2047. doi: 10.1126/science.276.5321.2045. [DOI] [PubMed] [Google Scholar]
- 21.Nelson R, et al. Structure of the cross-beta spine of amyloid-like fibrils. Nature. 2005;435:773–778. doi: 10.1038/nature03680. [DOI] [PMC free article] [PubMed] [Google Scholar]
- 22.Sawaya MR, et al. Atomic structures of amyloid cross-beta spines reveal varied steric zippers. Nature. 2007;447:453–457. doi: 10.1038/nature05695. [DOI] [PubMed] [Google Scholar]
- 23.Bodles AM, Guthrie DJ, Greer B, Irvine GB. Identification of the region of non-Abeta component (NAC) of Alzheimer’s disease amyloid responsible for its aggregation and toxicity. J. Neurochem. 2001;78:384–395. doi: 10.1046/j.1471-4159.2001.00408.x. [DOI] [PubMed] [Google Scholar]
- 24.Nannenga BL, Gonen T. Protein structure determination by MicroED. Curr. Opin. Struct. Biol. 2014;27C:24–31. doi: 10.1016/j.sbi.2014.03.004. [DOI] [PMC free article] [PubMed] [Google Scholar]
- 25.Nannenga BL, Shi D, Leslie AGW, Gonen T. High-resolution structure determination by continuous-rotation data collection in MicroED. Nat. Methods. 2014;11:927–930. doi: 10.1038/nmeth.3043. [DOI] [PMC free article] [PubMed] [Google Scholar]
- 26.Shi D, Nannenga BL, Iadanza MG, Gonen T. Three-dimensional electron crystallography of protein microcrystals. eLife. 2013;2:e01345. doi: 10.7554/eLife.01345. [DOI] [PMC free article] [PubMed] [Google Scholar]
- 27.Nannenga BL, Shi D, Hattne J, Reyes FE, Gonen T. Structure of catalase determined by MicroED. eLife. 2014;3:e03600. doi: 10.7554/eLife.03600. [DOI] [PMC free article] [PubMed] [Google Scholar]
- 28.Yonekura K, Kato K, Ogasawara M, Tomita M, Toyoshima C. Electron crystallography of ultrathin 3D protein crystals: atomic model with charges. Proc. Natl. Acad. Sci. U. S. A. 2015;112:3368–3373. doi: 10.1073/pnas.1500724112. [DOI] [PMC free article] [PubMed] [Google Scholar]
- 29.Doyle PA, Turner PS. Relativistic Hartree–Fock X-ray and electron scattering factors. Acta Crystallogr. Sect. A. 1968;24:390–397. [Google Scholar]
- 30.Sarafian TA, et al. Impairment of mitochondria in adult mouse brain overexpressing predominantly full-length, N-terminally acetylated human α-synuclein. PloS One. 2013;8:e63557. doi: 10.1371/journal.pone.0063557. [DOI] [PMC free article] [PubMed] [Google Scholar]
- 31.Caughey B, Lansbury PT. Protofibrils, pores, fibrils, and neurodegeneration: separating the responsible protein aggregates from the innocent bystanders. Annu. Rev. Neurosci. 2003;26:267–298. doi: 10.1146/annurev.neuro.26.010302.081142. [DOI] [PubMed] [Google Scholar]
- 32.Danzer KM, Schnack C, Sutcliffe A, Hengerer B, Gillardon F. Functional protein kinase arrays reveal inhibition of p-21-activated kinase 4 by alpha-synuclein oligomers. J. Neurochem. 2007;103:2401–2407. doi: 10.1111/j.1471-4159.2007.04933.x. [DOI] [PubMed] [Google Scholar]
- 33.Karpinar DP, et al. Pre-fibrillar alpha-synuclein variants with impaired beta-structure increase neurotoxicity in Parkinson’s disease models. EMBO J. 2009;28:3256–3268. doi: 10.1038/emboj.2009.257. [DOI] [PMC free article] [PubMed] [Google Scholar]
- 34.Winner B, et al. In vivo demonstration that alpha-synuclein oligomers are toxic. Proc. Natl. Acad. Sci. U. S. A. 2011;108:4194–4199. doi: 10.1073/pnas.1100976108. [DOI] [PMC free article] [PubMed] [Google Scholar]
- 35.Chen SW, et al. Structural characterization of toxic oligomers that are kinetically trapped during α-synuclein fibril formation. Proc. Natl. Acad. Sci. U. S. A. 2015;112:E1994–E2003. doi: 10.1073/pnas.1421204112. [DOI] [PMC free article] [PubMed] [Google Scholar]
- 36.Bousset L, et al. Structural and functional characterization of two alpha-synuclein strains. Nat. Commun. 2013;4:2575. doi: 10.1038/ncomms3575. [DOI] [PMC free article] [PubMed] [Google Scholar]
- 37.Auluck PK, Caraveo G, Lindquist S. α-Synuclein: membrane interactions and toxicity in Parkinson’s disease. Annu. Rev. Cell Dev. Biol. 2010;26:211–233. doi: 10.1146/annurev.cellbio.042308.113313. [DOI] [PubMed] [Google Scholar]
- 38.Lee JC, Langen R, Hummel PA, Gray HB, Winkler JR. Alpha-synuclein structures from fluorescence energy-transfer kinetics: implications for the role of the protein in Parkinson’s disease. Proc. Natl. Acad. Sci. U. S. A. 2004;101:16466–16471. doi: 10.1073/pnas.0407307101. [DOI] [PMC free article] [PubMed] [Google Scholar]
- 39.Sievers SA, et al. Structure-based design of non-natural amino-acid inhibitors of amyloid fibril formation. Nature. 2011;475:96–100. doi: 10.1038/nature10154. [DOI] [PMC free article] [PubMed] [Google Scholar]
- 40.Comellas G, et al. Structured regions of α-synuclein fibrils include the early-onset Parkinson’s disease mutation sites. J. Mol. Biol. 2011;411:881–895. doi: 10.1016/j.jmb.2011.06.026. [DOI] [PMC free article] [PubMed] [Google Scholar]
- 41.Vilar M, et al. The fold of alpha-synuclein fibrils. Proc. Natl. Acad. Sci. U. S. A. 2008;105:8637–8642. doi: 10.1073/pnas.0712179105. [DOI] [PMC free article] [PubMed] [Google Scholar]
- 42.Goldschmidt L, Teng PK, Riek R, Eisenberg D. Identifying the amylome, proteins capable of forming amyloid-like fibrils. Proc. Natl. Acad. Sci. 2010;107:3487–3492. doi: 10.1073/pnas.0915166107. [DOI] [PMC free article] [PubMed] [Google Scholar]
Extended References
- 43.Otwinowski Z, Minor W. In: Methods in Enzymology. Charles W, Carter J, editors. Vol. 276. Academic Press; 1997. pp. 307–326. [DOI] [PubMed] [Google Scholar]
- 44.Weierstall U, Spence JCH, Doak RB. Injector for scattering measurements on fully solvated biospecies. Rev. Sci. Instrum. 2012;83:035108. doi: 10.1063/1.3693040. [DOI] [PubMed] [Google Scholar]
- 45.Hattne J, et al. Accurate macromolecular structures using minimal measurements from X-ray free-electron lasers. Nat. Methods. 2014;11:545–548. doi: 10.1038/nmeth.2887. [DOI] [PMC free article] [PubMed] [Google Scholar]
- 46.Sauter NK, Hattne J, Grosse-Kunstleve RW, Echols N. New Python-based methods for data processing. Acta Crystallogr. D Biol. Crystallogr. 2013;69:1274–1282. doi: 10.1107/S0907444913000863. [DOI] [PMC free article] [PubMed] [Google Scholar]
- 47.Kabsch W. XDS. Acta Crystallogr. D Biol. Crystallogr. 2010;66:125–132. doi: 10.1107/S0907444909047337. [DOI] [PMC free article] [PubMed] [Google Scholar]
- 48.McCoy AJ, et al. Phaser crystallographic software. J. Appl. Crystallogr. 2007;40:658–674. doi: 10.1107/S0021889807021206. [DOI] [PMC free article] [PubMed] [Google Scholar]
- 49.Murshudov GN, Vagin AA, Dodson EJ. Refinement of macromolecular structures by the maximum-likelihood method. Acta Crystallogr. D Biol. Crystallogr. 1997;53:240–255. doi: 10.1107/S0907444996012255. [DOI] [PubMed] [Google Scholar]
- 50.Afonine PV, et al. Towards automated crystallographic structure refinement with phenix.refine. Acta Crystallogr. D Biol. Crystallogr. 2012;68:352–367. doi: 10.1107/S0907444912001308. [DOI] [PMC free article] [PubMed] [Google Scholar]
- 51.Blanc E, et al. Refinement of severely incomplete structures with maximum likelihood in BUSTER-TNT. Acta Crystallogr. D Biol. Crystallogr. 2004;60:2210–2221. doi: 10.1107/S0907444904016427. [DOI] [PubMed] [Google Scholar]
- 52.Emsley P, Lohkamp B, Scott WG, Cowtan K. Features and development of Coot. Acta Crystallogr. D Biol. Crystallogr. 2010;66:486–501. doi: 10.1107/S0907444910007493. [DOI] [PMC free article] [PubMed] [Google Scholar]
- 53.Delano W, et al. In: The PyMOL Molecular Graphics System. Schrödinger LLC, editor. at< http://www.pymol.org>. [Google Scholar]
- 54.Jakes R, Spillantini MG, Goedert M. Identification of two distinct synucleins from human brain. FEBS Lett. 1994;345:27–32. doi: 10.1016/0014-5793(94)00395-5. [DOI] [PubMed] [Google Scholar]
- 55.Johnson M, Coulton AT, Geeves MA, Mulvihill DP. Targeted amino-terminal acetylation of recombinant proteins in E. coli. PloS One. 2010;5:e15801. doi: 10.1371/journal.pone.0015801. [DOI] [PMC free article] [PubMed] [Google Scholar]
- 56.Whitelegge JP, Zhang H, Aguilera R, Taylor RM, Cramer WA. Full subunit coverage liquid chromatography electrospray ionization mass spectrometry (LCMS+) of an oligomeric membrane protein: cytochrome b(6)f complex from spinach and the cyanobacterium Mastigocladus laminosus. Mol. Cell. Proteomics MCP. 2002;1:816–827. doi: 10.1074/mcp.m200045-mcp200. [DOI] [PubMed] [Google Scholar]
- 57.Arvai A. Adxv - A Program to Display X-ray Diffraction Images. 2015 at< http://www.scripps.edu/tainer/arvai/adxv.html>. [Google Scholar]
- 58.Rao JN, Jao CC, Hegde BG, Langen R, Ulmer TS. A combinatorial NMR and EPR approach for evaluating the structural ensemble of partially folded proteins. J. Am. Chem. Soc. 2010;132:8657–8668. doi: 10.1021/ja100646t. [DOI] [PMC free article] [PubMed] [Google Scholar]
- 59.Brunger AT. Version 1.2 of the Crystallography and NMR system. Nat. Protoc. 2007;2:2728–2733. doi: 10.1038/nprot.2007.406. [DOI] [PubMed] [Google Scholar]
- 60.Fabiola F, Bertram R, Korostelev A, Chapman MS. An improved hydrogen bond potential: impact on medium resolution protein structures. Protein Sci. Publ. Protein Soc. 2002;11:1415–1423. doi: 10.1110/ps.4890102. [DOI] [PMC free article] [PubMed] [Google Scholar]
- 61.Read RJ. Improved Fourier coefficients for maps using phases from partial structures with errors. Acta Crystallogr. A. 1986;42:140–149. [Google Scholar]
