Identification of Preoptic Sleep Neurons Using Retrograde Labeling and Gene Profiling (original) (raw)
. Author manuscript; available in PMC: 2017 Nov 17.
Published in final edited form as: Nature. 2017 May 17;545(7655):477–481. doi: 10.1038/nature22350
Abstract
In humans and other mammalian species, lesions in the preoptic area (POA) of the hypothalamus cause profound sleep impairment1–5, indicating a crucial role of the POA in sleep generation. However, the underlying circuit mechanism remains poorly understood. Electrophysiological recordings and c-Fos immunohistochemistry showed the existence of sleep-active neurons in the POA, especially in the ventrolateral preoptic area (VLPO) and median preoptic nucleus (MnPO)6–9. Pharmacogenetic activation of c-Fos-labeled sleep-active neurons has been shown to induce sleep10. However, the sleep-active neurons are spatially intermingled with wake-active neurons6,7, making it difficult to target the sleep neurons specifically for circuit analysis. Here, we have identified a population of POA sleep neurons based on their projection target and discovered their molecular markers. Using a lentivirus expressing channelrhodopsin-2 (ChR2) or a light-activated chloride channel (iC++) for retrograde labeling, bidirectional optogenetic manipulation, and optrode recording, we showed that the POA GABAergic neurons projecting to the tuberomammillary nucleus (TMN) are both sleep active and sleep promoting. Furthermore, translating ribosome affinity purification (TRAP) and single-cell RNA-seq identified candidate markers for these neurons, and optogenetic and pharmacogenetic manipulations demonstrated that several peptide markers (cholecystokinin, corticotropin releasing hormone, and tachykinin 1) label sleep-promoting neurons. Together, these findings provide easy genetic access to sleep-promoting POA neurons and a valuable entry point for dissecting the sleep control circuit.
Sleep-active POA GABAergic neurons labeled by c-Fos immunohistochemistry project to the wake-promoting, histaminergic TMN in the posterior hypothalamus8,9,11,12 (Extended Data Figs. 1,2). This inhibitory projection is important for sleep generation, since insomnia induced by POA lesion was reversed by muscimol injection into the posterior hypothalamus4. To test whether this projection can be used to single out the sleep-promoting neurons, we used a lentivirus pseudotyped with the rabies glycoprotein (RG) for retrograde labeling13. Injection of the lentivirus with Cre-dependent expression of ChR2-eYFP (rEIAV-DIO-TLoop-ChR2-eYFP) into the TMN of GAD2-Cre mice led to eYFP labeling of GABAergic neurons in the POA (including the VLPO, lateral POA, and the lateral part of medial POA), the majority of which expressed c-Fos following sleep rebound (73.6±4.8%, Extended Data Fig. 2h,i). These labeled neurons are referred to as GABAPOA→TMN neurons.
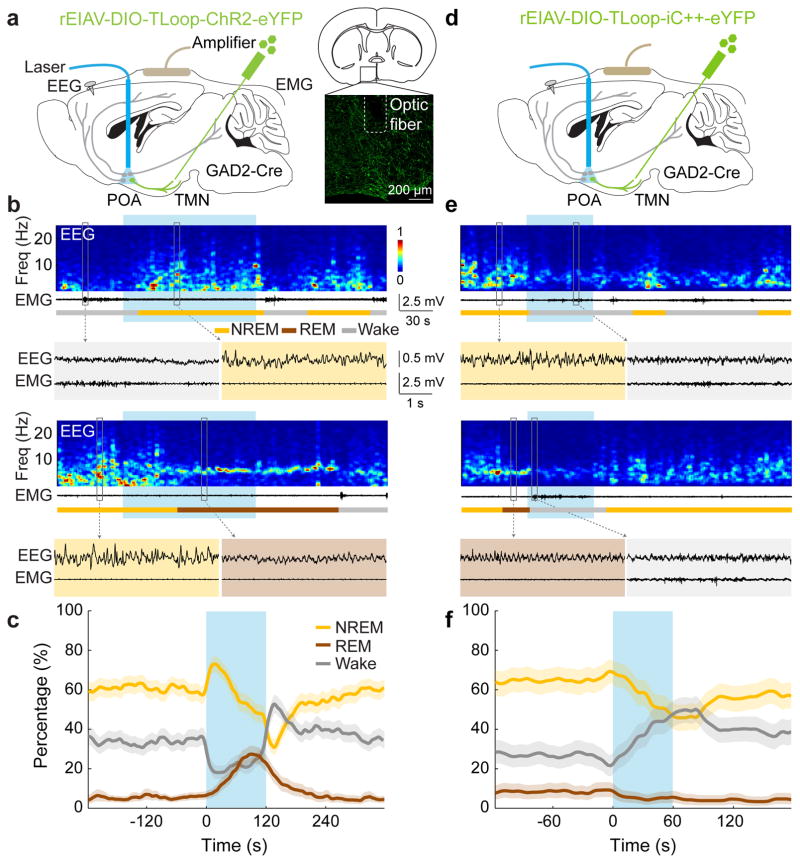
To test the causal role of GABAPOA→TMN neurons in sleep regulation, we optogenetically activated them in freely moving mice. Laser stimulation (2, 5 or 10 Hz, 2 min/trial) was applied every 15–25 min, and wakefulness, REM, and NREM states were classified based on electroencephalogram (EEG) and electromyogram (EMG) recordings (Fig. 1a). GABAPOA→TMN neuron activation caused an immediate increase in NREM sleep and a delayed increase in REM sleep at the expense of wakefulness (Fig. 1b,c; Extended Data Fig. 3a–c; Supplementary Video 1). Activating the axons of POA GABAergic (GABAPOA) neurons (infected by AAV-DIO-ChR2-eYFP) projecting into the TMN also increased REM and NREM sleep and decreased wakefulness (Extended Data Fig. 4a–g), which may be partly mediated by reduced histamine release (Extended Data Fig. 4h–k). In contrast, inactivating these axons through iC++14 caused the opposite effects (Extended Data Fig. 4c).
Figure 1. Optogenetic activation/inhibition of GABAPOA→TMN neurons enhances/suppresses sleep.
a, Schematic of optogenetic activation experiment. Right panel, fluorescence image of POA (box in schematic) in a GAD2-Cre mouse with rEIAV-DIO-TLoop-ChR2-eYFP injected into the TMN. Mouse brain figure adapted with permission from ref. 31. b, Two example trials. Shown are EEG power spectra, EMG traces, brain states (color coded), and EEG, EMG traces during selected periods (indicated by boxes) on an expanded time scale. Blue shading, laser stimulation (10 Hz, 120 s). c, Percentage of time in wake, NREM, or REM state before, during, and after laser stimulation (blue shading), averaged from 9 mice (P<0.0001 for laser-induced change from wake to sleep states, bootstrap). d, Schematic of optogenetic inhibition experiment. e, Two example trials. Blue shading, laser stimulation (constant light, 60 s). f, Percentage of time in wake, NREM, or REM state before, during, and after laser stimulation, averaged from 4 mice (P<0.0001 for wake, _P_=0.003 and 0.002 for REM and NREM, bootstrap). Shading for each trace, 95% confidence interval (CI).
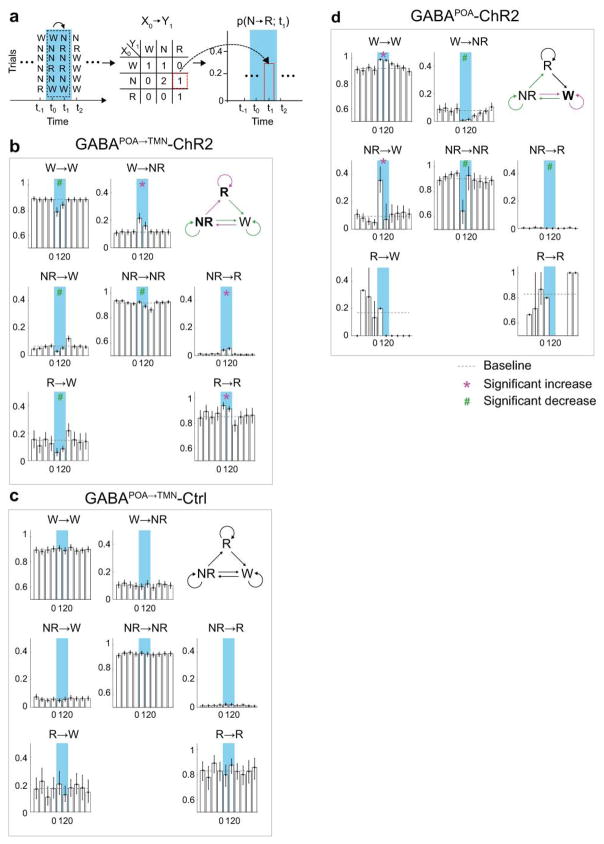
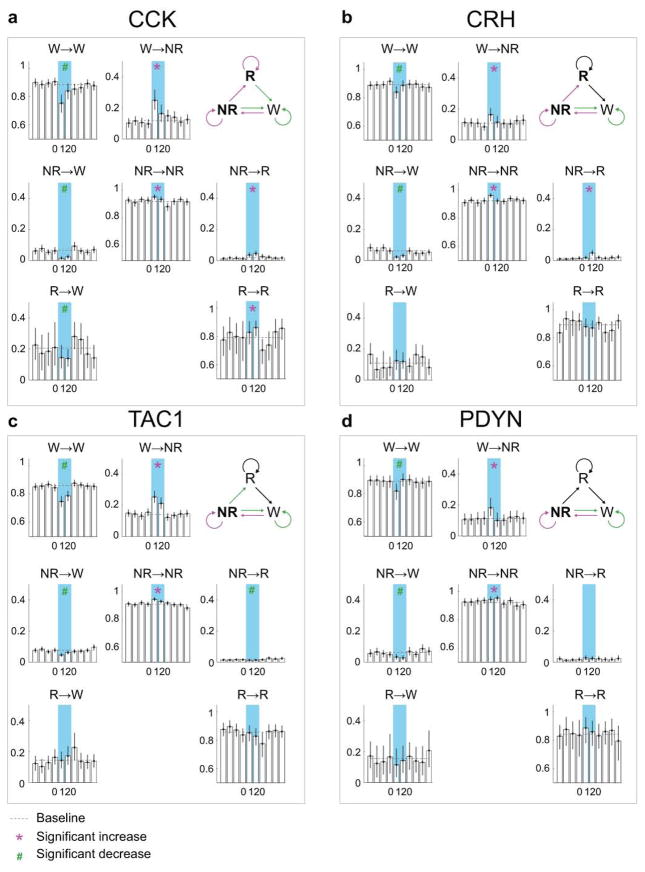
Based on the brain state probability alone (Fig. 1c), however, it is difficult to determine whether the neuronal activity initiates or maintains a particular state, and whether the increased REM sleep results directly from laser stimulation or secondarily from increased NREM sleep, given that animals normally enter REM from NREM sleep. We thus analyzed the probability of transitions between each pair of brain states (Extended Data Fig. 5). Laser stimulation of GABAPOA→TMN neurons significantly enhanced wake→NREM and NREM→REM transitions but decreased wake→wake, NREM→wake and NREM→NREM transitions, indicating that activating these neurons enhanced the initiation of both NREM and REM sleep. It also increased REM→REM and reduced REM→wake transitions, indicating enhanced REM sleep maintenance.
In contrast to ChR2-mediated activation, iC++-mediated silencing of GABAPOA→TMN neurons strongly increased wakefulness and decreased NREM and REM sleep (Fig. 1d–f). In control mice expressing eYFP alone, laser stimulation had no effect (Extended Data Figs. 3d–f, 5c), and the laser-induced changes in sleep and wakefulness were significantly different between the ChR2 and control mice (P<0.0001, bootstrap) and between iC++ and control mice (_P_=0.0015).
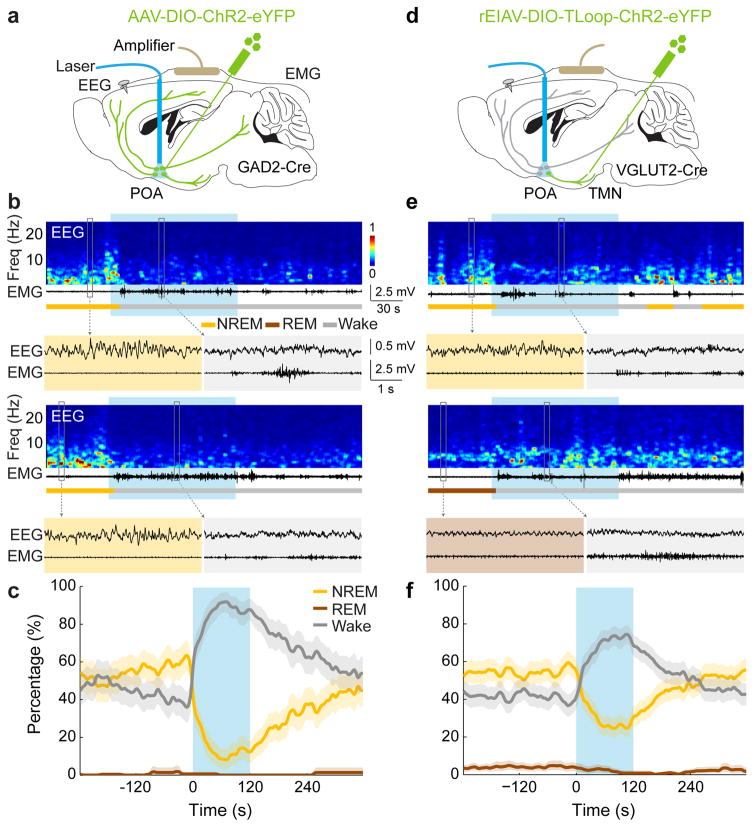
To test whether GABAPOA→TMN neurons are functionally distinct from other nearby neurons, we injected AAV-DIO-ChR2-eYFP into the POA of GAD2-Cre mice (Fig. 2a), which should infect GABAergic neurons irrespective of their projection targets. Optogenetic activation caused an immediate, long-lasting increase in wakefulness (Fig. 2b,c; Supplementary Video 2), through enhanced NREM→wake and decreased wake→NREM transitions (Extended Data Fig. 5d). Thus, although the POA GABAergic population contains both sleep- and wake-promoting neurons6,7, the effect of non-selective activation is dominated by that of the wake-promoting neurons. We also injected the ChR2-expressing lentivirus into the TMN of VGLUT2-Cre mice (Fig. 2d). Activation of VGLUTPOA→TMN neurons strongly increased wakefulness (Fig. 2e,f), indicating that the sleep-promoting effect is specific to neurons that are both GABAergic and TMN projecting.
Figure 2. Optogenetic activation of GABAPOA or VGLUTPOA→TMN neurons promotes wakefulness.
a, Schematic for optogenetic stimulation of GABAPOA neurons. Mouse brain figure adapted with permission from ref. 31. b, Two example trials. Blue shading, laser stimulation (10 Hz, 120 s). c, Percentage of time in wake, NREM, or REM state, averaged from 5 mice (P<0.0001 for increased wakefulness, bootstrap). Shading, 95% CI. d–f, Similar to a–c, for optogenetic stimulation of VGLUTPOA→TMN neurons (P<0.0001 for increase in wakefulness, bootstrap, n=4 mice).
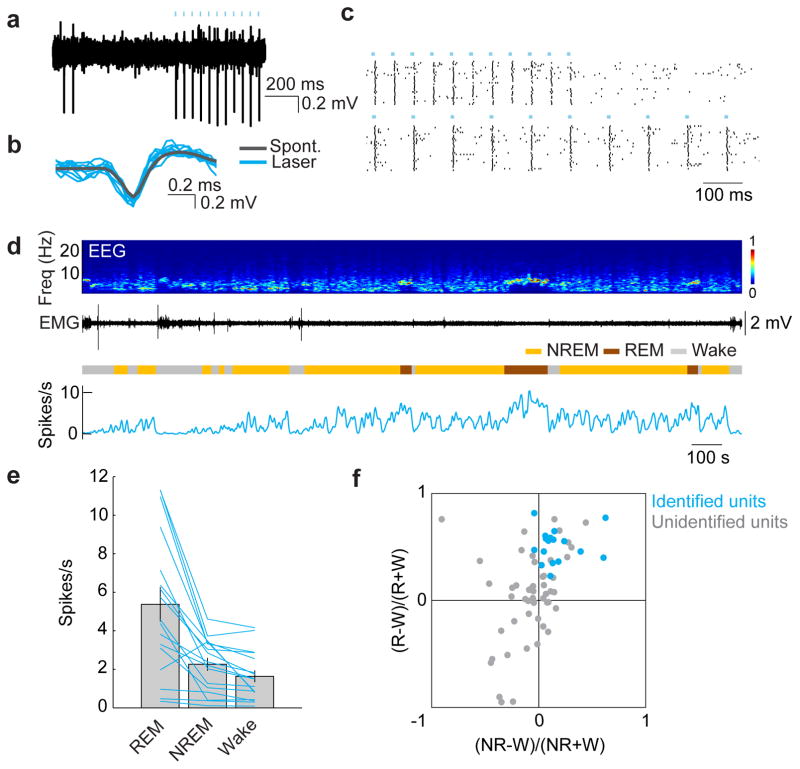
Although c-Fos staining suggests that many GABAPOA→TMN neurons are sleep active (Extended Data Fig. 2i), c-Fos expression is also modulated by non-activity-related factors. To measure directly the spiking activity of ChR2-labeled GABAPOA→TMN neurons, we performed optrode recordings in freely moving GAD2-Cre mice. High-frequency laser pulse trains (10 or 20 Hz, 5–10 ms/pulse, 1 s/train) were applied intermittently, and single units exhibiting reliable laser-evoked spiking with short latencies and low jitter were identified as GABAPOA→TMN neurons (Fig. 3a–c; Extended Data Fig. 6a,b). For the 17 identified neurons, the mean firing rate was significantly higher during REM (_P_=8.5×10⁻⁴, Wilcoxon signed rank test) and NREM (_P_=0.0014) sleep than wakefulness. Individually, all 17 neurons showed higher firing rates during REM sleep than wakefulness, and 13 of them also showed higher rates during NREM sleep (P<0.05, Wilcoxon rank sum test; the remaining 4 cells showed no significant difference between NREM and wake states; Fig. 3d–f). Within each NREM episode, the activity increased gradually, especially during the episodes preceding REM sleep, and the firing rates were positively correlated with EEG power in the theta (4–12 Hz) and sigma (9–25 Hz) bands but negatively in the gamma (40–120 Hz) band (Extended Data Fig. 6d,e). Compared to these identified GABAPOA→TMN neurons, the 51 unidentified POA neurons showed much greater functional diversity (Fig. 3f; Extended Data Fig. 6c), including many that were maximally active during wakefulness6,7.
Figure 3. Optogenetically identified GABAPOA→TMN neurons are active during sleep.
a, Example recording of spontaneous and laser-evoked spikes from a GABAPOA→TMN neuron. Blue ticks, laser pulses. b, Comparison between laser-evoked (blue) and averaged spontaneous (grey) spike waveforms. c, Spike raster showing multiple laser stimulation trials at 10 and 20 Hz. d, Firing rates of an example GABAPOA→TMN neuron. e, Firing rates of 17 identified GABAPOA→TMN neurons during different brain states. Each line shows firing rates of one unit; grey bar, average across units. Error bar, ±s.e.m. f, Firing rate modulation of 17 identified (blue, from 7 mice) and 51 unidentified (grey, 11 mice) units. W, wake; R, REM; NR, NREM.
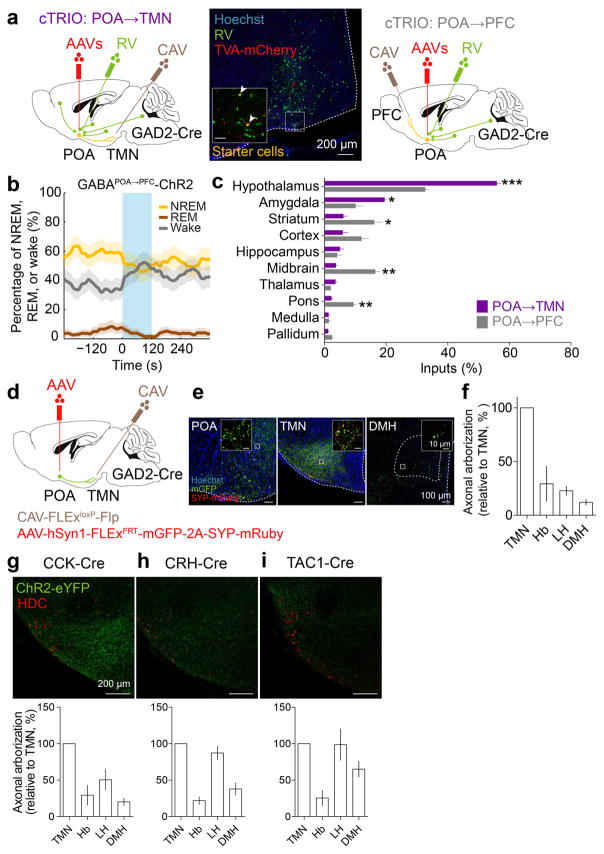
To explore the circuit mechanisms regulating GABAPOA→TMN neuron activity, we mapped their monosynaptic inputs using cell type-specific tracing the relationship between input and output (cTRIO)15. We found GFP-labeled presynaptic neurons in multiple brain regions (Extended Data Fig. 7a,c). Compared to PFC-projecting GABAergic (GABAPOA→PFC) neurons, which are wake promoting (Extended Data Fig. 7b), GABAPOA→TMN neurons received fewer inputs from the striatum, midbrain and pons, but more inputs from the hypothalamus and amygdala (Extended Data Fig. 7c). To reveal their collateral projections to other brain areas, we expressed membrane-bound GFP (mGFP) and synaptophysin-mRuby (SYP-mRuby) in GABAPOA→TMN neurons. In addition to the TMN, GABAPOA→TMN neurons project to several brain areas and likely form local synapses within the POA (Extended Data Fig. 7d–f), suggesting that multiple pathways may contribute to their sleep-promoting effects.
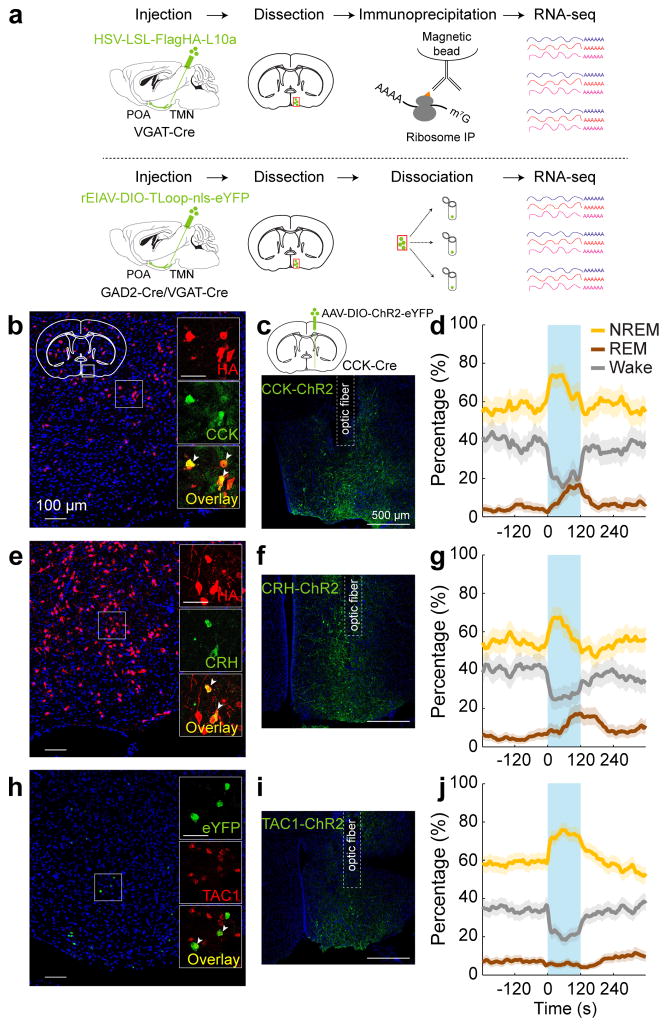
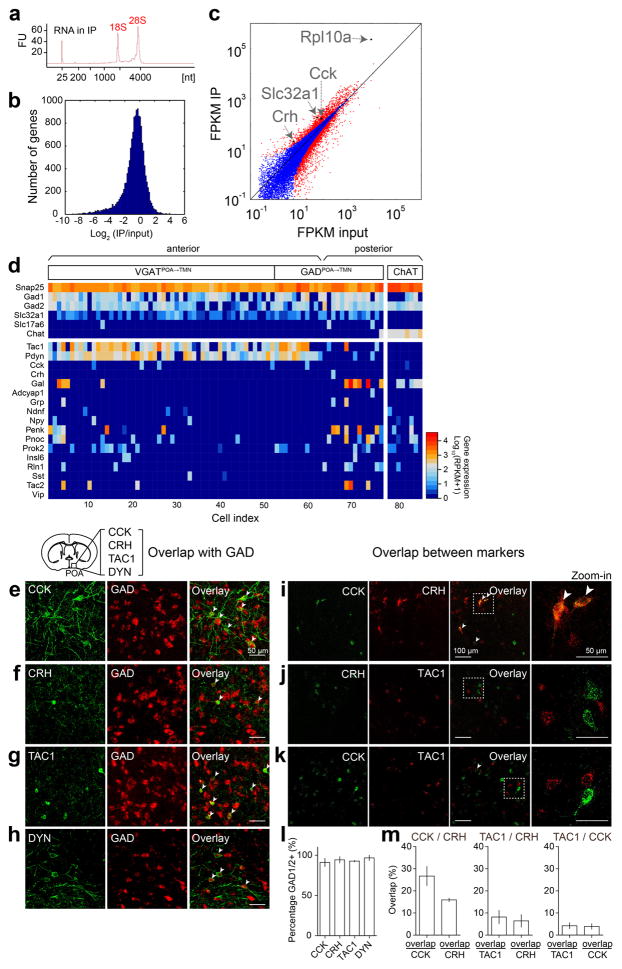
To gain easier genetic access to GABAPOA→TMN neurons without relying on retrograde viruses, we next set out to identify their molecular markers. First, we used translating ribosome affinity purification (TRAP)16 (Fig. 4a; Extended Data Fig. 8a). RNA-seq revealed multiple genes enriched in immunoprecipitated (IP) RNA from GABAPOA→TMN neurons relative to the input RNA (whole lysates before IP, Extended Data Fig. 8b,c, Supplementary Table 1). We focused on the genes encoding neuropeptides, because they play important roles in behavioral regulation and have proved to be useful markers for specific cell types. Among the highly enriched neuropeptides (Supplementary Table 2), we closely examined CRH and CCK, both of which have been implicated in sleep regulation17,18. Immunohistochemistry showed that CCK and CRH are expressed in partially overlapping subsets of GABAPOA→TMN neurons (Fig. 4b,e; Extended Data Fig. 8e–m).
Figure 4. Identification of molecular markers for POA sleep neurons.
a, Schematics of TRAP (upper) and single-cell RNA-seq (lower) for gene profiling. Mouse brain figure adapted with permission from ref. 31. b, Overlap between HA labeling of GABAPOA→TMN neurons and CCK expression. Shown is a coronal section at the POA stained with HA antibody (red) and Hoechst (blue). Region within the square is magnified (inset; scale bar, 50 μm). Arrowheads, HA-labeled neurons stained with CCK antibody; 49.1±7.5% of HA+ neurons are CCK+ (n=3 mice). c, Schematic of optogenetic activation of POA CCK neurons (top) and a fluorescence image of POA in a CCK-Cre mouse injected with AAV-DIO-ChR2-eYFP. d, Percentage of time in wake, NREM, or REM state before, during, and after optogenetic stimulation (blue shading, 10 Hz, 120 s) of CCK neurons (_P_=0.0007 for REM, P<0.0001 for NREM and wake, bootstrap; n=4 mice). e, Overlap between HA labeling and CRH expression. 17.1±1.9% of HA-labeled neurons are CRH+ (arrowheads; n=3 mice). f, A fluorescence image of POA in a CRH-Cre mouse injected with AAV-DIO-ChR2-eYFP. g, Percentage of time in wake, NREM, or REM state, averaged from 5 CRH-Cre mice (_P_=0.0014 for NREM, P<0.0001 for REM and wake). h, Overlap between eYFP labeling of GABAPOA→TMN neurons and TAC1 expression. Arrowheads, eYFP+ neurons expressing TAC1 (fluorescence in situ hybridization, n=2 mice). i, A fluorescence image of POA in a TAC1-Cre mouse injected with AAV-DIO-ChR2-eYFP. j, Percentage of time in wake, NREM, or REM state, averaged from 7 TAC1-Cre mice (P<0.0001 for NREM and wake). Shading, 95% CI.
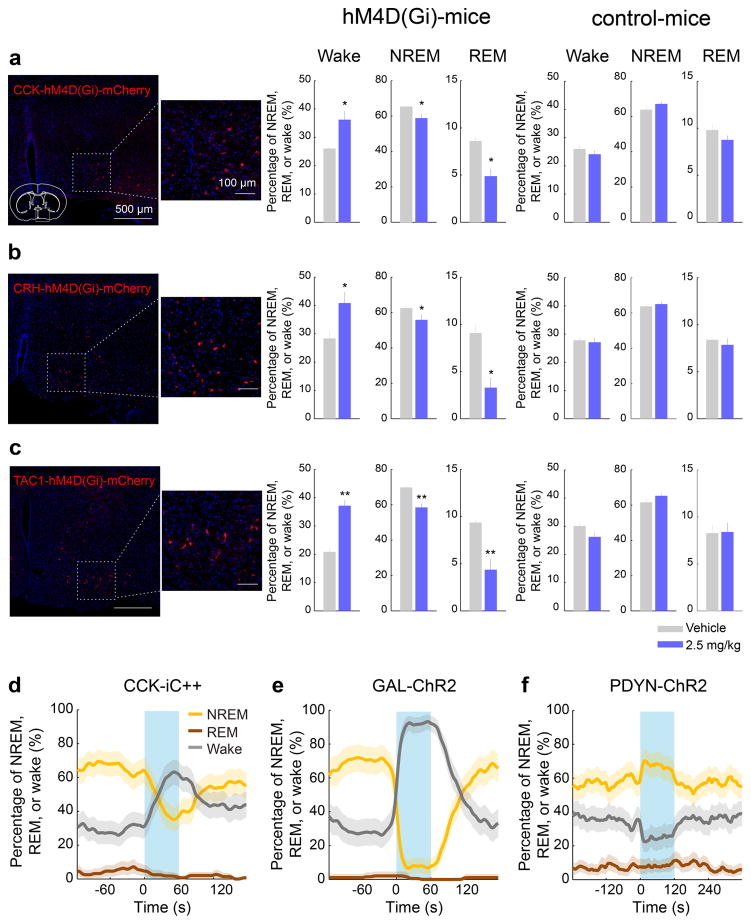
We then tested whether CCK- or CRH-expressing POA neurons promote sleep. In CCK- and CRH-Cre mice19 injected with AAV-DIO-ChR2-eYFP into the POA (Fig. 4c,f), laser stimulation significantly decreased wakefulness and increased NREM and REM sleep (Fig. 4d,g; Supplementary Video 3) by enhancing both the initiation and maintenance of the sleep states (Extended Data Fig. 9a,b). Furthermore, we pharmacogenetically inhibited these neurons by injecting AAV-FLEX-hM4D(Gi)–mCherry into the POA of CCK- or CRH-Cre mice20 (Extended Data Fig. 10a,b). Compared to vehicle injection, clozapine-N-oxide (CNO) injection reduced REM and NREM sleep and increased wakefulness in mice expressing hM4D(Gi) but not in control mice (Extended Data Fig. 10a,b). iC++-mediated silencing of CCK neurons also reduced REM and NREM sleep and increased wakefulness (Extended Data Fig. 10d).
Notably, we also found significant enrichment of galanin (GAL_,_ Supplementary Table 2), a neuropeptide highly expressed in VLPO sleep-active neurons11,21. However, optogenetic activation of GAL neurons increased wakefulness and decreased sleep (Extended Data Fig. 10e). This may be because in mice and several other species, GAL is also expressed in some wake-active neurons21, and the effect of activating both groups of GAL neurons was dominated by increased wakefulness.
As a complement to TRAP, we also performed single-cell RNA-seq of GABAPOA→TMN neurons labeled by rEIAV-DIO-TLoop-nls-eYFP (Fig. 4a). We found high-level expression of Tac1 (Extended Data Fig. 8d). This gene encodes several tachykinin peptides including substance P, which is implicated in sleep regulation22. Fluorescence in situ hybridization showed Tac1 expression in 48.4 ± 8.4% of eYFP-labeled neurons (Fig. 4h), but only in ~10% of GAD1+ POA neurons (Extended Data Fig. 8g), confirming its preferential labeling of GABAPOA→TMN neurons. In TAC1-Cre mice injected with AAV-DIO-ChR2-eYFP in the POA (Fig. 4i), optogenetic stimulation decreased wakefulness and enhanced NREM sleep (Fig. 4j) by increasing the initiation and maintenance of NREM sleep (Extended Data Fig. 9c). Conversely, pharmacogenetic inhibition of these neurons increased wakefulness and decreased sleep (Extended Data Fig. 10c). Another highly expressed gene is Pdyn (Extended Data Fig. 8d), which encodes several opioid peptides including dynorphin A, the infusion of which into the VLPO increases NREM sleep23. Optogenetic activation of PDYN neurons also increased NREM sleep and decreased wakefulness (Extended Data Figs. 9d, 10f). Notably, although TAC1 partially overlaps with CCK and CRH in the POA (Extended Data Fig. 8j,k,m), the effect of activating TAC1 neurons (increasing only NREM sleep) is different from activating CCK or CRH neurons (increasing both REM and NREM sleep, Fig. 4d,g). This raises the possibility that the GABAPOA→TMN population consists of separate subpopulations promoting REM and NREM sleep. In addition, Tac1 and Pdyn were not identified by TRAP, and Cck and Crh were not identified by single-cell RNA-seq. This suggests that given the technical limitations of both methods24, using them in parallel can enhance the likelihood of identifying markers for sleep-promoting neurons.
Using optogenetic manipulation and recording, virus-mediated circuit tracing, and gene profiling, we have characterized a population of POA sleep neurons and identified their markers. Similar to previous studies6,7, we observed high functional diversity among unidentified POA neurons. In contrast, all identified GABAPOA→TMN neurons were sleep active, forming a much more homogeneous subpopulation (Fig. 3). Whereas activating VGLUTPOA→TMN or GABAPOA neurons induced wakefulness (Fig. 2), GABAPOA→TMN neuron activation strongly enhanced sleep (Fig. 1). These results underscore the importance of labeling with both cell-type and projection-target specificity in order to single out the sleep neurons from their neighboring wake neurons.
Among the peptide markers enriched in GABAPOA→TMN neurons, CCK, CRH, TAC1, and PDYN labeled POA sleep-promoting neurons (Fig. 4, Extended Data Figs. 9, 10). All four peptides were shown to promote sleep when applied systemically17, overexpressed in specific brain regions18, or injected into the POA22,23. However, most POA neurons expressing these markers are likely to co-release GABA (Extended Data Fig. 8e–h). The extent to which their sleep-promoting effects are mediated by GABA vs. the neuropeptides remains to be investigated. Moreover, although activation of POA→TMN GABAergic projection can enhance sleep4 (Extended Data Fig. 4), the effect of activating the POA sleep neurons may not be mediated by this pathway alone. These neurons project to multiple other areas and form local connections within the POA (Extended Data Figs. 7d–i); whether and how they interact with other sleep-wake control circuits25–30 remain to be elucidated. Nevertheless, identification of their molecular markers allows selective targeting of these neurons using readily available Cre mouse lines. Given the plethora of Cre-dependent viral tools and reporter mice for optogenetic/pharmacogenetic manipulations, imaging, and circuit tracing, our findings will greatly facilitate future studies of the sleep control network.
Methods
Animals
GAD2-IRES-Cre, VGLUT2-IRES-Cre, VGAT-IRES-Cre, GAD1-eGFP, CCK-IRES-Cre, CRH-IRES-Cre, TAC1-IRES-Cre, and HDC-IRES-Cre mice (Jackson stock no: 010802, 016963, 016962, 007677, 012706, 012704, 021877, and 021198, respectively) were obtained from Jackson Laboratory19,32,33 and VGLUT2-eGFP mice were from MMRRC (MMRRC#011835-UCD). PDYN-IRES-Cre mice were obtained from Bradford Lowell34. GAL-Cre mice were obtained from GENSAT (stock no: KI87). Mice were housed in 12 hrs light-dark cycle (lights on 07:00 am and off at 19:00 pm) with free access to food and water. Experiments were performed in adult male or female mice (6–12 weeks old). All procedures were approved by Institutional Animal Care and Use Committees of the University of California, Berkeley, University of California, San Francisco, Allen Institute for Brain Science and Stanford University and were done in accordance with federal regulations and guidelines on animal experimentation.
Note that in different experiments GAD1, GAD2, and VGAT were used to identify GABAergic neurons. To examine the relationship between GAD1, GAD2, and VGAT in the POA, we quantified the overlap between GAD1 and VGAT based on the double in situ hybridization data from the Allen Mouse Brain Atlas (http://connectivity.brain-map.org/transgenic/experiment/100142488) and found that 95% (327/345) of VGAT-positive neurons also contain GAD1. Comparison between GAD1 and GAD2 expression in the POA (http://connectivity.brain-map.org/transgenic/experiment/100142491) showed that 99% (246/248) of GAD1 neurons also contain GAD2. Together, these data indicate a very high degree of overlap between GAD1, GAD2 and VGAT in the POA.
Virus Preparation
AAV2-EF1α-DIO-ChR2-eYFP and AAV8-hSyn-FLEX-hM4D(Gi)–mCherry were obtained from the University of North Carolina (UNC) vector core. The final titer was estimated to be ~1012 gc/mL. AAVDJ-EF1α-DIO-ChR2-eYFP, AAVDJ-EF1α-DIO-eYFP, AAV8-EF1α-DIO-iC++-eYFP and AAVDJ-EF1α-DIO-iC++-eYFP were obtained from Stanford University virus core. Lentivirus rEIAV-DIO-TLoop-ChR2-eYFP, rEIAV-DIO-TLoop-iC++-eYFP and rEIAV-DIO-TLoop-nls-eYFP were obtained from Salk virus core and Allen Institute for Brain Science13. Rabies tracing reagents [AAV-CAG-FLExloxP-TVA-mCherry, AAV-CAG-FLExloxP-RG and EnvA-pseudotyped, glycoprotein (RG)-deleted, and GFP-expressing rabies viral particles (RV_dG_)], cTRIO reagents [CAV-FLExloxP-Flp, AAV-FLExFRT-TVA-mCherry, AAV-FLExFRT-RG, and EnvA-pseudotyped, glycoprotein (RG)-deleted, and GFP-expressing rabies viral particles (RV_dG_)] and axon arborization analysis reagents [CAV-FLExloxP-Flp and AAV-hSyn1-FLExFRT-mGFP-2A-synaptophysin-mRuby] were obtained from Stanford University15. HSV-LoxSTOPLox-FlagHA-L10a was obtained from UCSF.
Sequence for nls-eYFP used in rEIAV-DIO-TLoop-nls-eYFP: atgtctagaatggcccccaagaagaagaggaaggtggccgccaccatggtgagcaagggcgaggagctgttcaccggggtggtgcccatcctggtcgagctggacggcgacgtaaacggccacaagttcagcgtgtccggcgagggcgagggcgatgccacctacggcaagctgaccctgaagttcatctgcaccaccggcaagctgcccgtgccctggcccaccctcgtgaccaccttcggctacggcctgcagtgcttcgcccgctaccccgaccacatgaagcagcacgacttcttcaagtccgccatgcccgaaggctacgtccaggagcgcaccatcttcttcaaggacgacggcaactacaagacccgcgccgaggtgaagttcgagggcgacaccctggtgaaccgcatcgagctgaagggcatcgacttcaaggaggacggcaacatcctggggcacaagctggagtacaactacaacagccacaacgtctatatcatggccgacaagcagaagaacggcatcaaggtgaacttcaagatccgccacaacatcgaggacggcagcgtgcagctcgccgaccactaccagcagaacacccccatcggcgacggccccgtgctgctgcccgacaaccactacctgagctaccagtccgccctgagcaaagaccccaacgagaagcgcgatcacatggtcctgctggagttcgtgaccgccgccgggatcactctcggcatggacgagctgtacaagtaaaa
Surgery
Mice of specific genotype were randomly assigned to experimental and control groups. Experimental and control animals were subjected to exactly the same surgical and behavioral manipulations. Data from animals used in experiments were excluded based on histological criteria that included injection sites, virus expression and optical fiber placement. Only animals with injection sites and optic fiber placement in the region of interest were included.
To implant electroencephalogram (EEG) and electromyogram (EMG) recording electrodes, adult mice (6–12 weeks old) were anesthetized with 1.5–2% isoflurane and placed on a stereotaxic frame. Two stainless steel screws were inserted into the skull 1.5 mm from midline and 1.5 mm anterior to the bregma, and two others were inserted 3 mm from midline and 3.5 mm posterior to the bregma. Two EMG electrodes were inserted into the neck musculature. Insulated leads from the EEG and EMG electrodes were soldered to a 2 × 3 pin header, which was secured to the skull using dental cement.
For optogenetic activation/inhibition experiments, a craniotomy was made on top of the target region for optogenetic manipulation in the same surgery as for EEG and EMG implant, and 0.1–0.5 μl virus was injected into the target region using Nanoject II (Drummond Scientific) via a micro pipette. We then implanted optic fibers bilaterally into the target region. Dental cement was applied to cover the exposed skull completely and to secure the implants for EEG and EMG recordings to the screws. After surgery, mice were allowed to recover for at least 2–3 weeks before experiments. For anti-histamine experiments (Extended Data Fig 4), triprolidine (Tocris) was administered intraperitoneally at 20 mg/kg and brain states were recorded for 3 hrs.
For retrograde tracing in Extended Data Fig. 1a, 0.2–0.3 μl red or green RetroBeads (Lumafluor, Inc) was injected into each target region.
For optrode recording experiments, the optrode assembly was inserted into the POA at a depth of 4.9 mm. Screws were attached to the skull for EEG recordings, and an EMG electrode was inserted into the neck musculature. The optrode assembly, screws and EEG/EMG electrodes were secured to the skull using dental cement. Related to Fig. 3 and Extended Data Figs. 6.
For rabies tracing, AAV-CAG-FLExloxP-TVA-mCherry and AAV-CAG-FLExloxP-RG were injected into the TMN of HDC-Cre mice. Two to three weeks later, EnvA-pseudotyped, glycoprotein (RG)-deleted, and GFP-expressing rabies viral particles (RV_dG_) were injected into the TMN, and mice were sacrificed 1 week later. Related to Extended Data Fig. 2.
For cTRIO experiments, a retrograde virus CAV-FLExloxP-Flp (5.0 × 10¹² gc/mL) was injected into either the TMN or the PFC of GAD2-Cre mice to express Flp recombinase specifically in GABAPOA→TMN or GABAPOA→PFC neurons, and AAV-FLExFRT-TVA-mCherry (2.6 × 10¹² gc/mL) and AAV-FLExFRT-RG (1.3 × 10¹² gc/mL) were injected into the POA to express TVA (the receptor for the EnvA envelope glycoprotein)-mCherry and RG in the Flp-expressing neurons. Two to three weeks later, EnvA-pseudotyped, glycoprotein (RG)-deleted, and GFP-expressing rabies viral particles (RV_dG_) (5.0 × 10⁸ colony forming units (cfu)/mL) were injected into the POA, and mice were sacrificed 1 week later for histology. Related to Extended Data Fig. 7.
For axon arborization experiments, CAV-FLExloxP-Flp was injected into TMN, and AAV-hSyn1-FLExFRT-mGFP-2A-synaptophysin-mRuby was injected into the POA of GAD2-Cre mice. Mice were sacrificed 4–7 weeks later for histology. Related to Extended Data Fig. 7.
For pharmacogenetic experiments, AAV8-hSyn-FLEX-hM4D(Gi)-mCherry was injected bilaterally into the POA. Related to Extended Data Fig. 10.
For TRAP experiments, we injected Cre-inducible HSV expressing the large ribosomal subunit protein Rpl10a fused with FLAG/hemagglutinin (HA) tag (HSV-LoxSTOPLox-FlagHA-L10a) into the TMN of VGAT-Cre mice. After 30–45 days of expression, the POA was dissected, and ribosome immunoprecipitation was performed to pull down the mRNAs attached to Rpl10a. Related to Fig. 4 and Extended Data Fig. 8.
For single cell RNA-seq experiments, rEIAV-DIO-TLoop-nls-eYFP was injected into the TMN of GAD2-Cre and VGAT-Cre mice. Four weeks later, we dissociated eYFP-labeled POA neurons for single-cell RNA-seq. Related to Fig. 4 and Extended Data Fig. 8.
For immunohistochemistry detecting peptides, mice received a single intraventricular injection of colchicine (12 μg) 1–2 days before killing. Related to Fig. 4.
Stereotaxic coordinates:
- TMN: AP −2.45 mm, ML 1 mm, DV 5–5.2 mm from the cortical surface
- POA: AP 0 mm, ML 0.7 mm, DV 5.2 mm
- PFC: AP +2.0 mm, ML 0.4 mm, DV 2 mm
- vlPAG: AP −4.7 mm, ML 0.7 mm, DV 2.3 mm
- DMH: AP −1.8 mm, ML 0.4 mm, DV 5.2 mm
- Hb: AP −1.8 mm, ML 0.5 mm, DV 2.2 mm
Sleep deprivation and sleep rebound experiment
Sleep deprivation started at the beginning of the light period (7 am) and lasted till 1 pm. Mice were kept awake by a combination of cage tapping, introduction of foreign objects such as paper towels, cage rotation, and fur stroking with a paintbrush35, gentle handling procedures that have been used extensively to induce sleep deprivation36. EEG and EMG were not recorded during sleep deprivation and recovery. After 6 hrs of deprivation, sleep-deprived mice were allowed rebound sleep for 4 hrs before being euthanized by cervical dislocation and decapitation. c-Fos immunohistochemistry was performed as described below. Related to Extended Data Figs.1 and 2.
Sleep recording
Behavioral experiments were carried out in home cages placed in sound-attenuating boxes. Sleep recordings were carried out between 12:00 and 19:00 (light on at 7:00 and off at 19:00). EEG and EMG electrodes were connected to flexible recording cables via a mini-connector. EEG and EMG signals were recorded and amplified using AM Systems, digitally filtered (0.1–1000 Hz and 10–1000 Hz for EEG and EMG recordings respectively), and digitized at 600 Hz using LabView. Spectral analysis was carried out using fast Fourier transform (FFT), and brain states were classified into NREM, REM and wake states (wake: desynchronized EEG and high EMG activity, NREM: synchronized EEG with high-amplitude, low-frequency (0.5–4 Hz) activity and low EMG activity, REM: high power at theta frequencies (6–9 Hz) and low EMG activity). Brain states were classified into NREM sleep, REM sleep, and wakefulness using custom-written MATLAB software, and the classification was performed without any information about the identity of the animal or laser stimulation timing as previously described25.
Optogenetic manipulation
Each optic fiber (200 μm diameter; ThorLabs) was attached through an FC/PC adaptor to a 473-nm blue laser diode (Shanghai laser), and light pulses were generated using a Master 8 (A.M.P.I.). All photostimulation/inhibition experiments were conducted bilaterally and fiber optic cables were connected at least 2 hrs before the experiments for habituation. For photostimulation/inhibition experiments in ChR2-, iC++- or eYFP-expressing mice, light pulses (10 ms/pulse, 10 Hz, 4–8 mW) or step pulses (60 sec) were triggered using Master 8 that provided simultaneous input into two blue lasers. In each optogenetic manipulation experiment, inter-stimulation interval for optogenetic manipulation was chosen randomly from a uniform distribution between 15 and 25 min.
Optrode recordings
Custom-made optrodes37 consisted of an optic fiber (200 μm in diameter) glued together with 6 pairs of stereotrodes. Two FeNiCr wires (Stablohm 675, California Fine Wire) were twisted together and electroplated to an impedance of ~ 600 kΩ using a custom built plating device. The optrode was attached to a driver to allow vertical movement of the optrode assembly. The optrode was slowly lowered to search for light-responsive neurons. Wires to record cortical EEG and EMG from neck musculatures were also attached for simultaneous recordings. A TDT RZ5 amplifier was used for all the recordings, signals were filtered (0.3–8 kHz) and digitized at 25 kHz. At the end of the experiment, an electrolytic lesion was made by passing a current (100 μA, 10 s) through one or two electrodes to identify the end of the recording tract.
Spikes were sorted offline based on the waveform energy and the first three principal components of the spike waveform on each stereotrode channel. For single unit isolation, all channels were separated into groups and spike waveforms were identified either manually using Klusters (http://neurosuite.sourceforge.net/) or automatically using the software klustakwik (http://klustakwik.sourceforge.net/). The quality of each unit was assessed by the presence of a refractory period and quantified using isolation distance and L-ratio. Units with an isolation distance < 20 and L-ratio > 0.1 were discarded38.
To identify ChR2-tagged neurons, laser pulse trains (10 and/or 20 Hz) were delivered intermittently every min. A unit was identified as ChR2 expressing if spikes were evoked by laser pulses with short first-spike latency (< 6 ms for all units in our sample) and the waveforms of the laser-evoked and spontaneous spikes were highly similar (correlation coefficient > 0.9). Mean latency of all identified units was 3.05 ms. Mean correlation coefficient of all identified units was 0.99. To calculate the average firing rate of each unit in each brain state, spikes during the laser pulse trains were excluded. Related to Fig. 3 and Extended Data Figs. 6.
Immunohistochemistry
Mice were deeply anesthetized and transcardially perfused using PBS followed by 4% paraformaldehyde in PBS. Brains were post-fixed in fixative and stored in 30% sucrose in PBS overnight for cryoprotection. Brains were embedded and mounted with Tissue-Tek OCT compound (Sakura finetek) and 20 μm sections were cut using a cryostat (Leica). Brain slices were washed using PBS, permeabilized using PBST (0.3% Triton X-100 in PBS) for 30 min and then incubated with blocking solution (5% normal goat serum or normal donkey serum in PBST) for 1 hr followed by primary antibody incubation overnight at 4 °C using following antibodies:
- anti-GFP antibody (A-11122 or A-11120, Life technologies, 1:1000)
- anti-cFos antibody (sc-52-G and sc-52, Santa cruz biotech, 1:1000)
- anti-CCK-8 antibody (20078, Immunostar, 1:500)
- anti-CRH antibody (sc-1759, Santa cruz biotech, 1:500)
- anti-HA antibody (C29F4, Cell signaling tech, 1:1000)
- anti-HDC antibody (16045, Progen, 1:1000)
The next day, slices were washed with PBS and incubated with appropriate secondary antibodies for 2 hrs (1:500, All from Invitrogen):
- A-11008, alexa fluor 488 goat anti-rabbit IgG
- A-21206, alexa fluor 488 donkey anti-rabbit IgG
- A-11055, alexa fluor 488 donkey anti-goat IgG
- A-21202, alexa fluor 488 donkey anti-mouse IgG
- A-11012, alexa fluor 594 goat anti-rabbit IgG
- A-21207, alexa fluor 594 donkey anti-rabbit IgG
- A-11058, alexa fluor 594 donkey anti-goat IgG
- A-21245, alexa fluor 647 goat anti-rabbit IgG
The slices were washed with PBS followed by counterstaining with DAPI or Hoechst and coverslipped. Fluorescence images were taken using a confocal microscope (LSM 710 AxioObserver Inverted 34-Channel Confocal, Zeiss) or Nanozoomer (Hamamatsu).
Fluorescence in situ hybridization (FISH)
FISH was performed with two methods. First, FISH for CCK, CRH, TAC1 and GAD1 was performed using RNAscope assays according to the manufacturer’s instructions (Advanced cell Diagnostics). Second, to make TAC1, GAD1 and GAD2 FISH probes, DNA fragments containing the coding or untranslated sequences were amplified using PCR from mouse whole brain cDNA (Zyagen). A T7 RNA polymerase recognition site was added to the 3′ end of the PCR product. The PCR product was purified using a PCR purification kit (QIAGEN). 1 μg of DNA was used for in vitro transcription by using digoxigenin (DIG) RNA labeling mix (Roche) and T7 RNA polymerase. After DNAse I treatment for 30 min at 37 °C, the RNA probe was purified using probeQuant G-50 Columns (GE Healthcare). 20 μm sections were pretreated with proteinase K (0.1 μg/ml), acetylated, dehydrated through ethanol (50, 70, 95, and 100%), and air dried. Pretreated sections were then incubated for 16–20 hrs at 60 °C, in a hybridization buffer containing sense or antisense riboprobes. After the sections were hybridized, they were treated with RNase A (20 μg/ml) for 30 minutes at 37 °C and then washed four times in decreasing salinity (from 2× to 0.1× standard saline citrate [SSC] buffer) and a 30 min wash at 68 °C. Sections were incubated with 3% hydrogen peroxide in PBS for 1 hr and washed using PBS. After incubation in the blocking buffer for 1 hr (TNB buffer, Perkin Elmer), sections were incubated with anti-DIG-POD antibody (1:500, Roche) in TNB buffer for 2 hrs. TSA-plus-Fluorescein reagent was used to visualize the signal. For GAD-FISH, anti-DIG-AP antibody (1:500, Roche) and Fast Red TR/Naphthol AS-MX (F4523, Sigma-Aldrich) were used to visualize the signal. After washing the sections in PBS, they were incubated with blocking buffer for 2 hrs followed by incubation with anti-GFP antibody overnight, and finally incubated with a secondary antibody as described above. To examine the overlap between each peptide marker and GAD, we used CCK-, CRH-, TAC1-, and PDYN-Cre mice injected with AAV-EF1α-DIO-ChR2-eYFP or AAV-EF1α-DIO-eYFP. Related to Extended Data Figs. 2 and 8.
cTRIO data analysis
For analysis of rabies tracing data, consecutive 60 μm coronal sections were collected and stained using Hoechst. Slides were scanned using Nanozoomer (Hamamatsu). GFP+ input neurons were counted from the forebrain to the posterior brainstem except sections adjacent to the injection sites (1 mm from the injection site), and grouped into 10 regions based on Allen Mouse Brain Atlas (http://mouse.brain-map.org/static/atlas) using anatomical landmarks in the sections visualized by Hoechst staining and autofluorescence. We normalized the number of neurons in each region by the total number of input neurons in the entire brain. Related to Extended Data Fig. 7.
Axon arborization analysis
Consecutive 60 μm coronal sections were collected and stained using Hoechst. Slides were scanned using a Nanozoomer (Hamamatsu). All images were acquired using identical settings and were analyzed using ImageJ as previously described15. Images were background subtracted (rolling ball radius of 50 pixels), thresholded, and pixels above this threshold were interpreted as positive signals. The mGFP or eYFP labeled axon arborization signal was measured for each region and averaged across the 5 sections. Related to Extended Data Figs. 7.
TRAP
We adapted a previously described procedure to perform TRAP experiment39. Mice were sacrificed at 12–2 pm and the POA was rapidly dissected on ice with a dissection buffer (1xHBSS, 2.5 mM HEPES [pH 7.4], 4 mM NaHCO3, 35mM Glucose, 100 μg/ml Cycloheximide). Brains from 6 mice were then pooled, homogenized in the homogenization buffer (10 mM HEPES [pH 7.4], 150 mM KCl, 5 mM MgCl2, 100 nM calyculin A, 2 mM DTT, 100 U/ml RNasin, 100 μg/ml cycloheximide and protease). Homogenates were transferred to a microcentrifuge tube and clarified at 2,000×g for 10 min at 4°C. The supernatant was transferred to a new tube, and 70 μl of 10% NP40 and 70 μl of 1,2-diheptanoyl-_sn_-glycero-3-phosphocholine (DHPC, 300mM) per 1ml of supernatant were added. This solution was mixed and then clarified at 17,000×g for 10 min at 4°C. The resulting high-speed supernatant was transferred to a new tube. This supernatant served as the input. A small amount (25 μl) was added to a new tube containing 350 μl of buffer RLT for future input RNA purification.
Immunoprecipitation was performed with an anti-FLAG antibody loaded beads. The beads were washed four times using 0.15M KCI Wash buffer (10 mM HEPES [pH 7.4], 350 mM KCl, 5 mM MgCl2, 2 mM DTT, 1% NP40, 100 U/ml RNasin, and 100 μg/ml cycloheximide). After the final wash the RNA was eluted by addition of buffer RLT (350 μL) to the beads on ice, the beads removed by a magnet, and the RNA purified using the RNeasy Micro Kit (QIAGEN) and analyzed using an Agilent 2100 Bioanalyzer. cDNA libraries for RNA-seq were prepared with Ovation RNA-Seq System V2 and Ovation Ultralow Library Systems (NuGen) and analyzed on an Illumina HiSeq 2500. Gene classification shown in Supplementary Table 1 was carried out using Panther (http://pantherdb.org/)40. Related to Fig. 4 and Extended Data Fig. 8.
Single cell RNA-seq
We adapted a previously described procedure to isolate fluorescently labeled neurons from the mouse brain41–43.
Single cell isolation
Individual adult male mice (P56 ± 3) were anesthetized in an isoflurane chamber, decapitated, and the brain was immediately removed and submerged in fresh ice-cold artificial cerebrospinal fluid (ACSF) containing 126 mM NaCl, 20 mM NaHCO3, 20 mM dextrose, 3 mM KCl, 1.25 mM NaH2PO4, 2 mM CaCl2, 2 mM MgCl2, 50 μM DL-AP5 sodium salt, 20 μM DNQX, and 0.1 μM tetrodotoxin, bubbled with a carbogen gas (95% O2 and 5% CO2). The brain was sectioned on a vibratome (Leica VT1000S) on ice, and each slice (300–400 μm) was immediately transferred to an ACSF bath at room temperature. After the brain slicing is complete (not more than 15 minutes), individual slices of interest were transferred to a small petri dish containing bubbled room temperature ACSF. The POA was microdissected under a fluorescence dissecting microscope, and the slices before and after dissection were imaged to examine the location of the microdissected tissue and confirm its location. The dissected tissue pieces were transferred to a microcentrifuge tube and treated with 1 mg/ml pronase (Sigma, Cat#P6911-1G) in carbogen-bubbled ACSF for 70 minutes at room temperature without mixing in a closed tube. After incubation, with the tissue pieces sitting at the bottom of the tube, the pronase solution was pipetted out of the tube and exchanged with cold ACSF containing 1% fetal bovine serum. The tissue pieces were dissociated into single cells by gentle trituration through Pasteur pipettes with polished tips of 600, 300, and 150 μm diameter. Single cells were isolated by FACS into individual wells of 96-well plates or 8-well PCR strips containing 2.275 μl of Dilution Buffer (SMARTer Ultra Low RNA Kit for Illumina Sequencing, Clontech Cat#634936), 0.125 μl RNase inhibitor (SMARTer kit), and 0.1 μl of 1:1,000,000 diluted RNA spike-in RNAs (ERCC RNA Spike-In Mix 1, Life Technologies Cat#4456740). Sorting was performed on a BD FACSAriaII SORP using a 130um nozzle, a sheath pressure of 10 psi, and in the single cell sorting mode. To exclude dead cells, DAPI (DAPI*2HCl, Life Technologies Cat#D1306) was added to the single cell suspension to the final concentration of 2 ng/ml. Sorted cells were frozen immediately on dry ice and stored at −80°C.
cDNA amplification and library construction
We used the SMARTer kit above to reverse transcribe single cell RNA and amplify the cDNA for 19 PCR cycles. To stabilize the RNA after quickly thawing the cells on ice, we immediately added to each sample an additional 0.125 μl of RNase inhibitor mixed with SMART CDS Primer II A. All steps downstream were carried out according to the manufacturer’s instructions. cDNA concentration was quantified using Agilent Bioanalyzer High Sensitivity DNA chips. For most samples, 1 ng of amplified cDNA was used as input to make sequencing libraries with Nextera XT DNA kit (Illumina Cat#FC-131-1096). Individual libraries were quantified using Agilent Bioanalyzer DNA 7500 chips. In order to assess sample quality and adjust the concentrations of libraries for multiplexing on HiSeq, all libraries were sequenced first on Illumina MiSeq to obtain approximately 100,000 reads per library, and then on Illumina HiSeq 2000 or 2500 to generate 100 bp reads. Related to Fig. 4 and Extended Data Fig. 8.
Strategy for marker identification
Since both TRAP and single cell RNA-seq have technical limitations and are prone to false-positive and false-negative errors, we used the following strategy for identifying markers for POA sleep neurons:
- To eliminate false-positive errors, the candidate markers with existing Cre lines were tested in optogenetic experiments, and cell types that do not promote sleep were eliminated (e.g., GAL, which was found to be enriched in the TRAP experiment).
- To reduce false-negative errors, we included markers identified by either method in our candidate list, rather than only the ones identified by both methods. This should enhance our chance of finding a useful marker even if it is missed by one of the methods due to false-negative errors. Of course, this strategy could increase the probability for false-positive errors in our candidate list, but these errors are eliminated by the functional test in (a).
Pharmacogenetic manipulation
To inhibit CCK, CRH or TAC1 neurons, we injected CNO dissolved in 0.1 ml vehicle solution (PBS with 0.5 % dimethyl sulfoxide (DMSO)) into CCK-, CRH- or TAC1-Cre mice expressing hM4Di in the POA, 20 min before the recording session. CNO was administered intraperitoneally at 2.5 mg/kg. Vehicle solution was injected for the control experiment. Related to Extended Data Fig. 10.
Slice recording
Slice recordings were made at P42–50. AAVDJ-EF1α-DIO-ChR2-eYFP (500 nl) was injected into the POA of GAD2-Cre mice, and recording was made 2–3 weeks after injection. Slice preparation was according to procedures described previously44. Mouse was deeply anaesthetized with 5% isoflurane. After decapitation, the brain was dissected rapidly and placed in ice-cold oxygenated HEPES buffered artificial cerebrospinal fluid (ACSF; in mM: NaCl 92, KCl 2.5, NaH2PO4 1.2, NaHCO3 30, HEPES 20, glucose 25, sodium ascorbate 5, thiourea 2, sodium pyruvate 3, MgSO4·7H2O 10, CaCl2·2H2O 0.5 and NAC 12, at pH 7.4, adjusted with 10 M NaOH), and coronal sections of the TMN were made with a vibratome (Leica). Slices (300 μm thick) were recovered in oxygenated NMDG-HEPES solution (in mM: NMDG 93, KCl 2.5, NaH2PO4 1.2, NaHCO3 30, HEPES 20, glucose 25, sodium ascorbate 5, thiourea 2, sodium pyruvate 3, MgSO4·7H2O 10, CaCl2·2H2O 0.5 and NAC 12, at pH 7.4, adjusted with HCl) at 32 °C for 10 min and then maintained in an incubation chamber with oxygenated standard ACSF (in mM: NaCl 125, KCl 3, CaCl2 2, MgSO4 2, NaH2PO4 1.25, sodium ascorbate 1.3, sodium pyruvate 0.6, NaHCO326, glucose 10 and NAC 10, at pH 7.4, adjusted by 10 M NaOH) at 25 °C for 1–4 h before recording. All chemicals were from Sigma.
Whole-cell recordings were made at 30 °C in oxygenated solution (in mM: NaCl 125, KCl 4, CaCl22, MgSO4 1, NaH2PO4 1.25, sodium ascorbate 1.3, sodium pyruvate 0.6, NaHCO3 26 and glucose 10, at pH 7.4). Inhibitory postsynaptic currents (IPSCs) were recorded using a cesium-based internal solution (in mM: CsMeSO4 125, CsCl 2, HEPES 10, EGTA 0.5, MgATP 4, Na2GTP 0.3, sodium phosphocreatine 10, TEACl 5, QX-314 3.5, at pH 7.3, adjusted with CsOH, 290–300 mOsm) and isolated by clamping the membrane potential of the recorded neuron at the reversal potential of the excitatory synaptic currents. The resistance of patch pipette was 3–5 MΩ. The cells were excluded if the series resistance exceeded 40 MΩ or varied by more than 20% during the recording period. To activate ChR2, we used a mercury arc lamp (Olympus) coupled to the epifluorescence light path and bandpass filtered at 450–490 nm (Semrock), gated by an electromagnetic shutter (Uniblitz). Blue light pulse (5 ms) was delivered through a 40 × 0.8 NA water immersion lens (Olympus) at a power of 1–2 mW. Data were recorded with a Multiclamp 700B amplifier (Axon instruments) filtered at 2 kHz and digitized with a Digidata 1440A (Axon instruments) at 4 kHz. Recordings were analyzed using Clampfit (Axon instruments). Related to Extended Data Fig. 2.
Single-cell RT-PCR
At the end of each recording, cytoplasm was aspirated into the patch pipette, expelled into a PCR tube as described previously45. The single cell RT-PCR protocol was designed to detect the presence of mRNAs coding for GAPDH, GAD1, VGLUT2 and HDC. First, reverse transcription and the first round of PCR amplification were performed with gene-specific multiplex primer using the SuperScript III One-Step RT-PCR kit (12574-018, Invitrogen) according to the manufacturer’s protocol. Second, nested PCR was carried out using GoTaq Green Master Mix (M7121, Promega) with nested primers for each gene. Amplification products were visualized via electrophoresis using 2% agarose gel.
Primers (5′>3′) for single-cell RT-PCR:
- GAPDH (sense/anti-sense):
multiplex, ACTCCACTCACGGCAAATTC/CACATTGGGGGTAGGAACAC;
nested, AGCTTGTCATCAACGGGAAG/GTCATGAGCCCTTCCACAAT
Final product 331 bp - GAD1 (sense/anti-sense):
multiplex, CACAGGTCACCCTCGATTTT/TCTATGCCGCTGAGTTTGTG;
nested, TAGCTGGTGAATGGCTGACA/CTTGTAACGAGCAGCCATGA
Final product 200 bp - VGLUT2 (sense/anti-sense):
multiplex, GCCGCTACATCATAGCCATC/GCTCTCTCCAATGCTCTCCTC;
nested, ACATGGTCAACAACAGCACTATC/ATAAGACACCAGAAGCCAGAACA
Final product 506 bp - HDC (sense/anti-sense):
multiplex, GGAGCCCTGTGAATACCGTG/TCCACTGAAGAGTGAGCCTGA;
nested, CGTGAATACTACCGAGCTAGAGG/ACTCGTTCAATGTCCCCAAAG
Final product 182 bp
Related to Extended Data Fig. 2.
Statistics
Statistical analysis was performed using Matlab, GraphPad Prism or Python. The selection of statistical tests was based on reported previous studies. All statistical tests were two-sided. The 95% confidence intervals (CI) for brain state probabilities were calculated using a bootstrap procedure: For an experimental group of n mice, with mouse i comprising mi trials, we repeatedly resampled the data by randomly drawing for each mouse mi trials (random sampling with replacement). For each of the 10,000 iterations, we recalculated the mean probabilities for each brain state across the n mice. The lower and upper confidence intervals were then extracted from the distribution of the resampled mean values. To test whether a given brain state is significantly modulated by laser stimulation, we calculated for each bootstrap iteration the difference between the mean probabilities during laser stimulation and the preceding period of identical duration.
Samples size
To determine the sample size for optogenetic and pharmacogenetic experiments, we first performed pilot experiments with two or three mice. Given the strength of the effect and the variance across this group, we then predicted the number of animals required to reach sufficient statistical power. To determine the sample size (number of units) for optrode recordings, we first recorded from two animals. Given the success rate of finding identified units and the homogeneity of units in the initial data set, we set a target sample size. For rabies-mediated retrograde tracing, histology and slice recording experiments, the selection of the sample size was based on numbers reported in previous studies. For gene profiling experiments, sample size was not calculated a priori, and the selection of the sample size was based on previous studies. Otherwise, no statistical methods were used to predetermine sample size.
Data availability
The GEO accession number for single cell RNA-seq dataset is GSE79108: The following link has been created to allow review of record GSE79108 while it remains in private status: http://www.ncbi.nlm.nih.gov/geo/query/acc.cgi?token=ypozuuaolvydlwr&acc=GSE79108
Extended Data
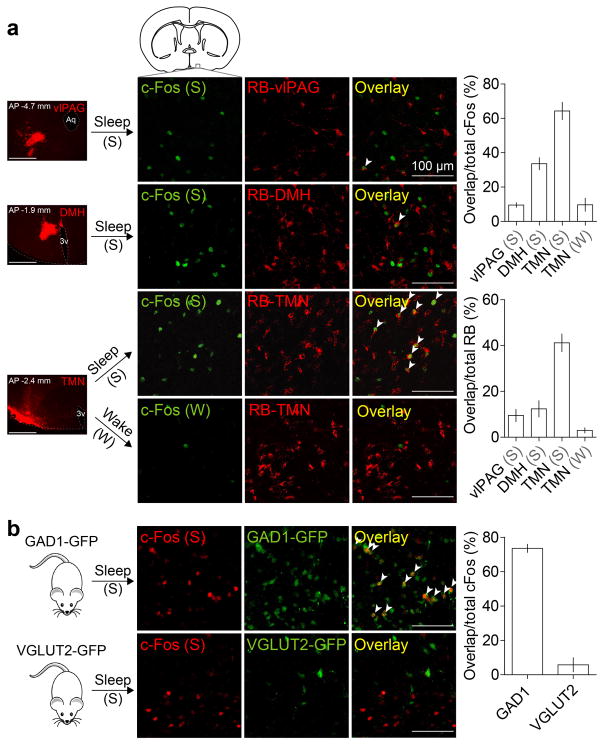
Extended Data Figure 1. Overlap of c-Fos staining of sleep-active POA neurons with retrograde labeling from several brain regions and with GAD1-GFP or VGLUT2-GFP.
a, Overlap between c-Fos expression induced by sleep rebound (Sleep, n=5 mice) or sleep deprivation (Wake, n=3) and retrobead (RB) labeling from tuberomammillary nucleus (TMN), dorsomedial hypothalamus (DMH, n=3) or ventrolateral periaqueductal grey (vlPAG, n=3). Mouse brain figure adapted with permission from ref. 31. Left column, representative images showing RB injection sites (scale bars, 500 μm). Percentage of c-Fos+ neurons containing RB and percentage of RB-containing cells that were c-Fos+ were both significantly different among target regions (P<0.0001 and _P_=0.0004, one-way ANOVA followed by Dunnett’s post-hoc test). Many RB-labeled neurons from TMN expressed c-Fos following sleep but not following wake. b, Overlap between c-Fos expression induced by sleep rebound and GAD1-GFP (top panel, 5 mice) or VGLUT2-GFP (bottom panel, 3 mice). Many c-Fos+ cells were GAD1+ (arrowheads). Error bar, ±s.e.m.
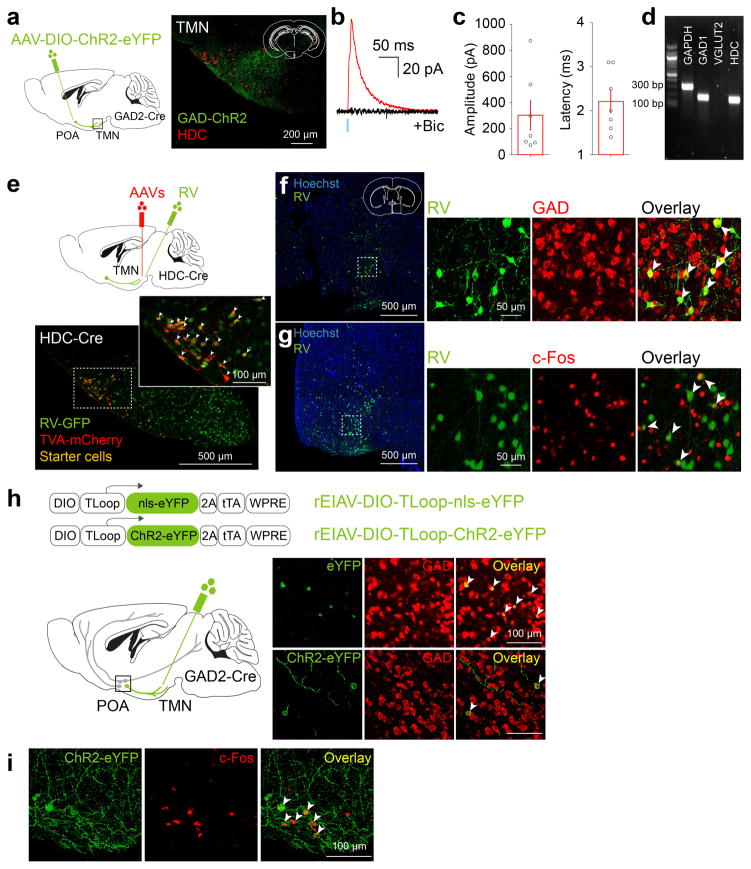
Extended Data Figure 2. Innervation of histamine neurons in the TMN by GABAergic neurons in the POA and overlap of lentivirus labeling of GABAPOA→TMN neurons with GAD expression and with c-Fos labeling after sleep rebound.
a, In GAD2-Cre mice injected with AAV-DIO-ChR2-eYFP in the POA (left), ChR2-eYFP expressing axons (green) are observed in the TMN area (red, histidine decarboxylase (HDC)). Mouse brain figure adapted with permission from ref. 31. b, Inhibitory postsynaptic current (IPSC, red) recorded in an example TMN histamine neuron, evoked by optogenetic activation of POA GABAergic axons. Light-evoked responses (red) were blocked by bicuculline (black). Blue tick, laser stimulus. c, Amplitudes and latencies of IPSCs recorded from TMN histamine neurons (n=7, from 2 mice). Each symbol represents data from one cell. Error bar, ±s.e.m. d, Single cell reverse-transcription PCR (RT-PCR) identification of HDC-expressing histamine neurons. e, Schematic of RV-mediated transsynaptic retrograde tracing from TMN histamine neurons. Fluorescence image of the TMN shows starter cells (yellow, expressing both GFP and mCherry). Inset, enlarged view of the region in white box. f, Left, fluorescence image showing input neurons in the POA. Right, enlarged view of the region in white box, showing RV-GFP labeling (green) and GAD1/2 expression (red, FISH for mRNA encoding GAD1/2). Arrowheads, RV labeled cells that are GAD1/2+. 79.0±1.4 % of RV-GFP labeled neurons contained mRNA encoding GAD1/2 (n=2 mice). g, Overlap between c-Fos expression induced by sleep rebound and RV-GFP labeling. Left, fluorescence image showing input neurons in the POA. Right, enlarged view of the region in white box, showing RV-GFP labeling and c-Fos expression. 46.9±1.9% of RV-GFP labeled neurons expressed c-Fos (n=6 mice). h, Expression of eYFP or ChR2-eYFP in the POA induced by injecting rEIAV-DIO-TLoop-nls-eYFP or rEIAV-DIO-TLoop-ChR2-eYFP into the TMN of GAD2-Cre mice and their overlap with GAD1/2 expression (FISH for mRNA encoding GAD1/2). Arrowheads indicate cells co-labeled with GAD-FISH probe and eYFP or ChR2-eYFP. 96.2±1.4% of eYFP labeled neurons and 95.4±3.7% of ChR2-eYFP labeled neurons contained mRNA encoding GAD1/2 (n=4,5). i, Expression of ChR2-eYFP in the POA induced by injecting rEIAV-DIO-TLoop-ChR2-eYFP into the TMN of a GAD2-Cre mouse and its overlap with c-Fos expression following sleep rebound (arrowheads).
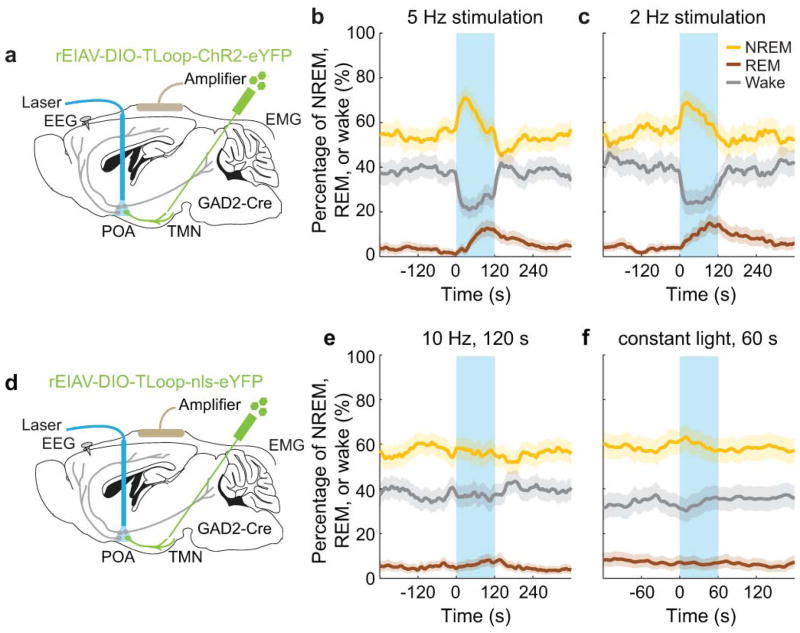
Extended Data Figure 3. Effect of optogenetic activation of GABAPOA→TMN neurons at low frequencies and effect of laser stimulation in GABAPOA→TMN-eYFP control mice.
a, Similar to Figure 1, rEIAV-DIO-TLoop-ChR2-eYFP was injected into the TMN of GAD2-Cre mice and an optic fiber was implanted into the POA for optogenetic stimulation. Mouse brain figure adapted with permission from ref. 31. b, Percentage of time the mice spent in wake, NREM, or REM state before, during, and after laser stimulation (blue shading, 5 Hz, 120 s), averaged from 5 mice (P<0.0001 for wake, REM and NREM, bootstrap). c, Similar to b, but with 2 Hz stimulation (P<0.0001 for wake and REM, _P_=0.002 for NREM, bootstrap, n=5 mice). d, Similar to a, after rEIAV-DIO-TLoop-nls-eYFP injection. e, Effect of 10 Hz stimulation in eYFP control mice. Shown is the percentage of time in wake, NREM, or REM state before, during, and after laser stimulation (blue shading, 10 Hz, 120 s), averaged from 8 mice (_P_=0.18, 0.84, and 0.35 for REM, NREM, and wake respectively, bootstrap). f, Effect of constant light stimulation (blue shading, constant light, 60 s), averaged from 5 mice (_P_=0.57, 0.27, and 0.73 for REM, NREM, and wake, bootstrap). Shading for each trace, 95% confidence interval (CI).
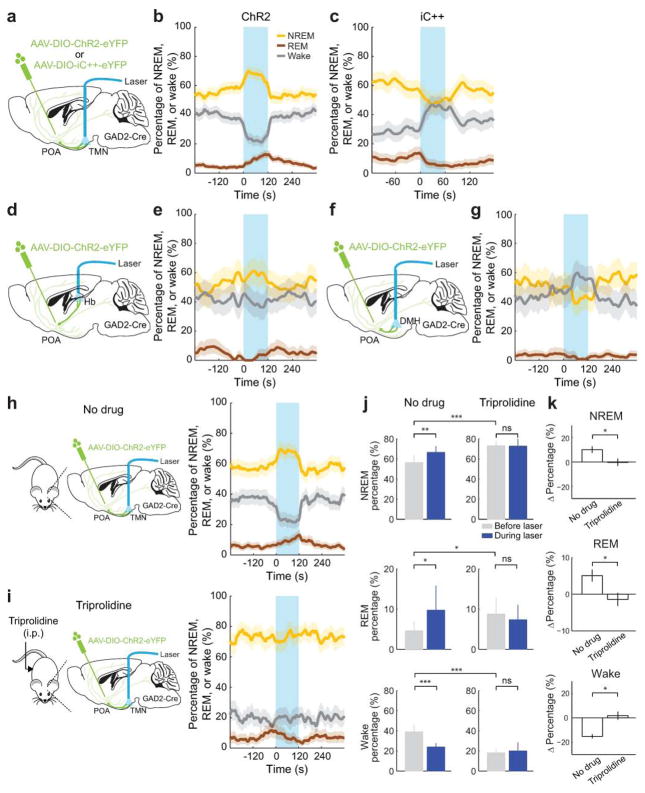
Extended Data Figure 4. Optogenetic manipulation of axon projections of POA GABAergic neurons to TMN, DMH, and Hb and effect of anti-histamine on optogenetic activation of the TMN axon projections.
a, AAV-DIO-ChR2-eYFP or AAV-DIO-iC++-eYFP was injected into the POA of GAD2-Cre mice and an optic fiber was implanted into the TMN for optogenetic activation/inhibition. Mouse brain figure adapted with permission from ref. 31. b, Percentage of time in wake, NREM, or REM state before, during, and after laser stimulation (blue shading, 10 Hz, 120 s) in mice expressing ChR2, averaged from 9 mice (P<0.0001 for wake, REM and NREM, bootstrap). Shading for each trace, 95% confidence interval (CI). **c,** Similar to **b**, but in mice expressing iC++ (blue shading: constant light, 60 s), averaged from 4 mice (_P_<0.0001 for wake and NREM, _P_=0.004 for REM, bootstrap). **d**, Schematic for optogenetic activation of POA GABAergic projection to the habenula (Hb). **e**, Similar to **b**, for activating POA→Hb projection (_P_=0.28, 0.35 and 0.72 for REM, wake and NREM, bootstrap, n=3 mice). **f**, Schematic for optogenetic activation of POA GABAergic projection to the dorsomedial hypothalamus (DMH). **g**, Similar to **b**, for POA→DMH activation (_P_=0.02, 0.12, and 0.09 for wake, REM, and NREM, n=3 mice). **h,** Left, schematic for optogenetic activation of POA GABAergic projection to the TMN without drug treatment. Right, percentage of time in wake, NREM, or REM state before, during, and after laser stimulation (blue shading, 10 Hz, 120 s) in mice with no drug (effect of laser: _P_<0.001 for wake, REM and NREM, bootstrap; n=14 mice). **i,** Similar to **h,** but after injection of triprolidine (20 mg/kg, i.p.; effect of laser: _P_=0.21, 0.84, 0.57 for wake, REM and NREM, n=5 mice). **j,** Percentage of time in NREM, REM or wake state before and during laser stimulation in no drug and triprolidine groups (120 s periods before and during laser stimulation, *_P_<0.05, **_P_<0.01, ***_P_<0.001; ns_, P_>0.05, signed rank test between before and during laser, rank sum test between no drug and triprolidine for the period before laser stimulation). k, Laser-induced change in the percentage of each state (difference between the 120s periods before and during laser stimulation, *P<0.05, rank sum test). Error bar, ±s.e.m.
Extended Data Figure 5. Effect of laser stimulation on transition probability between each pair of brain states in GABAPOA→TMN-ChR2, GABAPOA→TMN-Ctrl and GABAPOA-ChR2 mice.
a, Schematic showing transition probability calculation. To calculate the transition probability at a given time bin (i), we first identified all the trials (n) in which the animal was in state X (X could be wake, NREM, or REM) in the preceding time bin (i−1). Among these n trials, we identified the subset of trials (m) in which the animal transitioned into state Y in the current time bin (i). The X_→_Y transition probability for time bin (i) was computed as m/n. b, Transition probability within each 10 s period in GABAPOA→TMN-ChR2 mice (n=9). Shown in each bar is the transition probability averaged across 6 consecutive 10 s bins within each 60 s. Error bar, 95% confidence interval (CI) (bootstrap). The baseline transition probability (grey dashed line) was averaged across all time bins after excluding the laser stimulation period. Direct wake →REM and REM→NREM transitions were not observed and the corresponding plots were omitted. Magenta*/green# indicates significant increase/decrease in transition probability during laser stimulation compared to the baseline (P<0.05, bootstrap). Top right diagram indicates transition probabilities that are significantly increased (magenta), decreased (green) or unaffected (black) by laser stimulation. c, Transition probability in control mice (n=8). The probability during laser stimulation was not significantly different from baseline for any transition. d, Transition probability in GABAPOA-ChR2 mice (n=5).
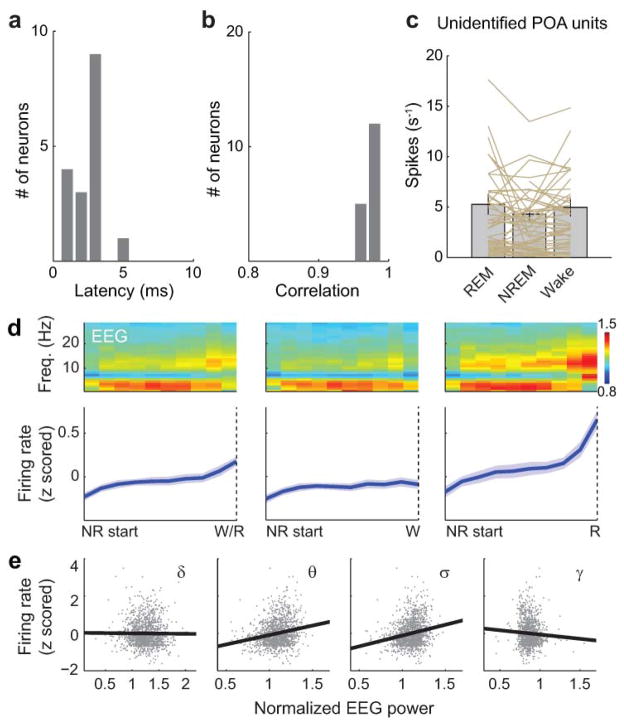
Extended Data Figure 6. Optogenetic identification of GABAPOA→TMN neurons, firing rates of unidentified POA neurons and firing rate dynamics of identified GABAPOA→TMN neurons during NREM sleep.
a, Distribution of delays in laser-evoked spiking for all identified neurons. Delay is defined as timing of the first spike after each laser pulse. b, Distribution of correlation coefficient between laser-evoked and spontaneous spike waveforms for all identified neurons. c, Firing rates of unidentified units in the three brain states. Each line represents data from one neuron. Grey bar represents average over units (n=51, from 11 mice). Error bar, ±s.e.m. d, Firing rate change of identified GABAPOA→TMN neurons during each NREM episode. Upper panel, mean EEG power spectrogram from start to end of each NREM episode. Lower panel, mean firing rate of the recorded neurons. Left, average across all NREM episodes. Each NREM period was divided into 10 time bins (temporally normalized). The firing rate of each neuron was z-scored and averaged across all recorded NREM episodes. Solid line, mean of 17 neurons, shading, ±s.e.m. To test significance of the firing rate increase during NREM episodes, for each unit we measured the slope of its mean firing rate vs. time after NREM onset, as quantified by a linear fit. Across the 17 units recorded, the increase (slope>0) was significant (_P_=1.0 × 10⁻⁵, t-test). Middle and Right, similar to left, for the subset of NREM episodes preceding wakefulness (_P_=0.0089) and that preceding REM sleep (P<10−5). The increase in firing rate was stronger for NREM episodes preceding REM sleep than those preceding wakefulness (_P_=0.0003, paired t-test). e, Correlation between firing rate and EEG power in different frequency bands (delta, 0.5–4 Hz; theta, 4–12 Hz; sigma, 9–25 Hz and gamma, 40–120 Hz) during NREM sleep. The firing rate of each neuron was z-scored, and the power within each frequency band was normalized by its mean across each recording session. Firing rates and EEG power in each frequency band were discretized in 2.5 s bins. For each bin assigned to NREM sleep, we plotted the power in each frequency bands vs. the corresponding firing rate. Linear regression was used to determine whether the power in each frequency band and the firing rate are positively or negatively correlated. The correlation was positive for theta (P<10−5) and sigma (P<10−5), negative for gamma (P<10−5), and not significant for delta (_P_=0.58).
Extended Data Figure 7. Mapping of monosynaptic inputs and axon projections of GABAPOA→TMN neurons and axon projections of POA CCK, CRH, TAC1 neurons.
a, Schematic of cTRIO to map monosynaptic inputs to GABAPOA→TMN (left) or GABAPOA→PFC (right) neurons. Mouse brain figure adapted with permission from ref. 31. Middle, coronal section of a mouse brain at the POA stained with Hoechst (blue). A region within the square is magnified in the inset. Arrowheads indicate starter cells (yellow) at the injection site (scale bar in inset, 50μm). b, Optogenetic activation of GABAPOA→PFC neurons. Shown is the percentage of time in wake, NREM, or REM state before, during, and after laser stimulation (blue shading, 10 Hz, 120 s), averaged from 6 mice (P<0.001 for wake and NREM, _P_=0.003 for REM, bootstrap). Shading for each trace, 95% CI. **c,** Average fractional inputs in cTRIOPOA→TMN (purple) or cTRIOPOA→PFC (grey) tracing (_P_=0.0002 for hypothalamus, _P_=0.02 for amygdala, _P_=0.03 for striatum, _P_=0.001 for midbrain, _P_=0.003 for pons, t-test). n=3 mice in each group. Error bar, ±s.e.m. **d,** Schematic of the axon projection mapping experiment. **e,** Coronal sections containing POA, TMN, and DMH regions stained with Hoechst (blue). A region within the square is magnified in the inset. Red, synaptophysin-mRuby; green, mGFP. **f,** Projection levels (quantified by mGFP-labeled axonal arbors) in different brain areas normalized by that in the TMN. Shown are only areas with projections > 10% of the TMN projection. Hb, habenula; LH, lateral hypothalamus; DMH, dorsomedial hypothalamus. n=3 mice. g–i, Axon projections of POA CCK, CRH, TAC1 neurons. Upper panel, coronal section containing the TMN region. Red, immunostaining for HDC showing histaminergic neurons. Lower panel, projection levels (quantified by eYFP-labeled axonal arbors) in different brain areas normalized by that in the TMN. n=3,3,4 mice respectively.
Extended Data Figure 8. Identification of genetic markers for GABAPOA→TMN neurons using TRAP and single-cell RNA-seq, and overlap between each identified marker and GAD and between the markers in the POA.
a, TRAP, shown is bioanalyzer trace of immunoprecipitated RNA. FU, fluorescence units. b, Histogram display of differentially expressed genes (IP/input). c, FPKM (fragments per kilobase of transcript per million mapped reads) IP vs. FPKM input (log scale). Several marker genes enriched in GABAPOA→TMN neurons (Cck, Crh, Slc32a1, Rpl10a) are highlighted. Red dots, genes that are significantly different in IP vs. input (P<0.05, Fisher’s exact test); blue dots, non-significant genes. d, Single-cell RNA-seq, shown is heat map of expression levels of several cell-type markers (e.g., Gad1, Gad2, Slc32a1, Slc17a6, and Chat) and all neuropeptide-encoding genes (based on the list of ref. 43 plus Gal) in cholinergic neurons in the nucleus basalis and eYFP-labeled GABAPOA→TMN neurons in the POA. Tac1 and Pdyn are highly expressed in GABAPOA→TMN neurons. RPKM, reads per kilobase of transcript per million mapped reads. e–h, Overlap between each identified marker and GAD. A representative image showing overlap between CCK-ChR2-eYFP (e), CRH-eYFP (f), TAC1-eYFP (g), DYN-ChR2-eYFP (h) and FISH for mRNA encoding GAD1/2. Arrowheads indicate cells co-labeled with GAD1/2 probe and eYFP. Mouse brain figure adapted with permission from ref. 31. i–k, Overlap between the markers. A representative image showing overlap between CCK and CRH (i), CRH and TAC1 (j) or CCK and TAC1 (k) using double FISH for both peptides. Arrowheads indicate co-labeled cells. l, Percentage of cells expressing each peptide marker that are GAD1/2 positive (n=2 or 3 mice per marker). m, Quantification of overlap between CCK and CRH, TAC1 and CRH or TAC1 and CCK (n=3 mice per pair). Error bar, ±s.e.m.
Extended Data Figure 9. Effect of laser activation of CCK, CRH, TAC1, and PDYN neurons on transition probability between each pair of brain states.
a, Transition probability within each 10 s period in CCK neuron activation experiment. Error bar, 95 % CI (bootstrap). n=4 mice. b–d, Similar to a, for CRH, TAC1, and PDYN neuron activation. n=5,7,5 mice respectively.
Extended Data Figure 10. Pharmacogenetic inactivation of CCK, CRH, and TAC1 neurons, optogenetic inactivation of CCK neurons, optogenetic activation of GAL neurons and optogenetic activation of PDYN neurons in the POA.
a, Pharmacogenetic inactivation of CCK neurons. Left, a representative image showing hM4D(Gi)-mCherry expression in the POA of a CCK-Cre mouse and an enlarged view of the region in white box. Mouse brain figure adapted with permission from ref. 31. Middle, effect of CNO injection in CCK-Cre mice expressing hM4D(Gi). Each bar shows the percentage of time in each brain state during the first 4 hrs of the recording session, after injection of vehicle (grey) or CNO (blue). Error bar, ± s.e.m. (n=6 mice, _P_=0.022, 0.025, 0.044 for REM, Wake, and NREM, paired t-test). Right, effect of CNO injection in control CCK-Cre mice not expressing hM4D(Gi) (n=4 mice, _P_=0.27, 0.46, and 0.29 for REM, Wake, and NREM, paired t-test). The effect of CNO was significantly different between hM4D(Gi)-expressing and control mice (_P_=0.006, 0.036, and 0.014 for REM, Wake, and NREM, t-test). b, Similar to a, for CRH neuron inactivation (n=6 mice, _P_=0.015, 0.018, 0.024). For control, n=5 mice; _P_=0.58, 0.41, and 0.12. Difference between hM4D(Gi) and control, _P_=0.003, 0.03 and 0.014. c, For TAC1 neuron inactivation (n=6 mice, _P_=0.0057, 0.0026, 0.0095). For control, n=4 mice; _P_=0.92, 0.13, and 0.06. Difference between hM4D(Gi) and control, _P_=0.001, 0.005 and 0.037. d, Optogenetic inhibition of POA CCK neurons suppresses sleep and enhances wakefulness. Shown is percentage of time in wake, NREM, or REM state before, during, and after laser stimulation (blue shading, constant light, 60 s), averaged from 4 mice (P<0.0001 for wake and NREM, _P_=0.008 for REM, bootstrap). e, Similar to d, with laser stimulation of POA GAL neurons (blue shading, 10 Hz, 60 s), averaged from 4 mice (P<0.0001 for increase in wakefulness, bootstrap). f, Similar to d, with optogenetic stimulation of POA PDYN neurons (blue shading, 10 Hz, 120 s), averaged from 5 mice (_P_=0.42, 0.002, and 0.0003 for REM, NREM, and wake, bootstrap). Shading for each trace, 95% CI.
Supplementary Material
supp_table1
supp_table2
supp_tablelegends
supp_videolegends
video1
video2
video3
Acknowledgments
We thank J. Cox, L. Pinto for help with sleep recordings; A. Popescu for help with optrode recordings; C. Ma for help with fluorescence in situ hybridization; D. Leib, C. Zimmerman, D. Estandian for discussions on TRAP; K. Kao, G. Daly, M. Bikov, F. Virani, G. Carrillo for technical assistance; C. Koch for supporting the collaboration with Allen Institute for Brain Science. This work was supported by a Davis Postdoctoral Fellowship (S.C.), Tourette Syndrome Association Grant (S.C.), EMBO Long-term Fellowship (F.W.), Human Frontier Science Program Fellowship (F.W.) and Howard Hughes Medical Institute (Y.D., L.L.).
Footnotes
Author Contributions S.C. and Y.D. conceived and designed the study, and wrote the paper. S.C. performed most of the experiments. F.W. wrote the programs for data analysis and sleep recording and S.C. and F.W. analyzed the data. P.Z. performed slice recordings. C.L.T. and Z.A.K. constructed the HSV virus, and performed TRAP experiment. T.N., B.T. and H.Z. performed single-cell RNA-Seq. K.T.B. and L.L. provided cTRIO and axon arborization analysis reagents and performed part of the input tracing experiments. N.H. and Z.Z. performed fluorescence in situ hybridization. W.C.C. and J.P.D. performed part of the sleep recording. M.J.K. generated PDYN-IRES-Cre mice. S.Y. and A.C. constructed the lentivirus. Y.D. supervised all aspects of the work.
The authors declare no competing financial interests.
Readers are welcome to comment on the online version of this article at www.nature.com/nature.
References
- 1.Von Economo C. Sleep as a problem of localization. J Nerv Ment Dis. 1930;71:249–259. [Google Scholar]
- 2.Nauta WJ. Hypothalamic regulation of sleep in rats; an experimental study. J Neurophysiol. 1946;9:285–316. doi: 10.1152/jn.1946.9.4.285. [DOI] [PubMed] [Google Scholar]
- 3.McGinty DJ, Sterman MB. Sleep suppression after basal forebrain lesions in the cat. Science. 1968;160:1253–1255. doi: 10.1126/science.160.3833.1253. [DOI] [PubMed] [Google Scholar]
- 4.Sallanon M, et al. Long-lasting insomnia induced by preoptic neuron lesions and its transient reversal by muscimol injection into the posterior hypothalamus in the cat. Neuroscience. 1989;32:669–683. doi: 10.1016/0306-4522(89)90289-3. [DOI] [PubMed] [Google Scholar]
- 5.Lu J, Greco MA, Shiromani P, Saper CB. Effect of lesions of the ventrolateral preoptic nucleus on NREM and REM sleep. J Neurosci. 2000;20:3830–3842. doi: 10.1523/JNEUROSCI.20-10-03830.2000. [DOI] [PMC free article] [PubMed] [Google Scholar]
- 6.Szymusiak R, Alam N, Steininger TL, McGinty D. Sleep-waking discharge patterns of ventrolateral preoptic/anterior hypothalamic neurons in rats. Brain Res. 1998;803:178–188. doi: 10.1016/s0006-8993(98)00631-3. [DOI] [PubMed] [Google Scholar]
- 7.Takahashi K, Lin JS, Sakai K. Characterization and mapping of sleep-waking specific neurons in the basal forebrain and preoptic hypothalamus in mice. Neuroscience. 2009;161:269–292. doi: 10.1016/j.neuroscience.2009.02.075. [DOI] [PubMed] [Google Scholar]
- 8.Gong H, et al. Activation of c-fos in GABAergic neurones in the preoptic area during sleep and in response to sleep deprivation. J Physiol. 2004;556:935–946. doi: 10.1113/jphysiol.2003.056622. [DOI] [PMC free article] [PubMed] [Google Scholar]
- 9.Sherin JE, Shiromani PJ, McCarley RW, Saper CB. Activation of ventrolateral preoptic neurons during sleep. Science. 1996;271:216–219. doi: 10.1126/science.271.5246.216. [DOI] [PubMed] [Google Scholar]
- 10.Zhang Z, et al. Neuronal ensembles sufficient for recovery sleep and the sedative actions of alpha2 adrenergic agonists. Nat Neurosci. 2015;18:553–561. doi: 10.1038/nn.3957. [DOI] [PMC free article] [PubMed] [Google Scholar]
- 11.Sherin JE, Elmquist JK, Torrealba F, Saper CB. Innervation of histaminergic tuberomammillary neurons by GABAergic and galaninergic neurons in the ventrolateral preoptic nucleus of the rat. J Neurosci. 1998;18:4705–4721. doi: 10.1523/JNEUROSCI.18-12-04705.1998. [DOI] [PMC free article] [PubMed] [Google Scholar]
- 12.Steininger TL, Gong H, McGinty D, Szymusiak R. Subregional organization of preoptic area/anterior hypothalamic projections to arousal-related monoaminergic cell groups. J Comp Neurol. 2001;429:638–653. [PubMed] [Google Scholar]
- 13.Cetin A, Callaway EM. Optical control of retrogradely infected neurons using drug-regulated “TLoop” lentiviral vectors. J Neurophysiol. 2014;111:2150–2159. doi: 10.1152/jn.00495.2013. [DOI] [PMC free article] [PubMed] [Google Scholar]
- 14.Berndt A, et al. Structural foundations of optogenetics: Determinants of channelrhodopsin ion selectivity. Proc Natl Acad Sci U S A. 2016;113:822–829. doi: 10.1073/pnas.1523341113. [DOI] [PMC free article] [PubMed] [Google Scholar]
- 15.Beier KT, et al. Circuit Architecture of VTA Dopamine Neurons Revealed by Systematic Input-Output Mapping. Cell. 2015;162:622–634. doi: 10.1016/j.cell.2015.07.015. [DOI] [PMC free article] [PubMed] [Google Scholar]
- 16.Heiman M, et al. A translational profiling approach for the molecular characterization of CNS cell types. Cell. 2008;135:738–748. doi: 10.1016/j.cell.2008.10.028. [DOI] [PMC free article] [PubMed] [Google Scholar]
- 17.Mansbach RS, Lorenz DN. Cholecystokinin (CCK-8) elicits prandial sleep in rats. Physiol Behav. 1983;30:179–183. doi: 10.1016/0031-9384(83)90002-1. [DOI] [PubMed] [Google Scholar]
- 18.Kimura M, et al. Conditional corticotropin-releasing hormone overexpression in the mouse forebrain enhances rapid eye movement sleep. Mol Psychiatry. 2010;15:154–165. doi: 10.1038/mp.2009.46. [DOI] [PMC free article] [PubMed] [Google Scholar]
- 19.Taniguchi H, et al. A resource of Cre driver lines for genetic targeting of GABAergic neurons in cerebral cortex. Neuron. 2011;71:995–1013. doi: 10.1016/j.neuron.2011.07.026. [DOI] [PMC free article] [PubMed] [Google Scholar]
- 20.Sternson SM, Roth BL. Chemogenetic tools to interrogate brain functions. Annu Rev Neurosci. 2014;37:387–407. doi: 10.1146/annurev-neuro-071013-014048. [DOI] [PubMed] [Google Scholar]
- 21.Gaus SE, Strecker RE, Tate BA, Parker RA, Saper CB. Ventrolateral preoptic nucleus contains sleep-active, galaninergic neurons in multiple mammalian species. Neuroscience. 2002;115:285–294. doi: 10.1016/s0306-4522(02)00308-1. [DOI] [PubMed] [Google Scholar]
- 22.Zhang G, Wang L, Liu H, Zhang J. Substance P promotes sleep in the ventrolateral preoptic area of rats. Brain Res. 2004;1028:225–232. doi: 10.1016/j.brainres.2004.09.017. [DOI] [PubMed] [Google Scholar]
- 23.Greco MA, et al. Opioidergic projections to sleep-active neurons in the ventrolateral preoptic nucleus. Brain Res. 2008;1245:96–107. doi: 10.1016/j.brainres.2008.09.043. [DOI] [PMC free article] [PubMed] [Google Scholar]
- 24.Okaty BW, Sugino K, Nelson SB. A quantitative comparison of cell-type-specific microarray gene expression profiling methods in the mouse brain. PLoS ONE. 2011;6:e16493. doi: 10.1371/journal.pone.0016493. [DOI] [PMC free article] [PubMed] [Google Scholar]
- 25.Weber F, et al. Control of REM sleep by ventral medulla GABAergic neurons. Nature. 2015;526:435–438. doi: 10.1038/nature14979. [DOI] [PMC free article] [PubMed] [Google Scholar]
- 26.Xu M, et al. Basal forebrain circuit for sleep-wake control. Nat Neurosci. 2015;18:1641–1647. doi: 10.1038/nn.4143. [DOI] [PMC free article] [PubMed] [Google Scholar]
- 27.Jego S, et al. Optogenetic identification of a rapid eye movement sleep modulatory circuit in the hypothalamus. Nat Neurosci. 2013;16:1637–1643. doi: 10.1038/nn.3522. [DOI] [PMC free article] [PubMed] [Google Scholar]
- 28.Van Dort CJ, et al. Optogenetic activation of cholinergic neurons in the PPT or LDT induces REM sleep. Proc Natl Acad Sci U S A. 2015;112:584–589. doi: 10.1073/pnas.1423136112. [DOI] [PMC free article] [PubMed] [Google Scholar]
- 29.Hayashi Y, et al. Cells of a common developmental origin regulate REM/non-REM sleep and wakefulness in mice. Science. 2015 doi: 10.1126/science.aad1023. [DOI] [PubMed] [Google Scholar]
- 30.Anaclet C, et al. The GABAergic parafacial zone is a medullary slow wave sleep-promoting center. Nat Neurosci. 2014;17:1217–1224. doi: 10.1038/nn.3789. [DOI] [PMC free article] [PubMed] [Google Scholar]
- 31.Franklin KBJ, Paxinos G. The Mouse Brain in Stereotaxic Coordinates. 3. Academic Press; 2007. [Google Scholar]
- 32.Vong L, et al. Leptin action on GABAergic neurons prevents obesity and reduces inhibitory tone to POMC neurons. Neuron. 2011;71:142–154. doi: 10.1016/j.neuron.2011.05.028. [DOI] [PMC free article] [PubMed] [Google Scholar]
- 33.Madisen L, et al. A robust and high-throughput Cre reporting and characterization system for the whole mouse brain. Nat Neurosci. 2010;13:133–140. doi: 10.1038/nn.2467. [DOI] [PMC free article] [PubMed] [Google Scholar]
- 34.Krashes MJ, et al. An excitatory paraventricular nucleus to AgRP neuron circuit that drives hunger. Nature. 2014;507:238–242. doi: 10.1038/nature12956. [DOI] [PMC free article] [PubMed] [Google Scholar]
- 35.Terao A, Greco MA, Davis RW, Heller HC, Kilduff TS. Region-specific changes in immediate early gene expression in response to sleep deprivation and recovery sleep in the mouse brain. Neuroscience. 2003;120:1115–1124. doi: 10.1016/s0306-4522(03)00395-6. [DOI] [PubMed] [Google Scholar]
- 36.Borbely AA, Tobler I, Hanagasioglu M. Effect of sleep deprivation on sleep and EEG power spectra in the rat. Behav Brain Res. 1984;14:171–182. doi: 10.1016/0166-4328(84)90186-4. [DOI] [PubMed] [Google Scholar]
- 37.Anikeeva P, et al. Optetrode: a multichannel readout for optogenetic control in freely moving mice. Nat Neurosci. 2012;15:163–170. doi: 10.1038/nn.2992. [DOI] [PMC free article] [PubMed] [Google Scholar]
- 38.Schmitzer-Torbert N, Jackson J, Henze D, Harris K, Redish AD. Quantitative measures of cluster quality for use in extracellular recordings. Neuroscience. 2005;131:1–11. doi: 10.1016/j.neuroscience.2004.09.066. [DOI] [PubMed] [Google Scholar]
- 39.Knight ZA, et al. Molecular profiling of activated neurons by phosphorylated ribosome capture. Cell. 2012;151:1126–1137. doi: 10.1016/j.cell.2012.10.039. [DOI] [PMC free article] [PubMed] [Google Scholar]
- 40.Mi H, Muruganujan A, Casagrande JT, Thomas PD. Large-scale gene function analysis with the PANTHER classification system. Nat Protoc. 2013;8:1551–1566. doi: 10.1038/nprot.2013.092. [DOI] [PMC free article] [PubMed] [Google Scholar]
- 41.Sugino K, et al. Molecular taxonomy of major neuronal classes in the adult mouse forebrain. Nat Neurosci. 2006;9:99–107. doi: 10.1038/nn1618. [DOI] [PubMed] [Google Scholar]
- 42.Hempel CM, Sugino K, Nelson SB. A manual method for the purification of fluorescently labeled neurons from the mammalian brain. Nat Protoc. 2007;2:2924–2929. doi: 10.1038/nprot.2007.416. [DOI] [PubMed] [Google Scholar]
- 43.Tasic B, et al. Adult mouse cortical cell taxonomy revealed by single cell transcriptomics. Nat Neurosci. 2016;19:335–346. doi: 10.1038/nn.4216. [DOI] [PMC free article] [PubMed] [Google Scholar]
- 44.Zhang S, et al. Selective attention. Long-range and local circuits for top-down modulation of visual cortex processing. Science. 2014;345:660–665. doi: 10.1126/science.1254126. [DOI] [PMC free article] [PubMed] [Google Scholar]
- 45.Lambolez B, Audinat E, Bochet P, Crepel F, Rossier J. AMPA receptor subunits expressed by single Purkinje cells. Neuron. 1992;9:247–258. doi: 10.1016/0896-6273(92)90164-9. [DOI] [PubMed] [Google Scholar]
Associated Data
This section collects any data citations, data availability statements, or supplementary materials included in this article.
Supplementary Materials
supp_table1
supp_table2
supp_tablelegends
supp_videolegends
video1
video2
video3
Data Availability Statement
The GEO accession number for single cell RNA-seq dataset is GSE79108: The following link has been created to allow review of record GSE79108 while it remains in private status: http://www.ncbi.nlm.nih.gov/geo/query/acc.cgi?token=ypozuuaolvydlwr&acc=GSE79108
