Dopamine Attenuates Prefrontal Cortical Suppression of Sensory Inputs to the Basolateral Amygdala of Rats (original) (raw)
Abstract
The basolateral complex of the amygdala (BLA) plays a significant role in affective behavior that is likely regulated by afferents from the medial prefrontal cortex (mPFC). Studies suggest that dopamine (DA) is a necessary component for production of appropriate affective responses. In this study, prefrontal cortical and sensory cortical [temporal area 3 (Te3)] inputs to the BLA and their modulation by DA receptor activation was examined using _in vivo_single-unit extracellular recordings. We found that Te3 inputs are more capable of driving BLA projection neuron firing, whereas mPFC inputs potently elicited firing from BLA interneurons. Moreover, mPFC stimulation before Te3 stimulation attenuated the probability of Te3-evoked spikes in BLA projection neurons, possibly via activation of inhibitory interneurons. DA receptor activation by apomorphine attenuated mPFC inputs, while augmenting Te3 inputs. Additionally, DA receptor activation suppressed mPFC-induced inhibition of Te3-evoked spikes. Thus, the mPFC may attenuate sensory-driven amygdala-mediated affective responses via recruitment of BLA inhibitory interneurons that suppress sensory cortical inputs. In situations of enhanced DA levels in the BLA, such as during stress and after amphetamine administration, mPFC regulation of BLA will be dampened, leading to a disinhibition of sensory-driven affective responses.
Keywords: dopamine, amygdala, prefrontal cortex, temporal area 3, Te3, electrophysiology
Disorders of the nervous system that include an affective component are believed to involve dysfunction within the amygdala. Thus, evidence of morphological or functional abnormalities of the amygdala have been found in schizophrenia, depression, anxiety, and temporal lobe epilepsy (Breier et al., 1992;Goddard and Charney, 1997; Soares and Mann, 1997; Lawrie and Abukmeil, 1998; Rosen and Schulkin, 1998; Drevets, 1999; Ninan, 1999; Tebartz van Elst et al., 1999, 2000; Wright et al., 1999; Loup et al., 2000). In addition, several of these disorders are proposed to exhibit disruptions in the prefrontal cortical areas that are connected to the amygdala. The dopamine (DA) system also appears to play a role in regulating this system, because dopaminergic manipulations can induce changes in affect and are often a target for therapeutic intervention in the treatment of these disorders.
The basolateral complex of the amygdala (BLA) [comprised of the lateral nucleus (LAT), basolateral nucleus (BL), and basomedial nucleus] receives excitatory cortical inputs that drive or regulate BLA output neuron activity. Several association sensory cortical regions, such as perirhinal cortex and temporal cortical area 3 (Te3), may drive BLA output in the presence of specific salient sensory stimuli (Arnault and Roger, 1990; LeDoux et al., 1990; Mascagni et al., 1993; Shi and Cassell, 1997; Poremba et al., 1998). Thus, lesions of association sensory cortical areas will reduce the specificity of the affective response or even block expression of an affective response to a conditioned stimulus (Teich et al., 1989; Rosen et al., 1992; Campeau and Davis, 1995; Armony et al., 1997). Furthermore, learning-induced plasticity occurs in parallel with affective conditioning in both primary and secondary sensory cortices (Diamond and Weinberger, 1984, 1986; Edeline et al., 1993; Quirk et al., 1997; Armony et al., 1998). The medial prefrontal cortex (mPFC) also projects to the BLA (Sesack et al., 1989; McDonald et al., 1996) and may regulate the expression of some amygdala-mediated behaviors by selection of a set of BLA outputs or general inhibition of output. Thus, stimulation of the mPFC will inhibit the production of affective behavior produced by BLA (Al Maskati and Zbrozyna, 1989; Zbrozyna and Westwood, 1991), and PFC lesions appear to disinhibit some affective behaviors or result in perseverative affective responses to stimuli (Jaskiw and Weinberger, 1992; Morgan and LeDoux, 1995; Dias et al., 1996; Jinks and McGregor, 1997) (see also Powell et al., 1994; Gewirtz et al., 1997). The balance of sensory and mPFC inputs may determine whether an amygdala-mediated affective response will be produced in the presence of an affective sensory stimulus.
In the presence of affective sensory stimuli, activity is enhanced in some sensory-related cortical areas that project to the BLA (Diamond and Weinberger, 1986), and dopamine (DA) levels in the BLA are increased (Coco et al., 1992; Hori et al., 1993; Harmer and Phillips, 1999b; Inglis and Moghaddam, 1999). DA receptor activation in the BLA is necessary for, and may even potentiate, some amygdala-mediated behaviors performed in response to sensory stimuli (Borowski and Kokkinidis, 1996; Lamont and Kokkinidis, 1998; Guarraci et al., 1999;Nader and LeDoux, 1999). Our previous studies demonstrated that DA receptor activation alters the balance of cortical inputs to the BLA, attenuating mPFC inputs and potentiating Te3 inputs to this region (Rosenkranz and Grace, 1999). We now show that DA receptor stimulation can remove mPFC inhibition of the BLA and potentially allow a sensory cortical-driven affective response to be produced. This was done by examining the electrophysiology of the interactions of the mPFC and Te3 inputs to the BLA and the effects of DA receptor activation on this interaction.
A portion of these data has been presented in abstract form (Rosenkranz and Grace, 2000)
MATERIALS AND METHODS
Materials
Apomorphine HCl and chloral hydrate were purchased from Sigma (St. Louis, MO). Haloperidol was a generous gift from McNeil Laboratories.
Preparation
All procedures were performed in accordance with the National Institutes of Health Guide for the Care and Use of Laboratory Animals and were approved by the University of Pittsburgh Institutional Animal Care and Use Committee. Male Sprague Dawley rats (weight 250–400 gm) were housed in pairs in a temperature-controlled environment with 12 hr light/dark schedule. Food and water were available ad libitum. Rats were anesthetized with an intraperitoneal injection of 400 mg/kg of 8% chloral hydrate and placed in a stereotaxic device (Kopf Instruments, Tujunga, CA). Additional supplements of chloral hydrate were administered via a lateral tail vein catheter, or intraperitoneally, as necessary. The rat's temperature was monitored using a rectal temperature probe (Precision Thermometer 4600, YSI, Yellow Springs, OH), and maintained at ∼37°C using a heat control unit and heating pad (Fintronics, Orange, CT). Incisions were made in the scalp to expose the skull, and burr holes were drilled and the dura removed overlying the BLA, mPFC, Te3 and, in some cases, the stria terminalis. Coordinates for these areas were determined using a stereotaxic atlas (Paxinos and Watson, 1997) as follows: BLA, −5.3 lateral (L), −3.0 caudal (C) from bregma; mPFC, +3.0 rostral (R), 0.7 L; Te3, −5.0 C, 6.5 L; stria terminalis, −0.9 R, 1.7L, 5.4 ventral.
Single-unit recordings
Single-barrel electrodes were constructed using a vertical microelectrode puller (PE-2; Narishige, Tokyo, Japan), and filled with 2% Pontamine sky blue in 2 m NaCl (impedance measured_in situ_ ranged between 10 and 20 MΩ measured at 1 kHz). Recording electrodes were lowered slowly into the amygdala via a hydraulic micromanipulator (MO-8; Narishige). In some experiments a twisted bipolar electrode was lowered into the stria terminalis or the forceps minor of the corpus callosum lateral to the mPFC. Bipolar concentric stimulating electrodes (Plastics One, Roanoke, VA) were lowered into the remaining structures, with the depth adjusted to obtain maximal amplitude of evoked field potentials recorded in the BLA; this ranged from 4.0 to 5.3 mm ventral for the mPFC placement and 5.1–5.8 mm ventral for the Te3 placement. Experiments began no earlier than 30 min after stimulating electrode placement. Stimulation was delivered using a Grass (Quincy, MA) S88 stimulator, with the intensity ranging between 75 and 900 μA with a duration of 0.3–0.4 msec. Stimulation pulses were photoelectrically isolated (PSIU6G; Grass). At the completion of each experiment Pontamine sky blue was ejected from recording electrodes with constant −25 μA current.
Drug administration
Apomorphine was dissolved in 0.9% saline, and haloperidol was dissolved in dilute lactic acid, to a final concentration of 0.5 or 1.0 mg/ml. Drugs were administered via a lateral tail vein in volumes of 0.05–0.4 ml at an approximate rate of 0.1 ml/10 sec. A minimum of 4 min elapsed before the effects of the drugs were examined.
Data collection
Signals from the recording electrode were amplified by a headstage connected to the preamplifier before being fed into a window discriminator/amplifier (Fintronics), and an audio monitor (AM5; Grass). Signals were filtered with a low cutoff of 200 Hz and a high cutoff of 4 kHz and displayed on an oscilloscope (V-134 Hitachi, Tokyo, Japan). The data were also stored on video tapes after being digitized (DR-390; NeuroData Neurocorder, New York, NY). Data were simultaneously collected and monitored online using software developed in this laboratory (Neuroscope) and stored on a personal computer (Gateway 2000 P5–100XL) for subsequent off-line analysis.
Data analysis
The particulars of the data analysis, which depended on the type of neuronal activity monitored, were as follows:
Spontaneous spike discharge. Single units were isolated with a signal-to-noise ratio of ≥3:1, and a minimal duration of 1.0 msec was set to exclude spikes that were not of somatodendritic origin (Humphrey, 1979). Stable baseline firing rates were obtained for a minimum of 2 min before drug administration. A minimum of 1–2 min was allowed after electrical stimulation before basal firing rate was recorded. After stable baseline data were collected, systemic drug administration was performed, and neuronal activity was recorded for a minimum of 4 min before a subsequent administration occurred.
Additionally, the duration of averaged action potentials (5–10 spikes) recorded from BLA units was quantified as the time from the initial change from baseline to the return to baseline. Because the duration may vary with electrode distance from soma, only neurons displaying at least biphasic action potentials, presumably close to the electrode, were included. The distribution of firing rates was also examined and fit to population curves (Jandel Table Curve). Furthermore, the distribution of firing rates was examined as a function of action potential duration. Similar to our previous study (Rosenkranz and Grace, 1999), firing rate population distributions and firing rate distributions as a function of action potential duration were examined, and a cutoff of 0.5 Hz was used to segregate fast- and slow-firing neurons.
Electrically evoked responses. Electrical stimulus pulses were often delivered during electrode penetration to search for units that exhibited evoked responses (0.6 Hz, 0.2–0.7 mA, 0.3 msec duration). Evoked responses consisted of single units. The latency of response to an input was determined as the time from the beginning of the stimulus artifact to the beginning of the evoked spike. Single units were operationally defined as monosynaptic if they showed very little shift in latency when increasing the stimulus intensity, yet they showed some range (1–3 msec) in latency distribution (“jitter”) and did not follow high-frequency stimulation (>250 Hz), ruling out antidromic activation. Stimulus intensities were varied to determine an evoked spike response probability of ∼2–12%, defined as spike threshold (T in graphs). Lower stimulus intensities did not evoke spikes (0 spikes in 50 stimuli). Stimulus intensity was increased in 0.1 mA steps from the threshold intensity to generate an input–output curve. However, to ensure minimal current spread, stimulus intensity was not increased >1.0 mA. Regression analysis was performed on input–output curves to determine the stimulus intensity that resulted in 50% response probability.
In an attempt to ensure that responses evoked from electrodes in the temporal cortex were attributable to stimulation of Te3 and not the adjacent perirhinal cortex, a concentric bipolar stimulating electrode was used to control current spread, and stimulation intensities did not exceed 1.0 mA. For this reason, we followed the prerequisite that the tip of the stimulating electrode had to be histologically verified to lie within Te3. Nevertheless, some current spread is inevitable. However, Te3 projects almost exclusively to the lateral nucleus of the amygdala, whereas parts of perirhinal cortex also project to the basolateral nucleus (Shi and Cassell, 1999). Thus, if current consistently spread into the perirhinal cortex, evoked responses in the basolateral nucleus would be expected to be common. However, the vast majority of responses evoked from temporal cortical stimulation were recorded within the lateral nucleus.
Paired stimulus pulses were delivered with 10–200 msec interstimulus interval (ISI) in a 2 sec cycle at a stimulus intensity that resulted in ∼50% spike probability to the first stimulus. Dual mPFC–Te3 stimulation was delivered at delays of 0–200 msec and cycled at 0.6 Hz. For the dual mPFC–Te3 stimulations, the intensity of the Te3 stimulation chosen resulted in a Te3-evoked spike with ∼50% probability in the absence of any mPFC stimulation, whereas the intensity of the mPFC stimulation was altered between 0.2 and 0.8 mA until an intensity was found that appeared to cause significant suppression of Te3 inputs. If drug was to be administered, mPFC stimulus intensities were chosen that caused less than maximal suppression of Te3 inputs (i.e., 80–90% inhibition).
After stable baselines were recorded, drugs were administered systemically as above, and drug-induced changes in the evoked spike probability was measured. A minimum of 30 sweeps was obtained before and after drug administration at several time points and at each stimulus intensity examined before drug administration (for a total of at least 120 stimulations). The effects of drug and electrical stimulation were examined using ANOVAs, and when significant main effects were observed, two-tailed t tests were performed between individual groups.
Histology
Verification of recording and stimulating electrode sites was obtained histologically. Rats were deeply anesthetized, decapitated, and the brains were removed and fixed in 10% formalin for a minimum of 24 hr. Brains were cryoprotected with 15–20% sucrose in 0.1m phosphate buffer, then frozen and sectioned with a cryostat or with a sliding microtome into 40–60 μm coronal sections. Mounted sections were then stained with cresyl violet. Recording sites were identified by the Pontamine sky blue spot (see Electrophysiological recordings). The stimulation site was determined from the ventralmost point of the stimulating electrode track identified under microscopic examination.
RESULTS
Characteristics of BLA neurons
All the recording sites used in this study were verified to be within the lateral or basolateral nucleus of the amygdala (Alheid et al., 1995) and confirmed by the location of the Pontamine sky blue iontophoresis (Fig. 1). A total of 210 neurons were included for analysis in this study. Firing rates and action potential durations of BLA neurons recorded extracellularly were consistent with those previously characterized in anesthetized rats (Rosenkranz and Grace, 1999). Similar to previous studies that examined spontaneous firing, plotting neuronal firing rates by stimulation-evoked action potential duration revealed two populations of neurons (Fig. 2). Thus, evoked spikes recorded from BLA neurons were characterized as originating from projection neurons if they displayed long duration (>2 msec) and slow spontaneous action potential firing rate (<0.5 Hz) or presumptive interneurons if they displayed short-duration (<2 msec) and higher baseline firing rates (>0.5 Hz) (Fig. 2). Stimulation of Te3, mPFC, or stria terminalis caused antidromic activation only of neurons that displayed long duration, infrequent action potentials, whereas the fast-spiking short duration action potential neurons never exhibited antidromic activation. This concurs with intracellular studies from BLA and other brain areas, demonstrating that morphologically identified projection neurons tend to display long-duration action potentials, whereas inhibitory interneurons display short-duration action potentials (Washburn and Moises, 1992; Rainnie et al., 1993; Freund and Buzsaki, 1996; Pare and Gaudreau, 1996; Lang and Pare, 1998).
Fig. 1.
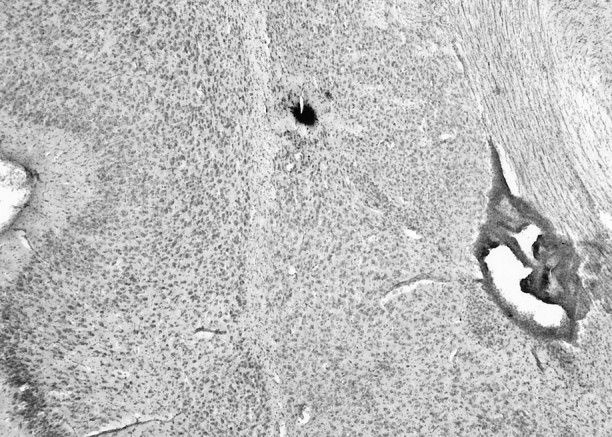
Example of Pontamine sky blue-labeled recording site. The recording site could be effectively determined by examination of the Pontamine sky blue iontophoresed from the tip of the electrode at the conclusion of the recording. The nuclei were determined after cresyl violet staining of the tissue sections.
Fig. 2.

Characteristics of BLA neuronal activity. A, Evoked spikes were characterized as originating from projection neurons or interneurons using the criteria of firing rate and spike duration. Aligned with the_y_-axis is a distribution histogram of firing rates, and aligned with the _x_-axis is a distribution histogram of spike durations (from a randomly selected sample of neurons,n = 59). The circles represent each individual neuron plotting its spike duration as a function of its firing rate. The presumed interneurons (black circles) consistently show faster firing rate and shorter spike duration than do the presumed projection neurons (gray circles).B, Antidromic responses of BLA neurons that project to the mPFC (AD; n = 34) display longer latencies than mPFC-evoked responses in BLA interneurons (IN; n = 40). Therefore, the significantly shorter latency of mPFC-evoked responses on BLA interneurons compared with projection neurons (PN;n = 42) cannot be attributable to antidromic activation of a BLA neuron that projects to the mPFC. Antidromic activation of BLA projection neurons is confirmed by the ability of the spikes to follow high-frequency stimulation (300 Hz, 0.6 mA, 0.4 msec duration, three stimuli at arrows) (C) and constant response latency (1), and collision (3) with a spontaneous spike (2) (D).
Characteristics of mPFC and Te3 inputs
All stimulation sites included in this study were histologically verified to lie within the infralimbic or prelimbic cortex, Te3, or stria terminalis. The Te3 was discriminated from dorsally adjacent Te1 and ventrally adjacent perirhinal cortex by the reduced density of layer IV and distance from the rhinal sulcus (Zilles and Wree, 1995). Consistent with anatomical studies (Arnault and Roger, 1990; Mascagni et al., 1993; McDonald et al., 1996; Shi and Cassell, 1997; Farb and LeDoux, 1999), the majority of Te3-evoked responses were observed in the lateral nucleus, the majority of infralimbic cortical-evoked responses were observed in the lateral nucleus, and the majority of prelimbic cortical-evoked responses were observed in the basolateral nucleus (Fig. 3). Few responses were recorded in the basomedial nucleus, probably because of sampling biases, and therefore were not included in this study. Only short-latency responses that met criteria for putative monosynaptic responses (see Materials and Methods) were included in the data analysis. Stimulation of Te3 evoked short-latency, presumably monosynaptic spikes with an average latency of 10.7 ± 0.39 msec (mean ± SEM; n = 53; range, 6.9–14.0 msec) in projection neurons. In several cases, single-pulse stimulation of Te3 evoked bursts of action potentials in projection neurons. In putative interneurons, Te3 stimulation evoked monosynaptic spikes with a mean latency of 9.9 ± 0.50 msec (n = 24; range, 5.9–16.5). The majority of neurons that responded to Te3 stimulation with a short-latency excitation were located in the lateral nucleus of the amygdala. Stimulation of mPFC evoked short-latency, presumably monosynaptic responses in projection neurons with a mean latency of 22.2 ± 0.689 msec (n = 42; range, 9.5–36.0) (Fig. 2). The infralimbic and prelimbic (Cg3) cortices were defined relative to the tenia tecta and fiber bundle, the forceps minor of the corpus callosum, as well as the decreased density of superficial layers of the infralimbic cortex compared with the prelimbic cortex. There were no significant differences in latency between responses evoked by stimulation of infralimbic cortex (projection neurons: 21.3 ± 1.08 msec, n = 16; interneurons: 16.3 ± 1.49 msec, n = 19) when compared with prelimbic cortex (projection neurons: 23.0 ± 1.00 msec, n = 26; interneurons: 15.1 ± 1.30 msec, n = 21). Thus, infralimbic and prelimbic cortical-evoked responses were grouped together for this analysis. In BLA projection neurons that did not display a monosynaptic mPFC-evoked excitatory response or at mPFC stimulation intensities that were too low to evoke spikes in BLA projection neurons, mPFC stimulation often caused a suppression of spontaneous firing (Fig. 4). Stimulation of mPFC also often caused short-latency, presumably monosynaptic, bursts of action potentials in BLA interneurons (Fig. 4) with a mean latency of 15.7 ± 6.18 msec (n = 40; range, 7.4–26 msec) (Fig. 2). The latency of the mPFC-evoked responses in BLA interneurons was significantly shorter than the latency of mPFC-evoked short-latency responses in projection neurons (t test,p < 0.01). Because few mPFC inputs to parvalbumin-positive interneurons of the BLA have been observed (Smith et al., 2000) and because the BLA sends significant projections to the mPFC, one potential confound could be that the significantly shorter latency of mPFC-evoked responses in interneurons is attributable to antidromic activation of a BLA-to-mPFC collateral to a BLA interneuron and not the result of stimulation of an mPFC neuron that projects to the BLA. Two strategies were used to avoid this confound: (1) The stimulus durations used (0.3 msec) were less than those that would maximally activate fibers because antidromic activation of fibers often required durations >0.4 msec in our preparation. However, terminals (as well as cell bodies) in the mPFC would still be excited. (2) The latency of antidromic responses of BLA neurons after mPFC stimulation was examined. These neurons followed high-frequency stimulation, had constant response latency, and often displayed collision of a spontaneously occurring spike with a mPFC-evoked spike (Fig. 2). BLA neurons antidromically activated from mPFC had a mean latency of 17.6 ± 0.805 msec (n = 34; range, 10.0–25.7 msec) (Fig. 2). Because the majority of mPFC-evoked responses of BLA interneurons were <15 msec and the majority of antidromic responses after mPFC stimulation >15 msec, it is unlikely that antidromic activation of a collateral is responsible for significantly shorter latencies of the interneuronal response.
Fig. 3.
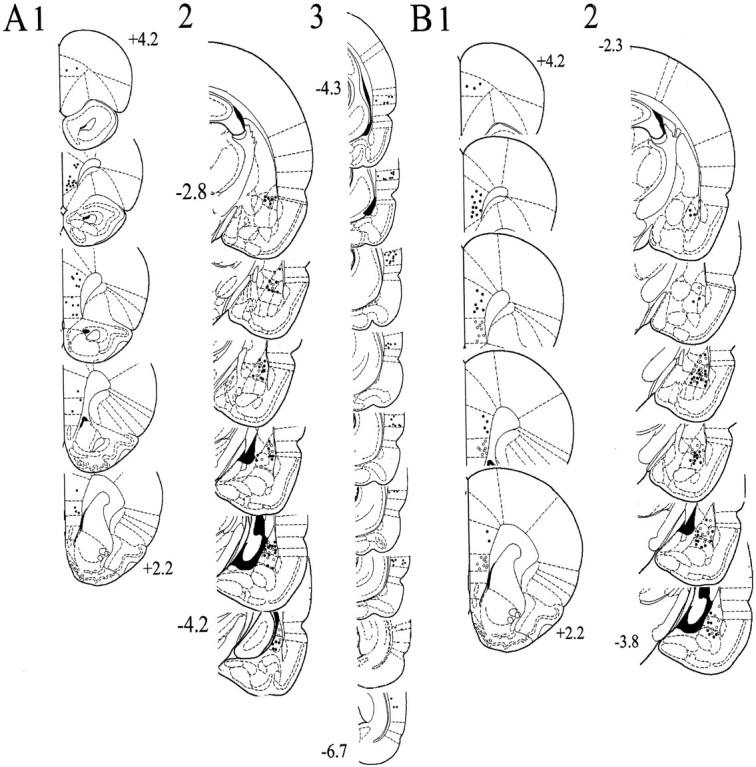
Placement of stimulating and recording electrodes.A, Stimulating electrode placements in the Te3 (3; −4.3 to −6.7 mm bregma) that evoked short-latency responses in the BLA (2; black and_white circles_, −2.8 to −4.2 mm bregma), and mPFC stimulation sites (1; +4.2–2.2 mm bregma) that suppressed Te3-evoked responses (2; white circles). B, Stimulating electrode placements in the infralimbic (gray circles) and prelimbic (black circles) cortex subdivisions of the mPFC (1; +4.2–2.2 mm bregma) that evoked short-latency responses in the BLA (2; white circles indicate infralimbic cortex-evoked responses, and black circles indicate prelimbic cortex-evoked responses, −2.3 to −3.8 mm bregma). This figure included only those neurons used for analysis in this study.
Fig. 4.

Prefrontal cortical stimulation evokes bursts of spikes in BLA interneurons and suppresses the activity of many projection neurons. A, mPFC stimulation (0.4 mA, 0.3 msec duration) evokes a short-latency burst of spikes in a BLA interneuron. B, Peristimulus time histogram (PSTH) of mPFC-evoked short-latency responses in a single BLA interneuron (10 sweeps, 0.6 Hz, 0.4 mA, 0.3 msec duration). C, PSTH of mPFC-induced suppression (*) of spontaneous spike discharge of a BLA projection neuron (60 sweeps, 0.5 mA, 0.6 Hz, 0.3 msec duration). Stimulation occurs at time = 0 in each PSTH.
Stimulus intensity–response probability curves (I–O_curves) were constructed in an attempt to compare inputs. Threshold was defined as the stimulation intensity value that caused 2–12% spike probability in BLA neurons. Lower stimulation intensities were tested and did not evoke spikes. From threshold, stimulation intensity was increased in 0.1 mA steps (threshold is represented as “T”, and each 0.1 mA step is represented as ascending values, i.e., 2, 3, 4, etc). There were no significant differences in stimulus intensity–response probability curves between infralimbic cortical- and prelimbic cortical-evoked responses in the BLA (Table1). Thus, infralimbic and prelimbic cortical-evoked responses were grouped together. There were significant main effects of stimulus intensity on each input (Te3 to interneuron df = 77, F = 21.2, p < 0.001; mPFC to interneuron df = 57, _F_ = 8.35,_p_ < 0.001; Te3 to projection neuron df = 163,_F_ = 54.1, _p_ < 0.001; mPFC to projection neuron df = 96, _F_ = 13.5,_p_ < 0.001). There was also a significant main effect of input. Thus, Te3 stimulation was much more capable of driving BLA projection neuron firing than mPFC stimulation (_F_ = 14.64, df = 35, _p_ < 0.001). Even at 0.4 mA above threshold, mPFC stimulation often did not reliably evoke spikes in BLA projection neurons (only 2 of 21 reached >90% response probability) (Fig. 4), whereas at the same intensities above threshold, Te3 stimulation often evoked bursts of spikes in projection neurons, and 21 of 36 reached >95% response probability within 0.4 mA above threshold (Fig. 5). There were no differences in the mean probability at threshold stimulation intensity between any inputs (one-way ANOVA; p = 0.99; F = 0.0368; df = 91; range, 6.3–6.8% response probability). Significant differences between mPFC and Te3 inputs to BLA projection neurons were seen at every other stimulus intensity tested (Fig. 5) (0.1 mA above threshold, t = 3.74; 0.2 mA above threshold, t = 5.35; 0.3 mA above threshold_t = 4.64; 0.4 mA above threshold, t = 3.70; p < 0.001 and df = 55 for each comparison). An opposite pattern was seen in interneurons, in which mPFC stimulation was more adept at driving interneurons than was Te3 stimulation (Fig.4) (_F_ = 4.83; df = 31; _p_ < 0.05), although presumably because of response variability, this was only significant at 0.1 and 0.3 mA above threshold (_t_ = 2.29, df = 28, _p_ < 0.05 and _t_ = 2.06, df = 27, _p_ < 0.05, respectively). mPFC inputs were likewise more adept at driving interneurons than projection neurons (_F_ = 6.87; df = 27; _p_ = 0.014), an effect that was significant at all stimulus intensities except for threshold (0.1 mA above threshold, _t_ = 3.51, df = 32; 0.2 mA above threshold, _t_ = 3.87, df = 32; 0.3 mA above threshold, _t_ = 3.78, df = 31; 0.4 mA above threshold, _t_ = 3.81, df = 19; for each comparison, _p_ ≤ 0.001). However, there was no significant main effect between Te3 inputs to interneurons or projection neurons (_F_ = 1.98; df = 39;_p_ > 0.1). It is possible that mPFC inputs target distal dendrites of BLA projection neurons, or more proximal regions, and their strength is limited by feedforward inhibition, as indicated by the lower potency of mPFC inputs to projection neurons compared with Te3 inputs, and the shorter latency and more potent response to mPFC stimulation in interneurons. This view is supported by observation that mPFC-evoked responses had a significantly shorter latency in interneurons compared with BLA projection neurons, whereas the latency of Te3-evoked responses in interneurons and projection neurons overlapped (Fig. 6). This difference in the latency of interneuronal activation relative to projection neuron activation supports the possibility that the diminished mPFC-evoked responses in projection neurons is dampened by previous activation of interneurons. This contrasts to Te3 stimulation, which simultaneously activates interneurons and projection neurons. The differences in latency and potency observed between mPFC- and Te3-evoked responses are probably not caused by sampling biases. Thus, comparison of responses evoked from stimulation of the division of the mPFC that projects to the lateral nucleus (infralimbic cortical inputs) with Te3 inputs, which also primarily target the lateral nucleus, still yielded significant differences. Furthermore, infralimbic cortex-evoked responses did not differ from prelimbic cortex-evoked responses (see above). There were also no significant differences between the lateral and basolateral nuclei when comparing the latency of mPFC inputs, the firing rate, the action potential duration, or the ES50 (stimulation intensity that produced a 50% response probability) (Table 2). This indicates that the differences observed between Te3 and mPFC inputs are not caused by differences in the subnuclei to which they preferentially project. The differences between interneurons and projection neurons were still observed.
Table 1.
Comparison of prelimbic cortex- and infralimbic cortex-evoked responses in the BLA
| Stimulation intensity | Inputs to projection neurons | Inputs to interneurons | ||
|---|---|---|---|---|
| Infralimbic cortex_n_ = 10 (%) | Prelimbic cortex n = 11 (%) | Infralimbic cortex n = 14 (%) | Prelimbic cortex_n_ = 13 (%) | |
| Threshold (T) | 6.8 ± 1.2 | 6.4 ± 1.1 | 9.5 ± 1.7 | 5.8 ± 0.9 |
| 0.1 mA above T | 22.8 ± 7.6 | 26.1 ± 6.5 | 60.0 ± 12.5 | 64.5 ± 15.3 |
| 0.2 mA above T | 52.1 ± 10.5 | 36.1 ± 7.8 | 115.9 ± 15.7 | 138.7 ± 24.9 |
| 0.3 mA above T | 60.7 ± 11.5 | 46.9 ± 7.9 | 183.3 ± 28.3 | 214.5 ± 44.4 |
| 0.4 mA above T | 62.3 ± 10.2 | 44.6 ± 8.2 | 214.0 ± 68.6 | 241.9 ± 51.2 |
Fig. 5.

mPFC and Te3 monosynaptic inputs exert different effects on BLA interneurons and projection neurons.A, mPFC stimulation at increasing stimulus intensities is more effective at driving BLA interneurons than is stimulation of Te3 inputs. B, Te3 stimulation at increasing intensities is more effective at driving projection neuron firing than is stimulation of mPFC inputs. To compare stimulation–response curves, threshold stimulation intensity (T) is the lowest stimulation that evokes a spike at least once in >40 consecutive attempts (ranges, 2–12% spike probability). Stimulation intensities 0.05 mA lower than T do not evoke any spikes in at least 50 stimulations. From threshold stimulation intensity, the intensity is increased in steps of 0.1 mA. Each 0.1 mA step is labeled consecutively, beginning at 2. The Te3 and mPFC inputs significantly differ from each other at every stimulus intensity plotted, other than threshold stimulation intensities (t test;p < 0.05).
Fig. 6.

Differences in latency of afferent-evoked responses between interneurons and projection neurons. A portion of Figure 2 is reproduced here for comparison. Distribution histograms of the latencies of mPFC-evoked responses (A) in BLA projection neurons (top panel) and interneurons (bottom panel) indicate that interneuronal responses often precede responses in projection neurons, indicative of the suppressive effect that the mPFC may exert over the BLA via feedforward inhibition. This can lead to preclusion of BLA projection neuron firing and, therefore, BLA output. However, the overlapping latencies of Te3-evoked responses (B) in BLA projection neurons (top panel) and interneurons (bottom panel) indicates that Te3-evoked inhibition may serve to inhibit competing paths or increase the acuity of Te3-evoked excitation. Average latencies are represented by_vertical dashed lines_.
Table 2.
Comparison of mPFC- and Te3-evoked responses by BLA nucleus
| MPFC stimulation | Te3 stimulation | |||||||
|---|---|---|---|---|---|---|---|---|
| Projection neurons | Interneurons | Projection neurons | Interneurons | |||||
| LAT | BL | LAT | BL | LAT | BL | LAT | BL | |
| Latency | 21.0 ± 1.0 | 23.3 ± 1.0 | 16.0 ± 1.3 | 14.7 ± 1.4 | 10.7 ± 0.4 | — | 9.9 ± 0.5 | — |
| n = 17 | n = 25 | n = 20 | n = 21 | n = 53 | n = 24 | |||
| Firing rate (Hz) | 0.087 ± 0.04 | 0.02 ± 0.01 | 3.0 ± 0.7 | 2.7 ± 1.1 | 0.05 ± 0.02 | — | 3.6 ± 0.9 | — |
| n = 14 | n = 19 | n = 14 | n = 10 | n = 45 | n = 20 | |||
| AP duration (msec) | 2.9 ± 0.13 | 2.9 ± 0.16 | 1.5 ± 0.05 | 1.8 ± 0.08 | 2.8 ± 0.08 | — | 1.5 ± 0.07 | — |
| n = 14 | n = 19 | n = 20 | n = 17 | n = 49 | n = 22 | |||
| Threshold (t) | 4.8 ± 0.9% | 6.0 ± 1.2% | 5.2 ± 1.7% | 5.6 ± 1.3% | 6.7 ± 0.7% | — | 6.4 ± 1.0% | — |
| n = 10 | n = 11 | n = 14 | n = 13 | n = 36 | n = 18 | |||
| 0.1 mA > t | 18.3 ± 6.4% | 21.4 ± 5.9% | 58.9 ± 12.3% | 67.2 ± 14.3% | 61.9 ± 5.9% | — | 43.4 ± 6.2% | — |
| 0.2 mA > t | 36.3 ± 6.2% | 37.4 ± 7.5% | 84.8 ± 15.6% | 138.6 ± 26.2% | 89.9 ± 5.6% | — | 83.1 ± 10.3% | — |
| 0.3 mA > t | 48.2 ± 8.0% | 54.4 ± 9.3% | 132.6 ± 35.4% | 210.5 ± 50.3% | 95.2 ± 5.7% | — | 110.1 ± 12.9% | — |
| 0.4 mA > t | 52.4 ± 7.9% | 53.1 ± 9.0% | 206.9 ± 75.3% | 248.9 ± 57.2% | 101.6 ± 7.5% | — | 146.9 ± 27.8% | — |
| ES50control | 0.33 | 0.10 | 0.28 | 0.07 | 0.17 | — | 0.22 | — |
| ES50post | >0.4 | 0.37 | >0.4 | 0.39 | 0.09 | — | 0.07 | — |
Paired-pulse stimulation of inputs led to heterogenous results. Paired-pulse responses were classified by their dominant patterns as displaying either paired-pulse facilitation (PPF; >30% increase in response probability compared with baseline probability) or paired-pulse depression (PPD; >30% decrease in response probability compared with baseline response probability). When differences were seen, PPD was divided into neurons that displayed early depression (>30% decrease in response probability at 10 msec interstimulus intervals compared with baseline response probability) or those that displayed late depression (>30% decrease in response probability at 100 msec interstimulus intervals compared with baseline response probability). Te3 paired-pulse stimulation led to facilitation in 10 projection neurons and depression in 14 projection neurons (Fig. 5). mPFC paired-pulse stimulation resulted in facilitation in four projection neurons and depression in eight projection neurons (Fig.7). In BLA interneurons, the response patterns were more complex, with Te3 inputs displaying facilitation (n = 7), early depression (n = 6), or late depression (n = 3) (Fig. 7). Similarly, mPFC inputs to interneurons displayed facilitation (n = 3), early depression (n = 3), or late depression (n = 3) (Fig. 7). A change of at least 30% is considered a significant change based on analysis of our computed SD (0.58) of the values of stimulus 2 probability divided by stimulus 1. A_t_ value of at least 2.2 is necessary for significance of_p_ < 0.05 in a two-tailed t test when there are <10 degrees of freedom. From this information it is possible to determine the minimal difference between conditions that would be significant using the equation t = (_x_1 − _x_2)/SD, where t = the t value (2.2 is the minimal in this case), SD is 0.58, _x_1 is the mean value of control conditions (no change = 1), and_x_2 is the mean of the second condition (minimal change that would yield significance in a t test). That value was determined to be 27.6% change (∼30%).
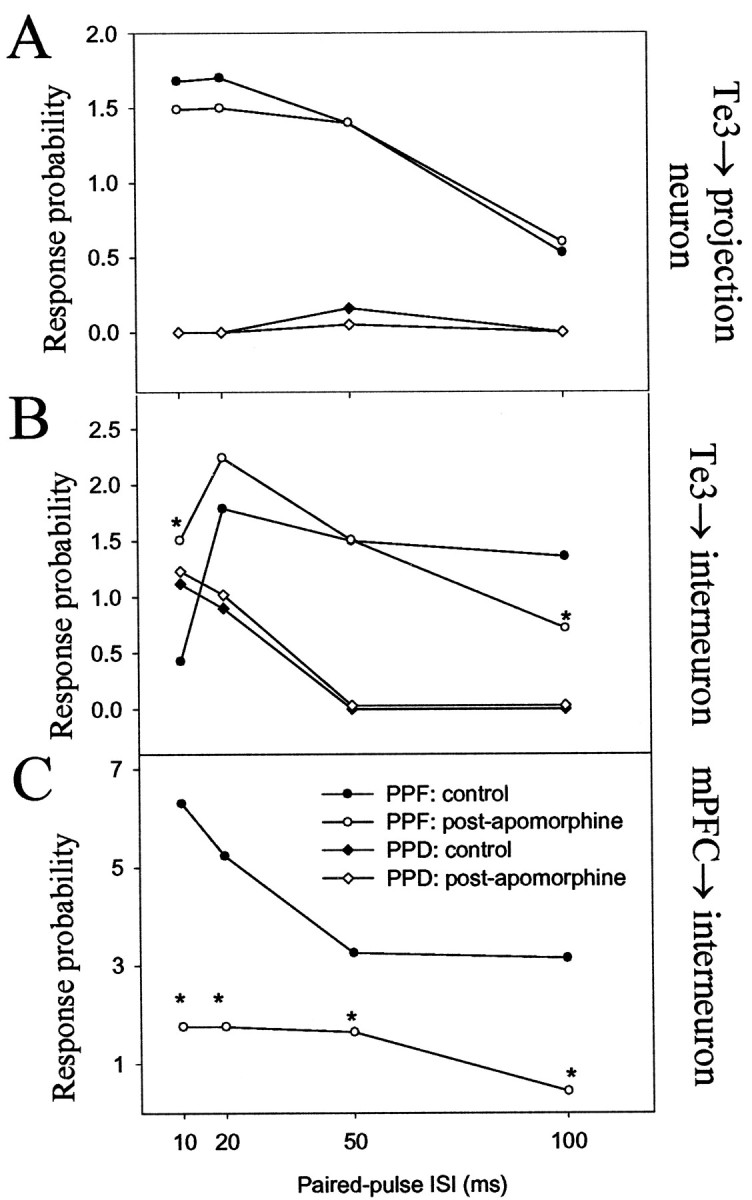
Fig. 7.

Patterns of paired-pulse facilitation of Te3 and mPFC inputs to interneurons and projection neurons of the BLA. Response probability to the second stimulation pulse is divided by the first stimulation pulse. If there is no facilitation or depression, the result will be a value of 1 (dashed line). Values >1 indicate facilitation, whereas values <1 indicate depression. A >30% change from baseline is considered significant (*). A, Paired-pulse stimulation of mPFC (top panel) or Te3 (bottom panel) inputs led to either facilitation or depression of responses in BLA projection neurons. B, In BLA interneurons, paired-pulse stimulation of Te3 inputs (1) led to facilitation (F), early depression (ED), or late depression (LD; from top to_bottom panel_). In BLA interneurons, paired-pulse stimulation of mPFC (2) resulted in ED, LD, or F (from top to bottom panel).
mPFC–Te3 input interaction
In BLA projection neurons, single pulse stimulation of mPFC (0.2–0.8 mA) before a single Te3 stimulation reduced the response to the Te3 input (n = 23 of 27 neurons) (Fig.8), examined in neurons that displayed no monosynaptic response to mPFC stimulation. This effect was seen after prelimbic cortical and infralimbic cortical stimulation. Given the similarities between these inputs regarding other parameters, such as latency and stimulus intensity–response curves, these inputs were grouped here as well. The suppression was maximal at 20 msec (t = 6.16; df = 48; p < 0.001) but was also significant at 50 msec interstimulus intervals (_t_ = 3.72; df = 43; _p_ < 0.001). Although not significant as a group at 10 msec delays for the mPFC stimulation intensities chosen for comparison, 11 of 24 neurons did display a >30% suppression of Te3-evoked spikes at this delay. The mPFC-induced suppression of the Te3-evoked response was stimulus intensity-dependent (data not shown). Thus, low-intensity stimulation of mPFC had little effect on Te3-evoked spike probability, whereas higher intensities could suppress entirely the Te3 responses at ∼10–50 msec delays. When tested, mPFC stimulation appeared to similarly suppress Te3-evoked responses in BLA interneurons (12 of 15 neurons, data not shown), although the time course of this interaction varied [in some interneurons the Te3 response was suppressed only at long (50–100 msec) mPFC–Te3 stimulus delays, whereas in other interneurons the Te3-evoked response was suppressed between ∼10 and 50 msec intervals]. Te3 stimulation before mPFC stimulation did not have a consistent effect on BLA projection neurons, sometimes appearing to attenuate mPFC inputs (n = 3; but <30% even at 1.0 mA stimulation intensity), but usually having no effect (n = 6), or slightly augmenting mPFC inputs (n = 6; <30%; data not shown).
Fig. 8.

mPFC suppresses Te3-evoked monosynaptic responses in projection neurons, and this suppression is attenuated by DA receptor activation. A, Te3 stimulation (0.7 mA, 0.3 msec duration) evokes a short-latency, presumably monosynaptic response in a BLA projection neuron. B1, Overlaid traces of 20 Te3-evoked responses demonstrate a relatively narrow distribution of latencies, consistent with a monosynaptic response. The stimulation intensity can be altered to evoke an ∼50% response probability.B2, mPFC stimulation (0.6 mA, 0.3 msec duration) 20 msec before Te3 stimulation decreases the probability of Te3-evoked responses, demonstrated by fewer evoked spikes in these traces.C1, After apomorphine administration (0.5 mg/kg, i.v.), the stimulation intensity of Te3 is altered until an ∼50% response probability is regained (to 0.7 mA). C2, After apomorphine administration, mPFC stimulation 20 msec before Te3 stimulation no longer produces the potent suppression of Te3-evoked responses. D, The response probabilities for the sample traces in B1–C2 are illustrated for this neuron.E, Overall, in the neurons tested (_n_= 23 of 27) Te3-evoked responses are significantly attenuated by mPFC stimulation, and this attenuation is removed by apomorphine administration (n = 6/7). F, The time course of the mPFC–Te3 interaction under control conditions (F1; * indicates a p < 0.05 significant difference relative to baseline Te3-evoked response probability) and after apomorphine administration (F2).
One potential source of this apparent interaction of inputs could be outside of the BLA. For example, mPFC stimulation could inhibit projection neurons of Te3, increasing their excitation threshold to electrical stimulation. To test whether this could explain the interaction observed here, the mPFC interaction with fiber stimulation-evoked responses was examined. It was not feasible to stimulate the external capsule, which carries Te3 fibers to the BLA, because of the difficulties associated with discrete stimulation of a narrow tract in vivo without stimulating surrounding areas. Thus, the stria terminals, which carries glutamatergic fibers to the BLA, was stimulated. At the coordinates selected, the stria terminalis is wide enough to be targeted by a stimulating electrode. Moreover, surrounding cellular areas do not project to the BLA, thus minimizing any concern about current spread. Fiber stimulation at the chosen coordinates evoked short-latency, presumably monosynaptic, responses with latencies similar to Te3 stimulation (12.6 ± 1.74 msec, n = 14, and 10.7 ± 0.39 msec, respectively). Stimulation of mPFC before stria terminalis stimulation significantly attenuated the response to the stria terminalis inputs with a time course similar to that observed for the inhibition of Te3 inputs (at 20 msec delay t = 4.85, df = 20,p < 0.001) (Fig. 9). At the mPFC stimulation intensities used, 100% inhibition of stria terminalis-evoked responses was often seen.
Fig. 9.

mPFC stimulation suppresses fiber bundle-evoked responses in BLA neurons. A, Stimulation of mPFC 20 msec before stimulation of the stria terminalis fiber bundle attenuates the probability of a stria terminalis-evoked monosynaptic spike (*p < 0.05). These data demonstrate that the mPFC is not likely attenuating Te3-evoked responses by an action at the Te3 cell body, but instead is probably having an effect within the BLA.B, The time course of mPFC-evoked suppression of stria terminalis-evoked responses (* indicates that stria terminalis-evoked response probability is significantly (p < 0.05) attenuated by previous mPFC stimulation, compared with baseline stria terminalis-evoked response probability).
Dopaminergic modulation of cortical inputs and their interaction
In previous studies, we examined the effects of a single stimulus intensity on projection neurons (Rosenkranz and Grace, 1999), showing that DA receptor activation attenuates mPFC inputs and enhances Te3 inputs. In the present study, the analysis was expanded to include multiple stimulation intensities and examination of the effects of DA receptor activation on cortically evoked responses recorded from projection neurons and interneurons. Systemic apomorphine administration (0.5–1.0 mg/kg, i.v.) enhanced Te3 inputs to BLA projection neurons [F = 5.76, df = 38,p < 0.05; significant at 0.1 mA below baseline threshold stimulation intensity (denoted by “A”; _t_= 2.79) and T (_t_ = 5.8); both df = 18 and_p_ ≤ 0.01] and interneurons (_F_ = 20.3, df = 18, _p_ < 0.001; significant at all stimulus intensities compared; at A, _t_ = 3.278, df = 16,_p_ < 0.01; at T, _t_ = 4.29, df = 21, _p_ < 0.001; at 0.1 mA above threshold,_t_ = 6.07, df = 20, _p_ < 0.001; at 0.2 mA above threshold, _t_ = 3.12, df = 20,_p_ < 0.01; at 0.3 mA above threshold, _t_= 2.71, df = 19, _p_ = 0.01), resulting in a leftward shift in the input–output curve (Fig.10). Our previous study demonstrated a greater effect of apomorphine administration on Te3-evoked responses (Rosenkranz and Grace, 1999), probably because of differences in doses used. The effect appears more dramatic for interneurons, probably because the projection neurons already fire at near maximal capacity in response to Te3 stimulation before apomorphine administration. The normalized stimulus intensity that evokes a 50% response probability after Te3 stimulation (determined from regression analysis) is lowered from 0.17 to 0.09 mA above threshold in projection neurons and from 0.22 to 0.067 mA above threshold in interneurons. In several cases, after apomorphine administration, neurons responded to stimulus intensities 0.3 mA lower than their previous threshold. The opposite was seen with mPFC inputs. Thus, after apomorphine administration (0.5–1.0 mg/kg, i.v.), mPFC inputs to BLA interneurons were attenuated [_F_ = 5.38, df = 19, _p_ < 0.05; significant at all but the last two intensities tested (0.3 and 0.4 mA above threshold); at T, _t_ = 2.89; at 0.1 mA above threshold, _t_ = 3.05; at 0.2 mA above threshold,_t_ = 2.75; for all, df = 21, _p_ ≤ 0.01] as well as inputs to projection neurons (_F_ = 9.55, df = 16, _p_ < 0.01; significant at intensities >0.2 mA above threshold: 0.2 mA above threshold,t = 2.22, df = 23, p < 0.05; 0.3 mA above threshold, _t_ = 2.85, df = 22,_p_ < 0.01; 0.4 mA above threshold, _t_ = 3.08, df = 15, _p_ < 0.01), resulting in a rightward shift of the input–output curve (Fig. 10). Thus, the normalized stimulus intensity that evoked a 50% response probability after mPFC stimulation dramatically increased by 496% (i.e., from 0.075 to 0.372 mA above threshold) in interneurons, and in projection neurons it increased by >200% (i.e., from 0.289 mA above threshold to beyond the stimulus intensities tested). Even at 0.4 mA above threshold most projection neurons did not respond with a >25% response probability after apomorphine administration. As in our previous study (Rosenkranz and Grace, 1999), the effects of apomorphine on mPFC and Te3 inputs were reversible after systemic administration of the DA antagonist haloperidol (0.35–0.5 mg/kg, i.v.; three of four neurons, data not shown). Moreover, the increase in the firing rate of putative interneurons accompanied by the decrease in the firing rate of projection neurons seen with DA receptor activation (Rosenkranz and Grace, 1999) probably do not account for differences seen between mPFC and Te3 inputs, because DA receptor activation exerted the same effect on a given input regardless of whether the target was an interneuron or projection neuron. Furthermore, there were no significant differences between the lateral and basolateral nuclei with regard to the effects of DA receptor activation (Table 2).
Fig. 10.

DA receptor activation has opposite effects on mPFC and Te3 inputs to the BLA. In projection neurons, apomorphine causes a downward shift in spike probability after mPFC stimulation (A) while causing a decrease in threshold for responses after Te3 stimulation (B). For interneurons, apomorphine produces a potent attenuation of mPFC-evoked firing (C) while increasing the Te3-evoked spiking (D). Thus, apomorphine attenuates prefrontal cortical inputs to projection neurons and interneurons, whereas it augments Te3 inputs to projection neurons and interneurons. In all graphs (*) indicates that the comparison to control at the same stimulus intensity is significantly different (p < 0.05).
Apomorphine administration also attenuated the mPFC stimulation-induced suppression of Te3-evoked responses (n = 6 of 7,F = 7.66, df = 14, p = 0.01) (Fig.8). Apomorphine administration caused significant changes at mPFC–Te3 stimulus delays of 20 msec (preapomorphine, 30.8 ± 6.4% of baseline; postapomorphine, 99.0 ± 17% of baseline,t = 4.28, df = 14, p < 0.001; at 50 msec delay, preapomorphine, 61.1 ± 9.7%, postapomorphine, 106.4 ± 21% of baseline, t = 2.1, df = 14,p < 0.05). Additionally, after apomorphine administration, none of the mPFC–Te3 stimulus delays were significantly different from postapomorphine baseline value. Thus, apomorphine effectively removed the mPFC suppression of Te3 inputs.
Changes in paired-pulse facilitation at short ISIs may reflect presynaptic alterations of neurotransmitter release, and at longer ISIs, changes in paired-pulse facilitation may also reflect alterations in local circuitry. After apomorphine administration, some changes (>30%) in paired-pulse facilitation were seen compared with baseline facilitation patterns. mPFC inputs to interneurons consistently displayed changes in paired-pulse facilitation at most ISIs tested (n = 4; 75% displayed increased PPF, 25% displayed decreased PPF) (Fig. 11). There were never changes observed in paired-pulse facilitation of Te3 inputs to projection neurons after apomorphine administration (n = 5) (Fig. 11). Te3 inputs to interneurons that displayed paired-pulse depression were not altered after apomorphine (n = 3), whereas those that displayed paired-pulse facilitation were altered after apomorphine administration (n = 3) (Fig. 10). However, alterations in paired-pulse facilitation at ISIs of 10 msec were very rare (one of six neurons), implying that changes in paired-pulse facilitation at Te3 inputs to interneurons are attributable to alterations in local circuitry and may not be caused by alterations in neurotransmitter release probability at the Te3 terminal. Changes in paired-pulse facilitation of Te3-evoked responses in BLA interneurons but not projection neurons supports this and also indicate that Te3 interneurons that receive a monosynaptic input from Te3 do not innervate the BLA projection neurons that also receive a monosynaptic input from Te3. Paired-pulse facilitation of mPFC inputs to projection neurons could not be studied after apomorphine administration because of the potent suppressive effects produced by apomorphine on these inputs.
Fig. 11.
DA receptor activation alters paired-pulse facilitation of selected BLA afferents. A, DA receptor activation had negligible effects on paired-pulse facilitation or depression of Te3 inputs to BLA projection neurons. _B,_Paired-pulse facilitation, but not depression, of Te3 inputs to BLA interneurons was altered by DA receptor activation. _C,_Paired-pulse facilitation of mPFC inputs to BLA interneurons (and depression; data not shown) was altered by DA receptor activation. A change of >30% is considered significant (*) when comparing control and postapomorphine administration values of paired-pulse facilitation at a given ISI.
Whereas alterations in paired-pulse facilitation of mPFC inputs after apomorphine administration may indicate that a portion of the effects of DA receptor activation on mPFC inputs is presynaptic, it is unclear whether these effects may be confined to presynaptic terminals within the BLA. To exclude the potential effects of apomorphine on somata of prefrontal cortical neurons that project to the BLA, fibers lateral to the prefrontal cortical areas of interest were stimulated, and the effects of DA receptor activation were examined. Stimulation of the forceps minor of the corpus callosum, which includes axons of the prefrontal cortex that project to the BLA, evoked short-latency spikes from BLA neurons (latency, 17.9 ± 4.4 msec) (n = 8). Administration of apomorphine (0.5–1.0 mg/kg, i.v.) resulted in a suppression of fiber-evoked responses (preapomorphine, 53 ± 18%; postapomorphine, 16 ± 18%; t = 4.98 paired_t_ test, df = 5, p < 0.001). Additionally, paired-pulse facilitation was examined in four of these neurons. In each case, administration of apomorphine resulted in a >30% change in paired-pulse facilitation (data not shown), indicating that the effects of apomorphine on mPFC inputs is probably localized to the BLA.
DISCUSSION
The studies described in this paper present data that provide a possible physiological substrate for mPFC regulation of amygdala-mediated behaviors and the means by which sensory-driven inputs over-ride mPFC regulation after DA receptor activation. This analysis is based on several assumptions. Similar to our previous study (Rosenkranz and Grace, 1999), we have operationally defined BLA neuronal populations as interneurons and projection neurons based on firing rate, action potential duration, and antidromic activation. Intracellular studies indicate that morphologically identified interneurons do display shorter duration action potentials and tend to display higher levels of spontaneous activity (Washburn and Moises, 1992; Rainnie et al., 1993; Gaudreau and Pare, 1996; Pare and Gaudreau, 1996). Moreover, we have been able to antidromically activate only the neurons identified a priori as projection neurons. Thus, the basic assumptions of our categorization are consistent with these observations. In addition, criteria were established that define evoked responses as monosynaptic, polysynaptic, or antidromic. Although the criteria are not absolute, these strict criteria would most probably result in exclusion of some monosynaptic responses instead of inclusion of polysynaptic responses in the data.
Prefrontal cortical regulation of the BLA
Our studies provide evidence that BLA neurons respond differently to mPFC and sensory association cortical inputs. Te3 inputs are able to drive projection neuron firing with greater efficacy and potency than mPFC inputs, possibly because of differences in the proximal-distal location of inputs. However, previous studies demonstrate that both inputs tend to primarily target spines, and not proximal dendrites, although some inputs are seen to innervate thin dendrites (Brinley-Reed et al., 1995; Farb and LeDoux, 1999). A more likely explanation is that mPFC stimulation recruits interneurons that inhibit the same BLA projection neurons that receive mPFC inputs, thus evoking inhibition in a feedforward manner. The shorter latency of mPFC-evoked responses in BLA interneurons is consistent with feedforward inhibition. This shorter latency can be caused by several factors, including differences in the conduction velocity of mPFC fibers, interneuronal tendency to remain at a membrane potential closer to spike threshold (Lang and Pare, 1998), the smaller somatodendritic size of interneurons and their tendency to exhibit higher input resistance, and the likelihood that the glutamatergic inputs may be located more proximal to the somata of interneurons than projection neurons that have more extensive dendritic fields. Additionally, preliminary studies indicate that mPFC stimulation can evoke long-duration hyperpolarizations that truncate EPSPs or are often evoked in the absence of time-locked EPSPs (Rosenkranz and Grace, 2000). Furthermore, spontaneously spiking projection neurons of the BLA will often display a time-locked suppression of firing when the mPFC is stimulated at spike-subthreshold intensities, and a decrease in basal firing rate during periods of mPFC stimulation. These data imply that mPFC stimulation potently activates interneurons that can inhibit BLA output. Anatomical studies indicate that few mPFC inputs innervate parvalbumin-positive interneurons of the BLA (Smith et al., 2000). If the BLA is analogous to hippocampus and cortex, parvalbumin-positive interneurons may not be preferentially involved in feedforward inhibition (Freund and Buzsaki, 1996; Somogyi et al., 1998; Smith et al., 1998), and it may therefore be expected that most of the mPFC inputs target a separate class of interneurons. One interpretation of these data are that mPFC inputs to the BLA may function to keep affective behaviors in check. Thus, heightened PFC activity is associated with inhibition of a behavioral response in some conditions (Watanabe, 1986; Iwabuchi and Kubota, 1998; Sawaguchi and Yamane, 1999). The potent effect that mPFC inputs appear to have on BLA interneurons may temporarily reduce the excitability of BLA projection neurons and thereby suppress BLA-mediated behaviors or select from sets of competing BLA outputs.
Infralimbic and prelimbic stimulation produced similar results. Both inputs displayed similar latencies, input–output curves, and importantly, both inputs similarly suppressed Te3-evoked responses recorded from the lateral nucleus. The infralimbic cortex projects directly to the lateral nucleus. The prelimbic cortex projects primarily to the basolateral nucleus, a nucleus that receives sparse Te3 inputs. It is thus probable that prelimbic stimulation suppressed Te3-evoked responses in the lateral nucleus via axons from inhibitory interneurons of the basolateral nucleus that project into the lateral nucleus (Sugita et al., 1992, 1993; Pitkanen et al., 1997; Savander et al., 1997).
Sensory inputs to the BLA
Many BLA-dependent behaviors are driven by discrete sensory stimuli that possess affective salience (Selden et al., 1991; Uwano et al., 1995; Davis, 1997; Muller et al., 1997). There is evidence for long-term changes of sensory-cortical neuronal activity (Edeline et al., 1993; Poremba et al., 1998) and between sensory inputs and BLA neurons, concordant with affective conditioning (McKernan and Shinnick-Gallagher, 1997; Rogan et al., 1997; Huang and Kandel, 1998; Pare and Collins, 2000). Although stimulation of Te3 evokes responses in interneurons and projection neurons, it does not evoke responses in interneurons with as great an efficacy as does mPFC stimulation. This may, in part, account for the higher efficacy of Te3-evoked responses in BLA projection neurons compared with mPFC-evoked responses; i.e., the relative lack of feedforward inhibition of inputs. Consistent with this are the overlapping latencies of Te3-evoked responses in BLA interneurons and projection neurons. Interestingly, in many projection neurons, stimulation of Te3 at intensities that evoked a presumptive monosynaptic action potential resulted in a time-locked inhibition of firing after the evoked spike suggestive of feedback inhibition. The differences in timing of mPFC- and Te3-evoked activation of BLA interneurons relative to afferent-evoked excitation of projection neurons may result in a mechanism by which Te3 inputs excite some BLA output neurons while suppressing competing outputs, resulting in a sharpening of the response to Te3. In contrast, mPFC inputs appear to mediate a more general suppression of BLA afferent drive.
Interaction of sensory cortical and mPFC excitatory inputs to the BLA
mPFC stimulation before stimulation of Te3 reduces the BLA neuronal activity that is driven by Te3 inputs. However, stimulation of the same sensory cortical area before mPFC stimulation does not appear to consistently suppress mPFC-driven responses. Thus, the circuitry of the BLA is organized in a manner that allows sensory and mPFC inputs to exert opposite effects on BLA output primarily via mPFC-induced activation of BLA interneurons that suppress sensory cortical throughput. This may provide a mechanism by which mPFC regulates BLA-mediated affective responses to sensory stimuli.
Dopaminergic modulation of BLA afferents
Systemic administration of apomorphine more closely mimics global elevations of DA, such as those that occur during stress. However, several pieces of data indicate that the effects of DA observed in this study occur within the BLA: (1) previous studies have demonstrated that DA receptors exert potent electrophysiological actions within the BLA (Ben-Ari and Kelly, 1976; Rosenkranz and Grace, 1999); and (2) DA receptor activation alters paired-pulse facilitation even when fiber bundles and not cell bodies are stimulated. Nevertheless, additional actions within other areas cannot be ruled out.
DA receptor activation in the BLA of behaving animals is necessary for, and may potentiate, the production of amygdala-dependent affective behaviors (Borowski and Kokkinidis, 1996; Lamont and Kokkinidis, 1998; Guarraci et al., 1999; Nader and LeDoux, 1999). Thus, DA is in a key position to switch the animal from a state of suppression mediated by mPFC inputs to a state of sensory-driven affective behavior induced by sensory cortical inputs. A likely mechanism by which DA receptor activation alters the balance of inputs is via a combination of two actions: (1) a presynaptic effect that suppresses mPFC inputs, as supported by our paired-pulse facilitation data, and as occurs in other brain regions (Maura et al., 1988; Cepeda et al., 1993; O'Donnell and Grace, 1994; Hsu et al., 1995; Flores-Hernandez et al., 1997; Behr et al., 2000), thereby potently reducing mPFC-driven excitation of BLA inhibitory interneurons; and (2) a postsynaptic effect on membrane properties and synaptic sites (as occurs in other brain regions, i.e.,Geijo-Barrientos and Pastore, 1995; Surmeier et al., 1995; Yang and Seamans, 1996; Zhou and Hablitz, 1999; Gorelova and Yang, 2000), resulting in an apparent potentiation of other glutamatergic inputs, such as the Te3 inputs to the BLA. Additionally, it is possible that the inhibitory interneurons that receive DAergic input (Brinley-Reed and McDonald, 1999) and whose activity is enhanced by DA receptor activation, may be involved in the enhancement of signal-to-noise ratios, inhibiting nonspecific BLA output that may be driven by spurious inputs that are incidentally enhanced by a postsynaptic mechanism. The enhancement of BLA inhibitory interneuronal activity by DA receptor activation will effectively allow only the more potent inputs to drive BLA output.
Functional consequences
Situations exist in which DA levels in the BLA are enhanced, such as in the presence of affective sensory stimuli (Coco et al., 1992;Hori et al., 1993; Harmer and Phillips, 1999b; Inglis and Moghaddam, 1999). Under normal conditions, increases of DA levels in the BLA may lead to heightened sensory-driven BLA neuronal responses at sensory input–BLA neuron synapses that have been potentiated by previous experience, and thus facilitating the appropriate affective response (Fig. 12). However, there are circumstances that could alter this delicate balance between these systems. For example, with abnormally heightened DA levels such as occurs after cocaine or amphetamine administration (Garris and Wightman, 1995; Harmer et al., 1997; Hurd et al., 1997), or when PFC inputs to the BLA are otherwise weakened as proposed to occur in cases of hypofrontality seen in schizophrenia (Andreasen et al., 1997; Dolan et al., 1999; Grace, 2000), an impairment of PFC-induced inhibitory regulation of BLA neurons will result. As a consequence, the loss of PFC suppression would result in augmentation of BLA-dependent affective behaviors (Jaskiw and Weinberger, 1992; Morgan and LeDoux, 1995;Willick and Kokkinidis, 1995; Jinks and McGregor, 1997; Schneider et al., 1998; Earnst and Kring, 1999; Harmer and Phillips 1999a). Under these conditions, normally subthreshold, nonpotentiated sensory inputs may be able to override the weakened PFC regulation to drive BLA output, leading to inappropriate affective behaviors.
Fig. 12.

Schematic of the mPFC regulation of BLA output and its modulation by DA. In this figure, neurons of the mPFC and Te3 that project to the BLA are represented by _triangles,and their level of activity is represented by firing rate histograms within the triangles. The dominant input is represented by a_bolder line connecting the cortical area with the BLA. BLA projection neuron (triangle) activity is represented by hypothetical voltage traces within the triangle. _A,_Enhanced mPFC activity (1) will decrease BLA output (hyperpolarization; 2) caused by activation of a BLA inhibitory interneuron (3). _B,_Enhanced sensory cortical activity (1) will lead to action potential firing (2) in BLA projection neurons. C, mPFC inputs (1) that occur concomitant with sensory cortical inputs (2) will dampen the spike firing that is induced by sensory cortical inputs under basal conditions (EPSP without action potential; 3). D, If the sensory stimulus has affective value, DA is released in the BLA. In the presence of DA (1), the BLA output will be enhanced (numerous action potentials; 4) by a combination of attenuated mPFC inputs (2) to interneurons, and augmented sensory cortical inputs (3).
Footnotes
This work was supported by National Institutes of Health Grants MH57440, MH45156 (A.A.G.), and MH 12533 (J.A.R.). We thank Nicole MacMurdo, Brian Lowry, and Christy Wyant for excellent technical assistance, Dr. Holly Moore for valuable discussion, and Dr. Susan Sesack for microscopy advice.
Correspondence should be addressed to J. Amiel Rosenkranz, Department of Neuroscience, 446 Crawford Hall, University of Pittsburgh, Pittsburgh, PA 15260. E-mail: Rosenk@bns.pitt.edu.
REFERENCES
- 1.Al Maskati HA, Zbrozyna AW. Stimulation in prefrontal cortex area inhibits cardiovascular and motor components of the defence reaction in rats. J Auton Nerv Syst. 1989;28:117–126. doi: 10.1016/0165-1838(89)90084-2. [DOI] [PubMed] [Google Scholar]
- 2.Alheid G, de Olmos JS, Beltramino CA. Amygdala and extended amygdala. In: Paxinos G, editor. The rat nervous system, Ed 2. Academic; Sydney: 1995. pp. 495–572. [Google Scholar]
- 3.Andreasen NC, O'Leary DS, Flaum M, Nopoulos P, Watkins GL, Boles Ponto LL, Hichwa RD. Hypofrontality in schizophrenia: distributed dysfunctional circuits in neuroleptic-naive patients. Lancet. 1997;349:1730–1734. doi: 10.1016/s0140-6736(96)08258-x. [DOI] [PubMed] [Google Scholar]
- 4.Armony JL, Servan-Schreiber D, Romanski LM, Cohen JD, LeDoux JE. Stimulus generalization of fear responses: effects of auditory cortex lesions in a computational model and in rats. Cereb Cortex. 1997;7:157–165. doi: 10.1093/cercor/7.2.157. [DOI] [PubMed] [Google Scholar]
- 5.Armony JL, Quirk GJ, LeDoux JE. Differential effects of amygdala lesions on early and late plastic components of auditory cortex spike trains during fear conditioning. J Neurosci. 1998;18:2592–2601. doi: 10.1523/JNEUROSCI.18-07-02592.1998. [DOI] [PMC free article] [PubMed] [Google Scholar]
- 6.Arnault P, Roger M. Ventral temporal cortex in the rat: connections of secondary auditory areas Te2 and Te3. J Comp Neurol. 1990;302:110–123. doi: 10.1002/cne.903020109. [DOI] [PubMed] [Google Scholar]
- 7.Behr J, Gloveli T, Schmitz D, Heinemann U. Dopamine depresses excitatory synaptic transmission onto rat subicular neurons via presynaptic D1-like dopamine receptors. J Neurophysiol. 2000;84:112–119. doi: 10.1152/jn.2000.84.1.112. [DOI] [PubMed] [Google Scholar]
- 8.Ben-Ari Y, Kelly JS. Dopamine evoked inhibition of single cells of the feline putamen and basolateral amygdala. J Physiol (Lond) 1976;256:1–21. doi: 10.1113/jphysiol.1976.sp011308. [DOI] [PMC free article] [PubMed] [Google Scholar]
- 9.Borowski TB, Kokkinidis L. Contribution of ventral tegmental area dopamine neurons to expression of conditional fear: effects of electrical stimulation, excitotoxin lesions, and quinpirole infusion on potentiated startle in rats. Behav Neurosci. 1996;110:1349–1364. doi: 10.1037//0735-7044.110.6.1349. [DOI] [PubMed] [Google Scholar]
- 10.Breier A, Buchanan RW, Elkashef A, Munson RC, Kirkpatrick B, Gellad F. Brain morphology and schizophrenia. A magnetic resonance imaging study of limbic, prefrontal cortex, and caudate structures. Arch Gen Psychiatry. 1992;49:921–926. doi: 10.1001/archpsyc.1992.01820120009003. [DOI] [PubMed] [Google Scholar]
- 11.Brinley-Reed M, McDonald AJ. Evidence that dopaminergic axons provide a dense innervation of specific neuronal subpopulations in the rat basolateral amygdala. Brain Res. 1999;850:127–135. doi: 10.1016/s0006-8993(99)02112-5. [DOI] [PubMed] [Google Scholar]
- 12.Brinley-Reed M, Mascagni F, McDonald AJ. Synaptology of prefrontal cortical projections to the basolateral amygdala: an electron microscopic study in the rat. Neurosci Lett. 1995;202:45–48. doi: 10.1016/0304-3940(95)12212-5. [DOI] [PubMed] [Google Scholar]
- 13.Campeau S, Davis M. Involvement of subcortical and cortical afferents to the lateral nucleus of the amygdala in fear conditioning measured with fear-potentiated startle in rats trained concurrently with auditory and visual conditioned stimuli. J Neurosci. 1995;15:2312–2327. doi: 10.1523/JNEUROSCI.15-03-02312.1995. [DOI] [PMC free article] [PubMed] [Google Scholar]
- 14.Cepeda C, Buckwald NA, Levine MS. Neuromodulatory action of DA in the neostriatum are dependent on the excitatory amino acid receptor subtypes activated. Proc Natl Acad Sci USA. 1993;90:9576–9580. doi: 10.1073/pnas.90.20.9576. [DOI] [PMC free article] [PubMed] [Google Scholar]
- 15.Coco ML, Kuhn CM, Ely TD, Kilts CD. Selective activation of mesoamygdaloid dopamine neurons by conditioned stress: attenuation by diazepam. Brain Res. 1992;590:39–47. doi: 10.1016/0006-8993(92)91079-t. [DOI] [PubMed] [Google Scholar]
- 16.Davis M. Neurobiology of fear responses: the role of the amygdala. J Neuropsychiatry Clin Neurosci. 1997;9:382–402. doi: 10.1176/jnp.9.3.382. [DOI] [PubMed] [Google Scholar]
- 17.Diamond DM, Weinberger NM. Physiological plasticity of single neurons in auditory cortex of the cat during acquisition of the pupillary conditioned response: II. Secondary field (AII). Behav Neurosci. 1984;98:189–210. [PubMed] [Google Scholar]
- 18.Diamond DM, Weinberger NM. Classical conditioning rapidly induces specific changes in frequency receptive fields of single neurons in secondary and ventral ectosylvian auditory cortical fields. Brain Res. 1986;372:357–360. doi: 10.1016/0006-8993(86)91144-3. [DOI] [PubMed] [Google Scholar]
- 19.Dias R, Robbins TW, Roberts AC. Dissociation in prefrontal cortex of affective and attentional shifts. Nature. 1996;380:69–72. doi: 10.1038/380069a0. [DOI] [PubMed] [Google Scholar]
- 20.Dolan RJ, Fletcher PC, McKenna P, Friston KJ, Frith CD. Abnormal neural integration related to cognition in schizophrenia. Acta Psychiatr Scand [Suppl] 1999;395:58–67. doi: 10.1111/j.1600-0447.1999.tb05984.x. [DOI] [PubMed] [Google Scholar]
- 21.Drevets WC. Prefrontal cortical-amygdalar metabolism in major depression. Ann NY Acad Sci. 1999;877:614–637. doi: 10.1111/j.1749-6632.1999.tb09292.x. [DOI] [PubMed] [Google Scholar]
- 22.Earnst KS, Kring AM. Emotional responding in deficit and non-deficit schizophrenia. Psychiatry Res. 1999;88:191–207. doi: 10.1016/s0165-1781(99)00083-9. [DOI] [PubMed] [Google Scholar]
- 23.Edeline JM, Pham P, Weinberger NM. Rapid development of learning-induced receptive field plasticity in the auditory cortex. Behav Neurosci. 1993;107:539–551. doi: 10.1037//0735-7044.107.4.539. [DOI] [PubMed] [Google Scholar]
- 24.Farb CR, LeDoux JE. Afferents from rat temporal cortex synapse on lateral amygdala neurons that express NMDA and AMPA receptors. Synapse. 1999;33:218–229. doi: 10.1002/(SICI)1098-2396(19990901)33:3<218::AID-SYN6>3.0.CO;2-1. [DOI] [PubMed] [Google Scholar]
- 25.Flores-Hernandez J, Galarraga E, Bargas J. Dopamine selects glutamatergic inputs to neostriatal neurons. Synapse. 1997;25:185–195. doi: 10.1002/(SICI)1098-2396(199702)25:2<185::AID-SYN9>3.0.CO;2-8. [DOI] [PubMed] [Google Scholar]
- 26.Freund TF, Buzsaki G. Interneurons of the hippocampus. Hippocampus. 1996;6:347–470. doi: 10.1002/(SICI)1098-1063(1996)6:4<347::AID-HIPO1>3.0.CO;2-I. [DOI] [PubMed] [Google Scholar]
- 27.Garris PA, Wightman RM. Distinct pharmacological regulation of evoked dopamine efflux in the amygdala and striatum of the rat in vivo. Synapse. 1995;20:269–279. doi: 10.1002/syn.890200311. [DOI] [PubMed] [Google Scholar]
- 28.Gaudreau H, Pare D. Projection neurons of the lateral amygdaloid nucleus are virtually silent throughout the sleep–waking cycle. J Neurophysiol. 1996;75:1301–1305. doi: 10.1152/jn.1996.75.3.1301. [DOI] [PubMed] [Google Scholar]
- 29.Geijo-Barrientos E, Pastore C. The effects of dopamine on the subthreshold electrophysiological responses of rat prefrontal cortex neurons in vitro. Eur J Neurosci. 1995;7:358–366. doi: 10.1111/j.1460-9568.1995.tb00331.x. [DOI] [PubMed] [Google Scholar]
- 30.Gewirtz JC, Falls WA, Davis M. Normal conditioned inhibition and extinction of freezing and fear-potentiated startle following electrolytic lesions of medical prefrontal cortex in rats. Behav Neurosci. 1997;111:712–726. doi: 10.1037//0735-7044.111.4.712. [DOI] [PubMed] [Google Scholar]
- 31.Goddard AW, Charney DS. Toward an integrated neurobiology of panic disorder. J Clin Psychiatry. 1997;[Suppl 2] 58:4–11. [PubMed] [Google Scholar]
- 32.Gorelova N, Yang CR. Dopamine D1/D5 receptor activation modulates a persistent sodium current in rat prefrontal cortical neurons in vitro. J Neurophysiol. 2000;84:75–87. doi: 10.1152/jn.2000.84.1.75. [DOI] [PubMed] [Google Scholar]
- 33.Grace AA. Gating of information flow within the limbic system and the pathophysiology of schizophrenia. Brain Res Rev. 2000;31:330–341. doi: 10.1016/s0165-0173(99)00049-1. [DOI] [PubMed] [Google Scholar]
- 34.Guarraci FA, Frohardt RJ, Kapp BS. Amygdaloid D1 dopamine receptor involvement in Pavlovian fear conditioning. Brain Res. 1999;827:28–40. doi: 10.1016/s0006-8993(99)01291-3. [DOI] [PubMed] [Google Scholar]
- 35.Harmer CJ, Phillips GD. Enhanced conditioned inhibition following repeated pretreatment with d-amphetamine. Psychopharmacology. 1999a;142:120–131. doi: 10.1007/s002130050870. [DOI] [PubMed] [Google Scholar]
- 36.Harmer CJ, Phillips GD. Enhanced dopamine efflux in the amygdala by a predictive, but not a non-predictive, stimulus: facilitation by prior repeated d-amphetamine. Neuroscience. 1999b;90:119–130. doi: 10.1016/s0306-4522(98)00464-3. [DOI] [PubMed] [Google Scholar]
- 37.Harmer CJ, Hitchcott PK, Morutto SL, Phillips GD. Repeated d-amphetamine enhances stimulated mesoamygdaloid dopamine transmission. Psychopharmacology. 1997;132:247–254. doi: 10.1007/s002130050342. [DOI] [PubMed] [Google Scholar]
- 38.Hori K, Tanaka J, Nomura M. Effects of discrimination learning on the rat amygdala dopamine release: a microdialysis study. Brain Res. 1993;621:296–300. doi: 10.1016/0006-8993(93)90119-8. [DOI] [PubMed] [Google Scholar]
- 39.Huang YY, Kandel ER. Postsynaptic induction and PKA-dependent expression of LTP in the lateral amygdala. Neuron. 1998;21:169–178. doi: 10.1016/s0896-6273(00)80524-3. [DOI] [PubMed] [Google Scholar]
- 40.Humphrey DR. Extracellular single unit recording methods. In: Humphrey DR, editor. Electrophysiological techniques. Society for Neuroscience; Bethesda, MD: 1979. pp. 199–259. [Google Scholar]
- 41.Hurd YL, McGregor A, Ponten M. In vivo amygdala dopamine levels modulate cocaine self-administration behaviour in the rat: D1 dopamine receptor involvement. Eur J Neurosci. 1997;9:2541–2548. doi: 10.1111/j.1460-9568.1997.tb01683.x. [DOI] [PubMed] [Google Scholar]
- 42.Hsu KS, Huang CC, Yang CH. Presynaptic D2 dopaminergic receptors mediate inhibition of excitatory synaptic transmission in rat neostriatum. Brain Res. 1995;690:264–268. doi: 10.1016/0006-8993(95)00734-8. [DOI] [PubMed] [Google Scholar]
- 43.Inglis FM, Moghaddam B. Dopaminergic innervation of the amygdala is highly responsive to stress. J Neurochem. 1999;72:1088–1094. doi: 10.1046/j.1471-4159.1999.0721088.x. [DOI] [PubMed] [Google Scholar]
- 44.Iwabuchi A, Kubota K. Laminar organization of neuronal activities in area 8 of rhesus monkeys during a symmetrically reinforced visual GO/NO-GO task. Int J Neurosci. 1998;94:1–25. doi: 10.3109/00207459808986435. [DOI] [PubMed] [Google Scholar]
- 45.Jaskiw GE, Weinberger DR. Ibotenic acid lesions of the medial prefrontal cortex augment swim-stress-induced locomotion. Pharmacol Biochem Behav. 1992;41:607–609. doi: 10.1016/0091-3057(92)90380-x. [DOI] [PubMed] [Google Scholar]
- 46.Jinks AL, McGregor IS. Modulation of anxiety-related behaviors following lesions of the prelimbic or infralimbic cortex in the rat. Brain Res. 1997;772:181–190. doi: 10.1016/s0006-8993(97)00810-x. [DOI] [PubMed] [Google Scholar]
- 47.Lamont EW, Kokkinidis L. Infusion of the dopamine D1 receptor antagonist SCH 23390 into the amygdala blocks fear expression in a potentiated startle paradigm. Brain Res. 1998;795:128–136. doi: 10.1016/s0006-8993(98)00281-9. [DOI] [PubMed] [Google Scholar]
- 48.Lang EJ, Pare D. Synaptic responsiveness of interneurons of the cat lateral amygdaloid nucleus. Neuroscience. 1998;83:877–889. doi: 10.1016/s0306-4522(97)00420-x. [DOI] [PubMed] [Google Scholar]
- 49.Lawrie SM, Abukmeil SS. Brain abnormality in schizophrenia. A systematic and quantitative review of volumetric magnetic resonance imaging studies. Br J Psychiatry. 1998;172:110–120. doi: 10.1192/bjp.172.2.110. [DOI] [PubMed] [Google Scholar]
- 50.LeDoux JE, Cicchetti P, Xagoraris A, Romanski LM. The lateral amygdaloid nucleus: sensory interface of the amygdala in fear conditioning. J Neurosci. 1990;10:1062–1069. doi: 10.1523/JNEUROSCI.10-04-01062.1990. [DOI] [PMC free article] [PubMed] [Google Scholar]
- 51.Loup F, Wieser HG, Yonekawa Y, Aguzzi A, Fritschy JM. Selective alterations in GABAA receptor subtypes in human temporal lobe epilepsy. J Neurosci. 2000;20:5401–5419. doi: 10.1523/JNEUROSCI.20-14-05401.2000. [DOI] [PMC free article] [PubMed] [Google Scholar]
- 52.Mascagni F, McDonald AJ, Coleman JR. Corticoamygdaloid and corticocortical projections of the rat temporal cortex: a Phaseolus vulgaris leucoagglutinin study. Neuroscience. 1993;57:697–715. doi: 10.1016/0306-4522(93)90016-9. [DOI] [PubMed] [Google Scholar]
- 53.Maura G, Giardi A, Raiteri M. Release-regulating d-2 dopamine receptors are located on striatal glutamatergic nerve terminals. J Pharmacol Exp Ther. 1988;247:680–684. [PubMed] [Google Scholar]
- 54.McDonald AJ, Mascagni F, Guo L. Projections of the medial and lateral prefrontal cortices to the amygdala: a Phaseolus vulgaris leucoagglutinin study in the rat. Neuroscience. 1996;71:55–75. doi: 10.1016/0306-4522(95)00417-3. [DOI] [PubMed] [Google Scholar]
- 55.McKernan MG, Shinnick-Gallagher P. Fear conditioning induces a lasting potentiation of synaptic currents in vitro. Nature. 1997;390:607–611. doi: 10.1038/37605. [DOI] [PubMed] [Google Scholar]
- 56.Morgan MA, LeDoux JE. Differential contribution of dorsal and ventral medial prefrontal cortex to the acquisition and extinction of conditioned fear in rats. Behav Neurosci. 1995;109:681–688. doi: 10.1037//0735-7044.109.4.681. [DOI] [PubMed] [Google Scholar]
- 57.Muller J, Corodimas KP, Fridel Z, LeDoux JE. Functional inactivation of the lateral and basal nuclei of the amygdala by muscimol infusion prevents fear conditioning to an explicit conditioned stimulus and to contextual stimuli. Behav Neurosci. 1997;111:683–691. doi: 10.1037//0735-7044.111.4.683. [DOI] [PubMed] [Google Scholar]
- 58.Nader K, LeDoux JE. Inhibition of the mesoamygdala dopaminergic pathway impairs the retrieval of conditioned fear associations. Behav Neurosci. 1999;113:891–901. doi: 10.1037//0735-7044.113.5.891. [DOI] [PubMed] [Google Scholar]
- 59.Ninan PT. The functional anatomy, neurochemistry, and pharmacology of anxiety. J Clin Psychiatry. 1999;[Suppl 22] 60:12–17. [PubMed] [Google Scholar]
- 60.O'Donnell P, Grace AA. Tonic D2-mediated attenuation of cortical excitation in nucleus accumbens neurons recorded in vitro. Brain Res. 1994;634:105–112. doi: 10.1016/0006-8993(94)90263-1. [DOI] [PubMed] [Google Scholar]
- 61.Pare D, Collins DR. Neuronal correlates of fear in the lateral amygdala: multiple extracellular recordings in conscious cats. J Neurosci. 2000;20:2701–2710. doi: 10.1523/JNEUROSCI.20-07-02701.2000. [DOI] [PMC free article] [PubMed] [Google Scholar]
- 62.Pare D, Gaudreau H. Projection cells and interneurons of the lateral and basolateral amygdala: distinct firing patterns and differential relation to theta and delta rhythms in conscious cats. J Neurosci. 1996;16:3334–3350. doi: 10.1523/JNEUROSCI.16-10-03334.1996. [DOI] [PMC free article] [PubMed] [Google Scholar]
- 63.Paxinos G, Watson C. The rat brain in stereotaxic coordinates, Ed 3. Academic; San Diego: 1997. [DOI] [PubMed] [Google Scholar]
- 64.Pitkanen A, Savander V, LeDoux JE. Organization of intra-amygdaloid circuitries in the rat: an emerging framework for understanding functions of the amygdala. Trends Neurosci. 1997;20:517–523. doi: 10.1016/s0166-2236(97)01125-9. [DOI] [PubMed] [Google Scholar]
- 65.Poremba A, Jones D, Gonzalez-Lima F. Classical conditioning modifies cytochrome oxidase activity in the auditory system. Eur J Neurosci. 1998;10:3035–3043. doi: 10.1046/j.1460-9568.1998.00304.x. [DOI] [PubMed] [Google Scholar]
- 66.Powell DA, Watson K, Maxwell B. Involvement of subdivisions of the medial prefrontal cortex in learned cardiac adjustment in rabbits. Behav Neurosci. 1994;108:294–307. doi: 10.1037//0735-7044.108.2.294. [DOI] [PubMed] [Google Scholar]
- 67.Quirk GJ, Armony JL, LeDoux JE. Fear conditioning enhances different temporal components of tone-evoked spike trains in auditory cortex and lateral amygdala. Neuron. 1997;19:613–624. doi: 10.1016/s0896-6273(00)80375-x. [DOI] [PubMed] [Google Scholar]
- 68.Rainnie DG, Asprodini EK, Shinnick-Gallagher P. Intracellular recordings from morphologically identified neurons of the basolateral amygdala. J Neurophysiol. 1993;69:1350–1362. doi: 10.1152/jn.1993.69.4.1350. [DOI] [PubMed] [Google Scholar]
- 69.Rogan MT, Staubli UV, LeDoux JE. Fear conditioning induces associative long-term potentiation in the amygdala. Nature. 1997;390:604–607. doi: 10.1038/37601. [DOI] [PubMed] [Google Scholar]
- 70.Rosen JB, Schulkin J. From normal fear to pathological anxiety. Psychol Rev. 1998;105:325–350. doi: 10.1037/0033-295x.105.2.325. [DOI] [PubMed] [Google Scholar]
- 71.Rosen JB, Hitchcock JM, Miserendino MJ, Falls WA, Campeau S, Davis M. Lesions of the perirhinal cortex but not of the frontal, medial prefrontal, visual, or insular cortex block fear-potentiated startle using a visual conditioned stimulus. J Neurosci. 1992;12:4624–4633. doi: 10.1523/JNEUROSCI.12-12-04624.1992. [DOI] [PMC free article] [PubMed] [Google Scholar]
- 72.Rosenkranz JA, Grace AA. Modulation of basolateral amygdala neuronal firing and afferent drive by dopamine receptor activation in vivo. J Neurosci. 1999;19:11027–11039. doi: 10.1523/JNEUROSCI.19-24-11027.1999. [DOI] [PMC free article] [PubMed] [Google Scholar]
- 73.Rosenkranz JA, Grace AA. Dopamine attenuates the ability of the prefrontal cortex to modulate sensory cortical inputs to basolateral amygdala neurons: in vivo intracellular and extracellular studies. Soc Neurosci Abstr. 2000;26:1726. [Google Scholar]
- 74.Savander V, Miettinen R, LeDoux JE, Pitkanen A. Lateral nucleus of the rat amygdala is reciprocally connected with basal and accessory basal nuclei: A light and electron microscopic study. Neuroscience. 1997;77:767–781. doi: 10.1016/s0306-4522(96)00513-1. [DOI] [PubMed] [Google Scholar]
- 75.Sawaguchi T, Yamane I. Properties of delay-period neuronal activity in the monkey dorsolateral prefrontal cortex during a spatial delayed matching-to-sample task. J Neurophysiol. 1999;82:2070–2080. doi: 10.1152/jn.1999.82.5.2070. [DOI] [PubMed] [Google Scholar]
- 76.Schneider F, Weiss U, Kessler C, Salloum JB, Posse S, Grodd W, Muller-Gartner HW. Differential amygdala activation in schizophrenia during sadness. Schizophrenia Res. 1998;34:133–142. doi: 10.1016/s0920-9964(98)00085-1. [DOI] [PubMed] [Google Scholar]
- 77.Selden NRW, Everitt BJ, Jarrard LE, Robbins TW. Complementary roles for the amygdala and hippocampus in aversive conditioning to explicit and contextual cues. Neuroscience. 1991;42:335–350. doi: 10.1016/0306-4522(91)90379-3. [DOI] [PubMed] [Google Scholar]
- 78.Sesack SR, Deutch AY, Roth RH, Bunney BS. Topographical organization of the efferent projections of the medial prefrontal cortex in the rat: an anterograde tract-tracing study with Phaseolus vulgaris leucoagglutinin. J Comp Neurol. 1989;290:213–242. doi: 10.1002/cne.902900205. [DOI] [PubMed] [Google Scholar]
- 79.Shi CJ, Cassell MD. Cortical, thalamic, and amygdaloid projections of rat temporal cortex. J Comp Neurol. 1997;382:153–175. [PubMed] [Google Scholar]
- 80.Shi CJ, Cassell MD. Perirhinal cortex projections to the amygdaloid complex and hippocampal formation in the rat. J Comp Neurol. 1999;406:299–328. doi: 10.1002/(sici)1096-9861(19990412)406:3<299::aid-cne2>3.0.co;2-9. [DOI] [PubMed] [Google Scholar]
- 81.Smith Y, Pare JF, Pare D. Cat intraamygdaloid inhibitory network: ultrastructural organization of parvalbumin-immunoreactive elements. J Comp Neurol. 1998;391:164–179. doi: 10.1002/(sici)1096-9861(19980209)391:2<164::aid-cne2>3.0.co;2-0. [DOI] [PubMed] [Google Scholar]
- 82.Smith Y, Pare JF, Pare D. Differential innervation of parvalbumin-immunoreactive interneurons of the basolateral amygdaloid complex by cortical and intrinsic inputs. J Comp Neurol. 2000;416:496–508. [PubMed] [Google Scholar]
- 83.Soares JC, Mann JJ. The anatomy of mood disorders-review of structural neuroimaging studies. Biol Psychiatry. 1997;41:86–106. doi: 10.1016/s0006-3223(96)00006-6. [DOI] [PubMed] [Google Scholar]
- 84.Somogyi P, Tamas G, Lujan R, Buhl EH. Salient features of synaptic organization in the cerebral cortex. Brain Res Rev. 1998;26:113–135. doi: 10.1016/s0165-0173(97)00061-1. [DOI] [PubMed] [Google Scholar]
- 85.Sugita S, Johnson SW, North RA. Synaptic inputs to GABAA and GABAB receptors originate from discrete afferent neurons. Neurosci Lett. 1992;134:207–211. doi: 10.1016/0304-3940(92)90518-c. [DOI] [PubMed] [Google Scholar]
- 86.Sugita S, Tanaka E, North RA. Membrane properties and synaptic potentials of three types of neurone in the rat lateral amygdala. J Physiol (Lond) 1993;460:705–718. doi: 10.1113/jphysiol.1993.sp019495. [DOI] [PMC free article] [PubMed] [Google Scholar]
- 87.Surmeier DJ, Bargas J, Hemmings HC, Nairn AC, Greengard P. Modulation of calcium currents by a D1 dopaminergic protein kinase/phosphatase cascade in rat neostriatal neurons. Neuron. 1995;14:385–397. doi: 10.1016/0896-6273(95)90294-5. [DOI] [PubMed] [Google Scholar]
- 88.Tebartz van Elst L, Woermann FG, Lemieux L, Trimble MR. Amygdala enlargement in dysthymia–a volumetric study of patients with temporal lobe epilepsy. Biol Psychiatry. 1999;46:1614–1623. doi: 10.1016/s0006-3223(99)00212-7. [DOI] [PubMed] [Google Scholar]
- 89.Tebartz van Elst L, Woermann FG, Lemieux L, Thompson PJ, Trimble MR. Affective aggression in patients with temporal lobe epilepsy: a quantitative MRI study of the amygdala. Brain. 2000;[Pt 2] 123:234–243. doi: 10.1093/brain/123.2.234. [DOI] [PubMed] [Google Scholar]
- 90.Teich AH, McCabe PM, Gentile CC, Schneiderman LS, Winters RW, Liskowsky DR, Schneiderman N. Auditory cortex lesions prevent the extinction of Pavlovian differential heart rate conditioning to tonal stimuli in rabbits. Brain Res. 1989;480:210–218. doi: 10.1016/0006-8993(89)91584-9. [DOI] [PubMed] [Google Scholar]
- 91.Uwano T, Nishijo H, Ono T, Tamura R. Neuronal responsiveness to various sensory stimuli and associative learning in the rat amygdala. Neuroscience. 1995;68:339–361. doi: 10.1016/0306-4522(95)00125-3. [DOI] [PubMed] [Google Scholar]
- 92.Washburn MS, Moises HC. Electrophysiological and morphological properties of rat basolateral amygdaloid neurons in vitro. J Neurosci. 1992;12:4066–4079. doi: 10.1523/JNEUROSCI.12-10-04066.1992. [DOI] [PMC free article] [PubMed] [Google Scholar]
- 93.Watanabe M. Prefrontal unit activity during delayed conditional Go/No-Go discrimination in the monkey. II. Relation to Go and No-Go responses. Brain Res. 1986;382:15–27. doi: 10.1016/0006-8993(86)90105-8. [DOI] [PubMed] [Google Scholar]
- 94.Willick ML, Kokkinidis L. Cocaine enhances the expression of fear-potentiated startle: evaluation of state-dependent extinction and the shock-sensitization of acoustic startle. Behav Neurosci. 1995;109:929–938. doi: 10.1037//0735-7044.109.5.929. [DOI] [PubMed] [Google Scholar]
- 95.Wright IC, Ellison ZR, Sharma T, Friston KJ, Murray RM, McGuire PK. Mapping of grey matter changes in schizophrenia. Schizophr Res. 1999;35:1–14. doi: 10.1016/s0920-9964(98)00094-2. [DOI] [PubMed] [Google Scholar]
- 96.Yang CR, Seamans JK. Dopamine D1 receptor actions in Layers V-VI rat prefrontal cortex neurons in vitro: modulation of dendritic-somatic signal integration. J Neurosci. 1996;16:1922–1935. doi: 10.1523/JNEUROSCI.16-05-01922.1996. [DOI] [PMC free article] [PubMed] [Google Scholar]
- 97.Zbrozyna AW, Westwood DM. Stimulation in prefrontal cortex inhibits conditioned increase in blood pressure and avoidance bar pressing in rats. Physiol Behav. 1991;49:705–708. doi: 10.1016/0031-9384(91)90306-9. [DOI] [PubMed] [Google Scholar]
- 98.Zhou FM, Hablitz JJ. Dopamine modulation of membrane and synaptic properties of interneurons in rat cerebral cortex. J Neurophysiol. 1999;81:967–976. doi: 10.1152/jn.1999.81.3.967. [DOI] [PubMed] [Google Scholar]
- 99.Zilles K, Wree A. Cortex: areal and laminar structure. In: Paxinos G, editor. The rat nervous system, Ed 2. Academic; Sydney: 1995. pp. 649–685. [Google Scholar]