B cells and T follicular helper cells mediate response to checkpoint inhibitors in high mutation burden mouse models of breast cancer (original) (raw)
. Author manuscript; available in PMC: 2020 Nov 14.
Published in final edited form as: Cell. 2019 Nov 14;179(5):1191–1206.e21. doi: 10.1016/j.cell.2019.10.028
Summary:
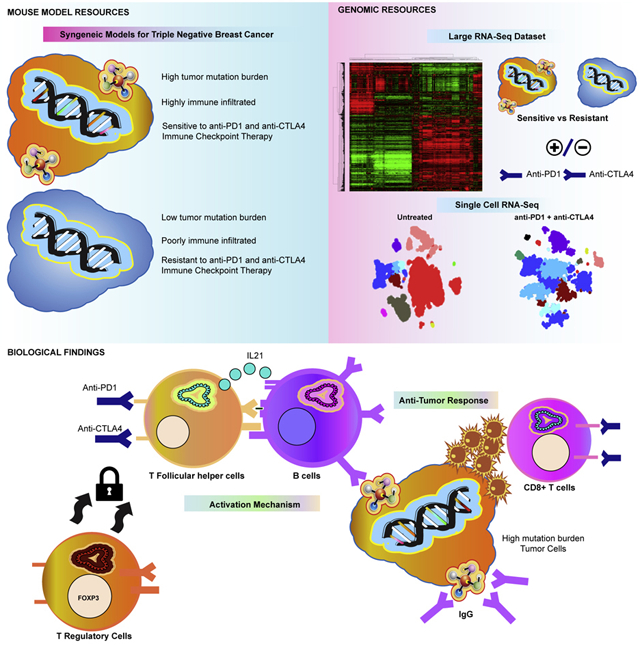
This study identifies mechanisms mediating response to immune checkpoint inhibitors using mouse models of triple negative breast cancer. By creating new mammary tumor models, we find that tumor mutation burden and specific immune cells associate with response. Further, we developed a rich resource of single cell RNA-seq and bulk mRNA-seq data of immunotherapy treated and non-treated tumors from sensitive and resistant murine models. Using this, we uncover immune checkpoint therapy induces T follicular helper cell activation of B cells to facilitate the anti-tumor response in these models. We also show B cell activation of T cells and generation of antibody as key to response and propose a new biomarker for immune checkpoint therapy. In total, this work presents resources of new preclinical models of breast cancer with large mRNA-seq and single-cell seq datasets annotated for sensitivity to therapy and uncovers new components of response to immune checkpoint inhibitors.
Graphical Abstract
Introduction
Immune checkpoint inhibitors (ICI) have improved patient outcomes in human cancers (Le et al., 2015; Sharma and Allison, 2015). In many solid tumors, tumor mutation burden (TMB), and as a result of high TMB, neo-antigen load are biomarkers for therapeutic benefit. For example, in colorectal cancers, mismatch-repair status predicted clinical benefit for the anti-PD1 antibody pembrolizumab(Le et al., 2015). In non-small cell lung cancer, a mutation signature linked to smoking predicted anti-PD1 efficacy (Rizvi et al., 2015). In melanoma, TMB and neoantigen load predict patient response to anti-CTLA-4 therapy (Van Allen et al., 2015). The presence of CD8+ T Cells(Tumeh et al., 2014) and expression of immune checkpoint genes such as the PD1 ligand (PD-L1) (Topalian et al., 2012) and CTLA-4(Herbst et al., 2014) also predict ICI efficacy. These data indicate that predicting response to ICI is multi-factorial and requires additional studies.
In triple negative breast cancer (TNBC), immune cells identified by pathology (i.e. TILs) or by genomic signatures, indicate a favorable prognosis(Iglesia et al., 2014; Miller et al., 2016) and chemotherapy efficacy is more likely in tumors with immune infiltrates (Nolan et al., 2017; Tsavaris et al., 2002). In addition to immune infiltration, TNBCs tend to harbor higher TMB amongst breast cancers. Recently, atezolizumab (an anti-PDL1 antibody) plus nab-paclitaxel was shown to prolong progression-free survival in TNBC patients with PD-L1 positive tumors(Schmid et al., 2018). With this success and FDA approval, ICI response rates still range from 10-20% (Wein et al., 2018) and atezolizumab’s impact on TNBC overall survival is modest. Given lessons from other cancer types, we hypothesized that TMB and immune cell infiltration could be important factors in response to ICI for TNBC.
In breast cancer, APOBEC3B enzyme activity is linked to mutagenesis of tumor genomes (Burns et al., 2013). APOBEC3B is a cytidine deaminase and upon activity creates abasic sites that lead to mutations (Morganella et al., 2016) and potentially neoantigens. Since mutation load predicts ICI response in other cancers (Rizvi et al., 2015; Van Allen et al., 2015) and APOBEC3B activity corresponds with higher TMB in breast cancer (Burns et al., 2013), we created two separate genetically engineered mouse models (GEMM) of mammary cancers with overexpression of murine APOBEC3. Similarly, we used short-wave ultra-violet radiation to create additional high TMB GEMMs. We refer to these lines with intentionally increased total mutation burden as “mutagenized lines” and the non-mutated version of each line as its “parental line”. Using these and other mouse models of TNBC in a pre-clinical trial of anti-PD1 and anti-CTLA4 therapy, we identify factors that mediate response to ICI including an important role for CD4+ T follicular helper cells (Tfh), B cells and the generation of antibody by those B cells in the anti-tumor response to dual ICI.
Results
Mouse Models and Genomic Signatures of Immune Cells.
To study the response to ICI and identify predictive biomarkers, we turned to a genetically controlled model system, namely a rich resource of credentialed mouse models of TNBC (Hollern et al., 2018; Pfefferle et al., 2016; Pfefferle et al., 2013). Figure 1 shows the key mRNA features for 290 specimens from multiple GEMMs. Within Tp53−/− and K14-Cre;Tp53f/f; Brca1f/f models, we selected transplantable sublines to establish a cohort for anti-PD1 and anti-CTLA4 combination therapy (aPD1/aCTLA4 = ICI; 7 models used for initial ICI testing). Our work here focused on experimentation predominately in two different GEMMs: Tp53−/− tumor syngeneic transplant derived cell line (T11), and a cell line from a K14-Cre;Tp53f/f; Brca1f/f tumor (KPB25L). Other treated GEMMs are listed in Table 1. These mouse models of TNBC represent multiple subtypes (i.e. basal-like and claudin-low (Parker et al., 2009; Pfefferle et al., 2013)) and show expression of signatures for CD4+ T cells, CD8+ T cells, B cells, and immunoglobulin G (IgG)(Figure 1). Diverse expression of immune checkpoint genes Pdcd1,Cd274 (Pd-l1), and Ctla4 was also noted in the 7 syngeneic transplantable murine lines used for testing ICI therapy.
Figure 1-. Intrinsic tumor and immune cell gene expression features in mouse mammary tumor models.

Gene expression patterns of tumor and immune cell features. The triangles mark the position of major tumor models in the heatmaps. Black bars mark tumor lines from each model. Blue bars to the side note models in the treatment study. Below this, blue bars show samples getting anti-PD1/anti-CTLA4 therapy. The heatmaps show median expression values for subtype and immune cell signatures. The lower heatmap is expression values of immune checkpoint mRNAs as shown by the color bar.
TABLE 1:
RESPONSE TO COMBINATION IMMUNOTHERAPY
| MODEL | GENETICS | SYBTYPE | Mutation Load | MEDIANSURVIVALUNTREATED | MEDIANSURVIVALaPD1/aCTLA4 | 10 DAYRESPONSEUNTREATED | 10 DAYRESPONSE aPD1/aCTLA4 |
|---|---|---|---|---|---|---|---|
| 2225L | TP53−/− | Basal-like | 11 | 10 days, n=15 | 9.5 days, n= 18 | 3951 ± 172, n=15 | 3098 ± 315, n=18 |
| 2336R | TP53−/− | Basal-like | 50 | 19 days, n=22 | 18 days, n=25 | 1319 ± 324, n=22 | 1372 ± 313, n=25 |
| 2224L | TP53−/− | Basal-like | 39 | 9 days, n=22 | 9 days, n=22 | 3108 ± 219, n=22 | 2905 ± 224, n=22 |
| 9263-3F | TP53−/− | Basal-like | 87 | 9 days, n=8 | 9 days, n=7 | 3868 ± 255, n=8 | 4123 ± 0, n=7 |
| 2153F | TP53−/− | Luminal-like | 57 | 12.5 days, n=18 | 11 days, n=17 | 2906 ± 312, n=18 | 3183 ± 282, n=17 |
| T11 | TP53−/− | Claudin low | 117 | 13 days, n=20 | 12 days, n=16 | 2149 ± 265, n=20 | 2721 ± 324, n=16 |
| T11-Apobec | TP53−/− ; Apobec3 overexpressed | Claudin low | 374 | 14 days, n=19 | 38 days, n=40* | 1782 ± 307, n=19 | 76 ± 37, n=40* |
| T11-UV | TP53−/− ; Short Wave UV exposure | Claudin low | 1783 | 11 days, n =12 | 25 days, n=16* | 2547 ± 356, n=12 | 452 ± 107, n=16* |
| KPB25L | K14-Cre; TP53 f/f Brca1 f/f | Basal-like | 181 | 21 days, n=17 | 28 days,n=13* | 1670 ± 383, n=17 | 260 ± 869, n=13* |
| KPB25L-Apobec | K14-Cre; TP53 f/f Brca1 f/f; Apobec3 overexpressed | Basal-like | 309 | 43 days, n=11 | 64 days, n=13* | 125 ± 30, n=11 | −12 ± 16, n=13* |
| KPB25L-UV | K14-Cre; TP53 f/f Brca1 f/f; Short Wave UV exposure | Basal-like | 316 | 37 days, n=26 | 74 days, n=26* | 230 ± 60, n=26 | −22 ± 7, n=26* |
Testing of GEMM of Mammary Cancer with Immune Checkpoint inhibitors.
Initial testing with aPD1/aCTLA4 therapy in TNBC GEMMs showed no response in 6/7 tumor lines (Table 1, Fig S1A). Resistant GEMMs had a low TMB (Fig S1B) and a low predicted neoantigen burden (Fig S1C). Murine tumors had lower TMBs than typically found in human breast cancer, and considerably lower than ICI responsive human NSCLC and melanomas (Fig S1D). The lone (moderately) sensitive model was a BRCA1 deficient tumor line (KPB25L) which had higher relative TMB. Thus, we posited that to accurately reflect the ICI response clinically, we needed to develop additional models that reflect the higher TMB of human cancers. Because Apobec3 is linked to mutagenesis of breast cancer(Burns et al., 2013), and immune cell infiltrates (Budczies et al., 2018; Smid et al., 2016; Wang et al., 2018), we hypothesized that Apobec3 could elevate the mutation load and number of predicted neoantigens, possibly sensitizing a previously resistant GEMM tumor to ICI therapy. Similarly, we hypothesized exposure to ultra violet (UV) radiation in could lock in new mutations to create high TMB models and improve ICI sensitivity. Indeed, Apobec3 over-expression (T11-Apobec, KPB25L-Apobec, Fig 2A) and UV exposure (T11-UV, KPB25Luv, Fig 2B) markedly increased TMB as compared to the matched time-in-culture parental cell lines (T11, KPB25L). As expected, having a higher TMB also led to a higher predicted neoantigen load in MHC haplotype compatible lines (Fig S1C).
Figure 2-. Intentional elevation of tumor mutation burden sensitizes tumors to anti-PD1/anti-CTLA4 combination therapy.

(A) Left: Total somatic mutation burden in ectopic Apobec3 overexpressing lines and parental control lines. Right: somatic mutation burden from parental lines and lines exposed to short-wave ultra violet radiation. (B) Survival and 10 day acute response to anti-PD1/anti-CTLA4 immune checkpoint therapy in mice bearing tumors from parental T11 cell line and KPB25L cell lines. (C) Survival and acute response in T11-Apobec and KPB25Luv lines. (D) Immune cell gene expression signature expression levels. (E) Immune checkpoint gene mRNA expression levels. (F) Left, interferon gamma signature expression levels. Right, serum interferon gamma as measured by ELISA. In boxplots, bars mark the average and standard deviation. The p-values mark are two-tailed from unmatched T-tests. In Kaplan-Meier plots, p-values are from Log-rank (Mantel-Cox) tests. Signature levels are calculated as median value of genes within and mRNA is the median centered Log2 expression level.
In support of the TMB/neoantigen hypothesis of ICI responsiveness, the parental lines showed little sensitivity to anti-PD-1/anti-CTLA-4 therapy (Fig 2B) while the mutagenized lines had robust responses (Fig 2C, Fig S1E). The response data for all sensitive and resistant lines is shown in Fig S1 and Table 1. Table S1 lists hazard ratios for every survival endpoint in this report. We also tested single agent anti-PD-1 and anti-CTLA-4 and noted while sometimes effective, single ICIs where inferior to combinations (Fig S1F). Testing isotype controls confirmed that response to therapy was not driven by the presence of exogenous IgG2a or IgG2b antibodies (Fig S1G), consistent with the lack of any therapeutic effect in resistant lines. As controls, Apobec3 overexpression and UV-based mutagenesis strategies did not impact proliferation in vitro (Fig S2). As a whole, these results signify TMB as a key marker for ICI efficacy in the murine TNBC models tested here.
Genomic Analysis of ICI Treated GEMM tumors.
To test for additional predictors of response to ICI therapy, we examined pretreatment tumors (5mm in diameter) from sensitive and resistant models with mRNA-seq. Published mRNA signatures for CD4+ T cells(Newman et al., 2015), CD8+ T cells(Fan et al., 2011), B cells(Iglesia et al., 2014), and IgG (Fan et al., 2011) each correlated with response (Fig 2D). Levels of immune checkpoint genes Pdcd1 and Ctla4 (Fig 2E), as well as interferon-gamma (serum and tumor, Figure 3C), were also significantly higher in sensitive tumors. Thus, we hypothesized that our mRNA-seq data may enable the development of new mRNA-based biomarkers. We therefore performed supervised analyses to derive signatures differentiating sensitive from resistant tumors. Given that functionally related genes often covary, we used hierarchical clustering and SigClust (Huang et al., 2015) to identify metagenes of statistical significance and probable biological meaning(Fig 3A and supplemental file 1). This identified a large cluster of immune cell genes (immune activity cluster) and a smaller node of B cell genes, IgGs, and T cell genes (Fig S3A) that is henceforth referred to as the B cell / T cell co-cluster.
Figure 3-. Signature testing on human studies.

(A) Signature development pipeline. The immune activity signature is noted by the blue bar near the heatmap. The B cell/T cell co-cluster is marked by the purple bar and featured. (B) Boxplot for the B cell/T cell co-cluster in pretreatment samples from a human melanoma study of anti-CTLA4 therapy(Van Allen et al., 2015). (C) Boxplot of the B cell/T cell co-cluster in pretreatment samples from a human melanoma study of anti-PD1/ anti-CTLA4 therapy (Sade-Feldman et al., 2018). (D) Boxplot of the B cell/T cell co-cluster in pretreatment breast cancer samples from CALGB40601, trastuzumab arm (Tanioka et al., 2018). (E) Boxplot of the B cell/T cell co-cluster in pretreatment samples from the human breast cancer dataset GSE32646, P-FEC = neoadjuvant paclitaxel followed by 5-fluorouracil/epirubicin/cyclophosphamide(Miyake et al., 2012). (F) Boxplot of the B cell/T cell co-cluster in pretreatment samples from the human breast cancer iSPY clinical trial; A/C/T arm = Doxorubicin hydrochloride and cyclophosphamide, followed by treatment with paclitaxel(Esserman et al., 2012). (G) Boxplot of the B cell/T cell co-cluster in pretreatment samples from the TNBC NCT 01560663 clinical trial(Echavarria et al., 2018). Boxplots mark the mean and standard deviation. All panels except C, the p-values show two-tailed p-value from standard T-tests; in panel C the data is non-gaussian and thus a Mann-Whitney test was used.
Human Patient Studies.
To test the clinical value of these two new genomic signatures, we used published data from multiple human clinical studies. This included two melanoma datasets of patients treated with ICI (Sade-Feldman et al., 2018; Van Allen et al., 2015), three human breast cancer datasets from clinical trials of neoadjuvant chemotherapy (Echavarria et al., 2018; Esserman et al., 2012; Miyake et al., 2012), and one human breast cancer dataset that is a clinical trial of neoadjuvant trastuzumab + paclitaxel (Tanioka et al., 2018). In each dataset the B cell / T cell co-cluster was significantly higher in pretreatment samples from patients that responded to therapy (Fig 3 B-G). Similar results were noted for the immune activity cluster (Fig S3B-G), however, one exception was seen in the human melanoma dataset that used single cell profiling of CD45+ cells, where the immune activity cluster was not predictive, but the B cell / T cell co-cluster was. Given that equal numbers of CD45+ cells were profiled in responder and non-responder groups, similar expression of the generic immune activity cluster was expected. Thus, when examining even numbers of total immune cells, higher representation of B cell populations seems to predict response in human breast and melanoma tumors.
Immune Cell Response to Therapy.
To test whether these immune cell features are also activated by ICI therapy, we examined tumors after 7 days with or without ICI therapy using mRNA-seq. No significant changes were seen in immune signatures for resistant tumors. In sensitive lines treated with ICI, mRNA-seq again identified significant elevation in CD4+ T cells, CD8+ T cells, B cells, and IgG signatures (Fig 4A). Flow cytometry analysis confirmed T cell signatures and revealed expanded CD8+ and CD4+ effector memory T cells with therapy in sensitive models (Fig 4B). Flow cytometry also verified B cell signatures, with anti-PD1/anti-CTLA4 treated tumors presenting a striking increase in activated B cells (Fig 4C,D). Strong concordance between mRNA-seq and flow cytometry was also seen within each tumor model (Fig S4A-C). The IgG signature predicted the potential for B cell class-switching and antibody responses. To confirm this prediction, we first used IHC. Indeed, IHC showed that ICI increased the number of IgG-positive cells within the tumor (Fig 4E). To test secretory antibody activity, we examined serum IgG binding to cells kept in vitro. Here, we noted a significant increase in IgG binding against KPB25Luv cells in ICI treated mice (Fig 4F), with specificity marked by low off target binding (Figure 4G). Additional tests implied a possible IgG target(s) specific to the mutagenized line, as well as a shared target(s) with the parent line (Fig S4D). Treatment also increased serum IgG specific to tumor cells in the T11-Apobec model (Fig 4H). Finally, ICI did not substantially increase T cells in T11 parental tumors (Fig S4E). High CD8 to T regulatory cell (T regs) ratios were exclusive to mutagenized tumors (Fig S4F), suggesting mutations/neoantigens as key to the release of immune-suppression and a shift towards a productive anti-tumor response featuring activated T cells and B cells.
Figure 4-. Features of response to anti-PD1/anti-CTLA4 therapy in murine tumors.

(A) RNA-seq signatures for sensitive tumors at 7 days (5mm= day 0/ treatment initiation) without or with anti-PD1/anti-CTLA4 therapy. (B) Flow cytometry results for CD8+ cells and CD4+ using memory markers (Cd44, Cd62L). (C) Flow cytometry of tumor infiltrating B cells with or without ICI therapy. On the right shows staining for B cells gated for activation markers. (D) Quantification of flow cytometry for activated B cells (B220+, Cd19+ or Cd20+, MHC II +, Cd80+ or Cd86+). (E) IHC staining for IgG-kappa chain in KPB25Luv tumors. (F) IgG binding assay showing serum-IgG binding (Fitc+) to KPB25Luv cells. (G) Quantification of Fitc+ cells in IgG binding assay for KP25Luv cells and off-target binding. (H) Quantification of Fitc+ IgG binding assay for T11-Apobec cells following reabsorption on off-target cells. In boxplots, bars signify the mean and standard deviation. The p-values are two-tailed from unmatched T-tests. All tumors collected after 7days of treatment or non-treatment.
Single Cell mRNA-seq.
To precisely define the responding T cell and B cell subsets, we examined KPB25Luv (Fig 5) and T11-Apobec (Fig S5) tumors after 7 days with or without ICI using single cell RNA-seq (scRNA-seq). Untreated tumors had an abundance of tumor cells, neutrophils, and macrophages, with a variety of other cell types present at lower frequencies (Fig 5A; S5A). With aPD1/aCTLA4 therapy, prominent changes in the distribution of cell types identified were noted. In particular, tumor cells, neutrophils, macrophages were reduced while T cells and B cells were expanded (Fig 5A,B; S5A,B). In addition, a plasma cell cluster was identified and unique to treated tumors. Changes in these cell types were also reflected in supervised analyses comparing tumors with and without therapy (Fig 5C; S5C).
Figure 5-. Single cell RNA-seq of KPB25Luv tumors with or without anti-PD1/anti-CTLA4 therapy.

(A) TSNE analysis of cells that passed quality checks in KPB25Luv tumors. Cells/clusters are color coded by the major cell type found.(B) The distribution of cell types between treated and non-treated tumor cells. (C) Heatmap of mRNA variance between treated and non-treated tumor cells. (D) Violin plot of Cd8a mRNA levels. (E) Heatmap of significant genes (plus Pdcd1, Ctla4) in clusters of ICI treated CD8+ T cells. (F) Classification of ICI treated CD8+ T cell clusters. Classes are coded to the heatmap in E. (G) Feature plot showing expression of key genes across CD8+ T cell clusters. (H) Violin plot of Cd4 mRNA levels. (I) Heatmap of significant genes(plus Ctla4) in clusters of ICI treated CD4+ T cells (n=20) (J) Classification of ICI treated CD4+ T cell clusters. Classes are coded to the heatmap in I. (K) Feature plot showing expression of key genes across CD4+ T cell clusters. (L) Violin plot of Cd20 mRNA levels.(M) Heatmap of significant genes in clusters of ICI treated B cells (n=20). (N) Classification of ICI treated B cell clusters. Classes are coded to the heatmap in M. (O) Feature plot showing expression of key markers in B cell clusters. (P) Results of 5’ TCR/BCR sequencing. In bar-plots, read counts for each clone is shown along with the calculated Shannon entropy (where higher values indicate high diversity/low clonality). Above each bar, the percent of all reads occupied by a clone(s). Heatmap values are depicted in the legend. Violin plots mark the mean and SEM. Markers were identified using Seurat and Wilcoxon rank sum testing.
In both GEMMs tested, effector memory CD8+ T cells were expanded by therapy. Accordingly, scRNA-seq showed significantly higher abundance of cells with Cd8a expression (Fig 5D; S5D). Significance testing of ICI treated CD8+ clusters revealed proliferation and cytotoxic genes as increased in CD8+ T cell subsets (Fig 5E; S5E). Among cells with cytotoxic gene expression profiles, cells with high expression of checkpoint/exhaustion markers Eomes, Pdcd1, Ctla4, Lag3, and Tim3 were frequent(Fig 5G; S5G)(Wherry and Kurachi, 2015). We also noted CD8+ subsets that were unique to KPB25Luv tumors, with one having high expression of Eomes and another with high Ccr10 mRNA (Fig 5E-G). The Ccr10 high CD8+ T cells were also marked by expression of Cxcr3 and genes involved in cell migration, which is indicative of T cells trafficking to sites of inflammation(Eksteen et al., 2006; Qin et al., 1998). High EOMES and PD1 with low T-BET (TBX21) is known to mark terminal exhaustion and minimal capacity to respond to ICI(Pauken et al., 2016). Yet, the Eomes high CD8+ T cell cluster in KPB25Luv tumors lacked high Pdcd1 expression and had moderate Tbx21 levels. Together, these data show the CD8+ T cells to contain proliferating and cytotoxic effector memory cells.
Cells expressing Cd4 mRNA were significantly increased with ICI therapy (Fig 5H, S5H). Examining treated sensitive tumors, differentially expressed genes amongst CD4+ clusters identified T cells with high expression of proliferation genes (Fig 5I, S5I). This analysis also identified a large group of Tregs mixed with naive-like subsets in T11-Apobec. In contrast, Tregs were distinct from other CD4+ subsets (Fig 5A) in the KPB25Luv model. Marker analysis also identified significant genes for a cluster of CD4+ cells resembling T follicular helper cells (Tfh; Fig 5I; S5I). This included well known markers such as Cxcr5, Cd154 (Cd40l), Pdcd1,Maf, and Il21 (King, 2009). These Tfh-associated genes showed a clear distinction between the Naïve and Tfh-like clusters in KPB25Luv (Fig 5 I-K). Similar results were found in T11-Apobec, adding that Tfh-like cells were also present in the proliferating group. With Pdcd1, many of the Tfh-like cells also had high expression of Ctla4. Collectively, these data depict the dominant effector memory subset of CD4+ T cells to be T follicular helper cells.
Markers for B cells were also associated with ICI therapy in scRNA-seq (Fig 5L; S5L) and depicted various stages of B cell activation in treated sensitive tumors (Fig 5/S5 M-O) . For example in KPB25Luv tumors, B cells were separated on the B cell receptor (BCR) isotype. Non-class switched B cells had high expression of MHC class II genes and other activation markers. Class-switched B cells were marked by high expression of proliferation genes, Aicda, and Ighg1 (and low Ighd); thus, these B cells resemble those class-switched B cells undergoing somatic hypermutation. While this cluster was not detected in T11-Apobec, probing for these genes identified these cell types amongst the B cells present in this tumor model. Both models showed a distinct cluster of cells with gene expression profiles matching that of plasma cells. These cells were marked by high expression of IgG (Ighg1, Ighg3), which indicates class switching and the dominant antibody types induced by ICI.
TCR/BCR Clonality
To understand the selectivity of the T cell and B cell response, we used 5’ RACE-like sequencing to measure BCR and TCR (T cell receptor) clonality in ICI treated KPB25Luv (Fig 5P) and T11-Apobec (Fig S5P) tumors. Perhaps related to differences noted by scRNA-seq, T cells in T11-Apobec were more clonally restricted than KPB25Luv. In fact, the top three clones in T11-Apobec (Shannon entropy= 4.22) accounted for 40% of TCR-alpha expression compared to 14% in KPB25Luv (Shannon entropy = 5.58) tumors; TCR-beta sequences matched these trends. Assessing BCR diversity, both models were clonal. The top clone of the heavy chain (BCR-H) alone made up 41% of sequences in KPB25Luv (Shannon entropy=2.05) and 54% of BCR-H sequences in T11-Apobec (Shannon entropy= 2.18). Light chain mRNA also showed a high degree of clonal restriction (BCR lambda, Shannon entropy KPB25Luv = 0.68; T11-Apobec = 1.75). Collectively, these data show significant evidence of immune adaptive cell clonal selection.
Role of B cells and T cells in Response to ICI in murine models.
The B cell/T Cell co-cluster signature predicted ICI response in human cancers and both B cells and T cells showed robust expansion following therapy. Thus, it was critical to test whether these cell types were essential to ICI efficacy in our in vivo models. Hence, we individually depleted CD4+ T cells, CD8+ T cells, or B cells using antibodies (Fig S6) during anti-PD1/anti-CTLA4 therapy. In each case, depletion of these populations (i.e. CD4+, CD8+, CD19+, CD20+) significantly reduced the therapeutic response to anti-PD1/anti-CTLA4 therapy as assessed by survival (Fig 6A,C) and short term response (i.e. tumor volume changes (Fig 6B,D). Most prominent effects were observed in the CD4+ T cell depleted mice and B cell inhibited/depleted mice (CD19 or CD20 respectively), where therapeutic benefit was completely ablated.
Figure 6-. Immune cell depletion of key immune cell populations during immune checkpoint therapy.

(A) Survival for mice given anti-PD1/anti-CTLA4 therapy with anti-Cd4 or anti-Cd8 antibodies (B) 21 day acute response for mice given anti-PD1/anti-CTLA4 with anti-Cd4 or anti-Cd8 antibodies. (C) Survival for mice given anti-PD1/anti-CTLA4 therapy with anti-Cd19 or anti-Cd20 antibodies (D) 21 day acute response for mice given anti-PD1/anti-CTLA4 with anti-Cd19 or anti-Cd20 antibodies. (E) Flow cytometry results for T cell subsets after 7days of aPD1/aCTLA4 therapy with/without anti-CD19 based B cell inhibition. In Kaplan-Meier plots, p-value show results of Log-rank (Mantel-Cox) tests. Boxplots show the mean and standard deviation. The p-values are two-tailed from unmatched T tests.
B cells are known to present antigens to T cells(Hong et al., 2018; Nelson, 2010), prompting us to test the impact of B cell activity on T cells. Interestingly, both CD8+ and CD4+ T cells were reduced by B cell inhibition (Fig 6E). In CD8+ subsets, the effector and effector memory T cells were reduced. In the CD4+ T cells, effector memory and central memory subsets were diminished by B cell inhibition. Together, these data indicate the generation of T cell memory is in part dependent on the function of B cells.
Our B cell/T cell co-cluster also suggested that B cell activity may be similarly dependent on T cells. Indeed, CD4+ T cells are known regulators of B cell activity(Clark and Ledbetter, 1994). To formally test this, we first tested if CD4+ T cell depletion impacted B cell infiltration and activation during ICI therapy by flow cytometry. ICI treated tumors depleted for CD4+ T cells resembled non-treated tumors (Fig 7A), showing minimal B cell infiltration in the tumor (Fig 7B). As such we sought to identify which CD4+ subset was involved in the mechanism of B cell activation. To predict the CD4+ cell type activating B cells, we used the bulk mRNA-seq and scRNA-seq data. Published signatures for Th1 (Fig S7A) and Th2 (Fig S7B) subsets did not correlate with B cell signatures nor show elevation with therapy in mRNA-seq data in sensitive models. Similarly, Th1, Th2, and Th17 cytokines were rarely expressed the scRNA-seq transcriptome data suggesting that these cells are not commonly found in ICI treated tumors (Fig S7C,D). However, published signatures for T follicular helper cells strongly correlated (p<0.0001) with B cell signatures in mRNA-seq of ICI sensitive tumors (day 7, Fig 7C) and were significantly elevated upon aPD1/aCTLA4 therapy (Fig 7D). Similar results were found for the Tfh cytokine IL-21 (if protein, Il21 if gene) (Fig 7E,F). This is consistent with scRNA-seq data (Fig 5/S5 I-K), showing increased expression of IL21 and a large cluster of cells with Tfh-like expression profiles present with ICI therapy.
Figure 7-. Testing B Cell Activation and IgG Functionality during immune checkpoint therapy.

(A) Flow cytometry for B cells in KPB25Luv tumors after 7 days of ICI and CD4+ T cell depletion. (B) Quantification of results from A. (C) X-Y plot of IgG and CIBERSORT Tfh T cell signatures in mRNA-seq of sensitive tumors at day 7. (D) Boxplot of CIBERSORT Tfh T cell signature levels in sensitive tumors (mRNA-seq) at day 7. (E) X-Y plot of IgG signature and Il21 mRNA in mRNA-seq of sensitive tumors at day 7. (F) Boxplot of Il21 mRNA levels in sensitive tumors (mRNA-seq) at day 7. (G) Flow cytometry results for activated B cells in T11-Apobec & KPB25Luv tumors during Tfh/IL21 blockade. (H) IHC staining for IgG-kappa chain in KPB25Luv tumors during Tfh/IL21 blockade. (I) Survival for T11-Apobec bearing mice during ICI therapy and Tfh/IL21 blockade. (J) Survival for KPB25Luv bearing mice during ICI therapy and Tfh/IL21 blockade. (K) Western blot for serum IgG in Igmi and Balbc mice with T11-Apobec tumors. The blue bars mark Igmi mouse sera, purple note Balbc sera. (L) 21 day acute response in Igmi and Balbc control mice with T11-Apobec tumors. (M) Survival of Igmi mice withT11-Apobec tumors and treated with anti-PD1/anti-CTLA4 therapy in contrast to Balbc controls. (N) Survival in KPB25Luv tumor bearing mice treated with ICI therapy or ICI therapy with CD16/32 blockade . In Kaplan-Meier plots, p-values are from Log-rank (Mantel-Cox) tests. Boxplots show the mean and standard deviation. The p-values are two-tailed from standard T-tests. In X-Y plots, p-values were determined by linear regression analysis. The asterisks denote significance (***, p<0.0001, *, P<0.05).
To test if B cell activation by ICI therapy was reliant on Tfh cells, we used antibodies against IL21 to neutralize Tfh activity (Vogelzang et al., 2008). IL21 blockade during aPD1/aCTLA4 therapy significantly reduced B cell activity in both KPB25Luv and T11-Apobec tumors (Fig 7G, Fig S7E,F). Given that IL21 is known to support class switching and plasma cell generation, we also examined IgG staining by IHC. This revealed that blocking IL21 during ICI therapy sharply reduced the number of IgG+ cells ( Fig 7H, S7G). These data indicate a critical role for the activity of Tfh cells in the generation of antibody after dual ICI. TNBC are often infiltrated with regulatory T cells (Tregs) which may be critical to inhibiting the adaptive immune response. As the function of Tregs is somewhat dependent on regulatory CTLA-4 signaling (Peggs et al., 2009) we wondered whether blocking Treg activity may explain the additive effect of combining aPD1 and aCTLA4 on B cell activation (Fig S4A,B). Thus, we used a mouse model where FOXP3+ cells (Tregs) can be specifically and temporally ablated by diphtheria toxin (Taylor et al., 2017) to test their impact on B cell activation. As suspected, ablation of FOXP3+ cells increased the presence of activated B cells (Fig S7H). Together, these data imply that the optimal B cell activity and therapeutic benefits coming from aPD1/aCTLA4 therapy correlated with concurrent Treg inhibition and Tfh activation. To test the importance of Tfh / IL21 activity for ICI benefit, we examined response of mice given aPD1/aCTLA4 therapy with IL21 blockade. This markedly diminished the anti-tumor response (Fig S7I,J) and survival in KPB25Luv (Fig 7I) and T11-Apobec (Fig 7J) tumors. As a whole, these data indicate Tfh cells to be critical to ICI efficacy by activating B cells to amplify the anti-tumor immune response.
B cell activation by ICI therapy also led to the generation of class-switched plasma cells (IgHg1 and IgHg3; Fig 5/S5 M-O), and tumor specific serum IgG increased following therapy. Moreover, IgG genes were a central part of our highly predictive B cell/T cell signature. This implied that production of IgG against tumor cells was important in mediating response to ICI. To test this, we utilized a novel mouse model (IgMi; (Waisman et al., 2007) that is immune-intact where B cells can be activated but are incapable of antibody secretion (verified in Fig 7K, S8K). Remarkably, the loss of antibody secretion during ICI therapy diminished the initial anti-tumor response (Fig 7L) and survival (Fig 7M) in T11-Apobec bearing mice. As IgMi mice are not available on a FvB background we used neutralizing anti-CD16 mAb to evaluate the role of secretory Ig in the KPB25Luv model (Turner et al., 2017), (Fig S7L,M). This also led to diminished responses to ICI therapy when assessed by overall survival (Fig 7N). These data for the first time indicate a critical role for antibody secretion in the function of ICI therapy.
DISCUSSION
Identifying predictive biomarkers for human cancer patients is critically important for improvements in immunotherapy, and are the foundation of precision medicine. GEMM of human cancers are often used to investigate the mechanistic impact of specific genetic alterations, but in general, have yielded few clinically relevant biomarkers. The lack of public genomic data on ICI-treated human TNBC limited our human-to-mouse TNBC comparisons. Thus to seek translational evidence, we tested our possible biomarker for ICI therapy response on multiple clinical datasets covering a number of different therapeutic settings, and cancer types.
This study provides a robust genomic data set, and novel syngeneic murine tumor resource, for further investigations into the immune microenvironment using a reproducible and genetically controlled animal model system. In particular, we have created a new set of transplantable TNBC mouse model tumors that have high TMB and are sensitive to ICI therapies. It was necessary to develop these new “mutagenized” models for studying immunotherapy in TNBC as the majority of GEMM mammary tumor models were resistant and had TMB much lower than typically present in human breast tumors. As stated, these mutagenized GEMMs are uniquely immune activated and therefore will be ideal for future studies of immune cell dynamics and testing novel immunotherapies. In addition, we provide a unique resource of mRNA-seq and scRNA-seq data with FACS validated changes in immune features.
Our ICI responsive “mutagenized” models came from genomically credentialed Tp53−/− (Jerry et al., 2000) and K14-Cre;Tp53f/f; Brca1f/f (Hollern et al., 2018) GEMMs that parallel human TNBC in somatic mutations, copy number changes, and gene expression profiles(Herschkowitz et al., 2012; Hollern et al., 2018; Pfefferle et al., 2016). While mutation sharing in TNBCs is low amongst human breast cancer patients (Network, 2012), save for a few drivers such as TP53 and BRCA1, we did aim to mimic human breast cancer mutagenesis with our use of our BRCA1-deficient and APOBEC3 overexpression models. While UV-induced high TMB does not mimic the typical means for breast cancer mutagenesis, it is not evident in the clinical data that the process leading to increased TMB is as critical to ICI response as the presence of high TMB. Indeed, smoking, UV, Apobec, and homologous recombination deficiency mutation signatures were tested across KEYNOTE trial patients and showed no value over TMB alone in the ability to predict ICI benefit (Cristescu et al., 2018). In agreement, the means to obtain high TMB did not relate to response in our GEMMs; namely APOBEC3 or UV induced high TMB, and this created higher sensitivity in both GEMMs. Yet, more studies are needed to clarify if mutational process impacts ICI response.
While our two GEMMs had many similarities, we also noted differences between the various mutagenized lines corresponding to the parent model (T11 vs KPB25L), which may be linked to contrasts in their TNBC subtypes (claudin-low vs basal-like). In particular, KPB25Luv and T11-Apobec models differed in their responsiveness to single agent ICI. In KPB25Luv tumors, individual aPD1 or aCTLA4 were equally effective in activating B cells and the anti-tumor immune response. However, in T11-Apobec, aCTLA4 was clearly more effective in eliciting B cell activation and therapeutic response. Given that CTLA-4 signaling is critical to the function of Tregs(Peggs et al., 2009), we believe this to be related to the critical role of Tregs in suppressing the immune response which is intrinsic to T11 tumors via tumor cell CXCL12 secretion (Taylor et al., 2017), This appears to be a general feature found in the claudin-low subtype. Indeed, genetic ablation of Tregs in T11-Apobec was sufficient to induce increased B cell activation (Fig S7H). Variances in these models were also noted for CD8+ subsets and T cell clonality. Collectively, these differences in GEMMs add resource value, where individual models can be selected for growth rate, high or low ICI sensitivity, or composition of the microenvironment.
Demonstrating the utility of the resources presented here, we have used these models to identify a new component of response to ICI therapy involving B cells and Tfh cells. Importantly, our findings here are distinct from prior findings detailing PD1 activity in B cells (Thibult et al., 2012; Wang et al., 2019). For example, Thibult et al described aPD1 antibodies directly activating B cells that had high PD1 expression. This mechanism was shown to be T cell independent and exclusive to peripheral B cell subsets. In addition, the authors noted that they did not observe any impact by aPD1 on production of class-switched antibody. In the Wang et al study, the authors show that PD1 high B cells functionally suppress T cell activity and suggest these B cells as an unique B regulatory cell subset. In contrast to the above studies, the B cell subsets in our tumor models did not show expression of Pdcd1 or express markers of B regulatory cells. Further, B cell activation by ICI was dependent upon Tfh cell function and resembled those occurring in germinal center B cells. Finally, B cell activation by ICI in our models was tied to increased class-switched antibody (IgG) production and activation of T cell subsets as indicated by diminished numbers of memory T cells following B cell inhibition. Thus, our study reveals a distinct mechanism B cell activation while further uncovering the necessity of B cell and Tfh cell subsets in mediating ICI-induced anti-tumor responses.
Our findings also add context to prior studies showing B cells as prognostic in many cancers (Iglesia et al., 2016; Nzula et al., 2003; Shen et al., 2018). Here we extend prognosis to therapeutic response with a new predictive gene signature. Building on these predictions, our study demonstrates B cells to be essential and multifunctional in ICI driven antitumor responses via secreting antibody and helping T cell responses. The impact of B cell inhibition upon T cells is likely due to antigen presentation, as both central and effector memory CD4+ subsets were impacted by inhibiting B cell function . This reduced CD4+ T cell activity potentially explains the reduction in CD8+ T cells, which rely on CD4+ cells for activation and proliferation. Given the reduced efficacy of ICI after depletion of T cell subsets, antigen presentation to amplify immune responses is likely a key function of B cells.
In addition to support of T cells, antibody generation by B cells was also key to ICI response in our GEMMs. Secreted IgG can elicit cytotoxicity by several mechanisms such as complement or cellular cytotoxicity mediated by Fc-receptor activation (Vidarsson et al., 2014). These functions likely explain the loss of ICI efficacy we observed when using an Ig secretory deficient mouse model, or by blocking antibody activity using anti-CD16. The clonal restriction observed in BCR/IgG repertoire profiling, and serum IgG binding assays, imply the antibodies induced by ICI to be specific to model antigens. Together, these results depicting B cell mediation of antitumor responses through T cell activation and antibody generation presents B cells (as well as Tfh cells) as an attractive cellular target to be leveraged to improve ICI therapy effectiveness.
Collectively, this study uncovers B cells and Tfh T cells as direct mediators of ICI response in our mouse models, and possibly in humans as well. Of note, scRNA-seq predicted a role for IL21 in B cell activation. While scRNA-seq may not prove which cytokines/receptors mediate a biological process, our follow up studies verified that ICI induction of IL21 and Tfh cells activated B cells and class switching. Indeed, our analysis suggest these mechanisms may also extend to chemotherapy in TNBC patients, and to trastuzumab response in HER2+ breast cancer patients. Moreover, our group has formerly noted that B cells are predictive of trastuzumab response(Tanioka et al., 2018). Taken together, these findings suggest the importance of the immune system across multiple distinct classes of anti-cancer agents, and cancer types, and where the active and coordinated engagement of both B cells and T cells portends good patient outcomes.
STAR METHODS
Lead Contact and Materials Availability
Further information and request for materials may be directed to the corresponding author Charles M Perou. (cperou@med.unc.edu). Key reagents and tumor lines are available and can be obtained by contacting Charles M Perou. (cperou@med.unc.edu).
Experimental Model and Subject Details
Animal work
All animal work was conducted according to IACUC guidelines. All mice were allowed to mature to 12 weeks prior to injection. All tumor studies used female mice. FVB and Balbc mice were ordered from Jackson Laboratories. Tumor transplants were syngeneic; KPB25L parental and mutagenized lines were orthotopically injected in FVB recipients and TP53−/− models (see Table 1) were orthotopically injected into Balbc recipients. To determine endogenous IgG functionality, mice genetically engineered to be deficient in Ig secretion (Igmi mice) were used with T11-Apobec tumors(Waisman et al., 2007). Mice were bred to homozygosity; genotyping primers: 5’GAGACGAGGGGGAAGACATTTG3’,5’CCTTCCTCCTACCCTACA AGCC3’. Injections were done as single cell suspensions of approximately 100,000 cells in Matrigel to the number four mammary gland. KPB25L, KPB25Luv, KPB25L-Apobec, T11, T11-UV, and T11-Apobec exist as cell lines. Parental lines are derived from transplantable tumors, which are present in the Figure 1 cluster analysis. Other models are tumor transplant lines and were digested with the Miltenyi tumor dissociation kit to establish cell suspensions (130-096-730). Mice were examined 2-3 times weekly for tumor outgrowth and upon tumor diameter of 5mm, mice were randomly assigned to treatment or control groups. Caliper measurement continued at a 2-3 per week frequency until end-stage (tumor diameter = 20mm).
Antibody Regimens
Antibody was delivered using 100ul volumes and injected intraperitoneally bi-weekly for the following: anti-CTLA4 (125 ug, bioxcel BE0164), anti-PD1 (10mg/kg, bioxcel BE0146), anti-CD19 (400ug, bioxcel BE0150), anti-CD8 (500ug, bioxcel BE0004), anti-CD4 (500ug, bioxcel BE0003), and anti-CD16/32 (500ug, bioxcel, BE0307), anti-IL21 (100ug, ThermoFisher, 16-7211-82) . Mice received one tail vein injection of anti-CD20 (Ultra-LEAF Purified anti-mouse CD20, item 152104, reported depletion of 30 or more days) and then given biweekly doses of the anti-PD1/anti-CTLA4 combination therapy. Depletion was confirmed by flow-cytometry in the context of combination anti-PD1/anti-CTLA4 treatment for 7 days.
In vitro cell line studies
T11 cell lines and mutagenized versions were culture in Gibco RPMI media supplemented with 5% fetal bovine serum and 1X penn-strep. KPB25L cell lines and mutagenized versions were cultured in Gibco HUMEC media with supplement. Media was supplemented with 5% fetal bovine serum and 1X penn-strep. To generate Apobec3 overexpressing lines, we purchased a vector that overexpresses the mouse Apobec3 ORF under the control of the EF1A promoter from vectorbuilder (VB170110-1098xwd). This isoform lacks exon 5, thus allowing Apobec3 overexpression to be determined by examining read alignments spanning exon 4 and exon 6 using sashimi plots on IGV. Cells were stably transfected using FUGENE. To allow for the accumulation of mutations, KPB25L-Apobec cells were cultured for 1 month prior to whole exome sequencing and experimental studies (in vivo and in vitro). Similarly, T11-Apobec cells were cultured for two months prior to whole exome sequencing and experimentation. The matching parental lines (T11, 2 months ; KPB25L, 1 month) were kept in culture for the same amount of time prior to sequencing to control for other mutation sources (i.e.- p53 loss, BRCA1 loss). For mutagenization by ultra-violet light, exposure was received by placing cells cultured in 10cm plate (lid removed) underneath a germicidal UV lamp that emits 253.7 nm lightwaves and runs at 100mw per cm2 at maximum to 40 mw per cm2 at minimum. Exposure was done in 30 second increments. Total exposure time for KPB25Luv was 1 min and 30 seconds and 5 minutes for T11-UV. Cells were allowed to recover to 70-90% confluency and then cultured for 10-14 days prior further experimentation. To measure cell proliferation, we performed a cell counting experiment in triplicate. On day 0, cells were seeded and then cells were counted the next 3 days using trypan blue stain and countess cell counter.
METHOD DETAILS
Flow cytometry
Tumors were digested into single suspensions using the Miltenyi tumor dissociation kit (130-096-730) and Miltenyi gentleMACs dissociator. Spleen was placed in DMEM for gentleMACS dissociation. Cells were washed three times and resuspended in PBS diluted live/dead staining dye (Fixable Viability Stain 700, BD) for 35 minutes on ice followed by washing with PBS. Fc Block (clone 2.4G2; Bioxcell) diluted with staining buffer (PBS with 10% FCS) was then used for blocking for 20 min on ice. Fluorochrome labeled antibodies diluted with staining buffer were added and staining was continued for 40 min on ice. After a washing step, cells were fixed/stored in a 1 % PFA solution until analysis. When staining for T cells, stained cells were then permeabilized for FoxP3 staining using eBioscience FoxP3 staining kit according to manufacturer’s instructions and stained with anti-Foxp3 antibody. Fluorochrome labeled antibodies are listed in the methods table. T cells staining antibodies were: anti-CD45, CD3, CD4,CD8, CD62L, CD44, Foxp3. The fluorochrome labeled antibodies for B cells staining were: anti-CD45, CD19, CD20, B220, MHCII, CD80, CD86. Flow cytometry sample acquisition was performed on a LSRFortessa (BD), and analysis was performed using FlowJo software (TreeStar). The gating strategy is as illustrated below. Cell counts were quantified as follows.
Gated cell number=Events of gated cellsEvents of total live cellsx106
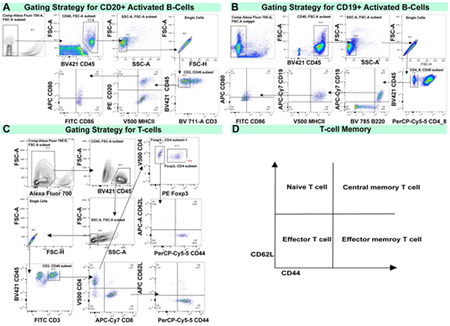
Flow cytometry gating strategy. (A) Gating strategy for CD20+ Activated B-cells as shown in the T11-Apobec model. (B) Gating strategy for CD19+ Activated B-cells as shown in the KPB25Luv model. (C) Gating strategy for T-cells (CD4+ or CD8+) to examine memory markers.(D) Key for to interpret memory markers profiles in T-cells.
ELISA for IFNy detection
An Elisa was performed according to manufacturer instructions using the Mouse IFN-γ ELISA Kit II (Cat: 558258, BD Biolegend) to compare T11 parental and T11-Apobec serum from non-treated mice harboring these respective tumors. ELISA plates were scanned on Synergy2 Microplate Reader (Biotek Instruments Inc). Standards and samples absorbance and optical density were analyzed using Gen5 Data Analysis software (Biotek Instruments Inc).
Immunohistochemistry
Immunohistochemistry used paraffin embedded tumors from mice that received treatment for 7 days. The untreated control samples were matched time points from mice bearing tumors that had reached 5mm and collected 7 days later. All immunohistochemistry and embedding were conducted by the UNC Animal Histopathology Core. The IgG staining used a Rabbit anti-mouse monoclonal [RM103] to IgG-Kappa light chain (ab190484). The anti-CD20 stain used ab64088. The anti-B220 staining used ab64100. The anti-CD3 staining used ab5690. Antigen retrieval used Ventana’s CC1 (pH 8.5), for 40 minutes @ 95 degrees Celsius and given a block (Rodent Decloaker 10X, Biocare, BM#RD913L) for 1 hour, followed by a peroxidase block for 12 minutes. Next, primary antibody diluent (1:700) was added for 1 hour at room temperature using Discovery AB Diluent (760-108), followed by a post-peroxidase block for 12 minutes. Secondary antibody was added (Discovery OmniMap anti Rabbit HRP, 760-4311, Ready to Use) for 32 minutes at room temperature. The samples were treated with DAB, Hematoxylin II for 12 minutes, and then Bluing Reagent for 4 minutes. Slide staining used Ventana’s Discovery Ultra Automated IHC staining system.
IgG-Binding Assay
The IgG binding assay was based upon an established protocol(Kooreman et al., 2018). Tumor bearing mice were euthanized following 7 days of therapy (or time matched in non-treated control). Whole blood was collected by cardiac puncture, blood was allowed to coagulate, and tubes were spun for 10 minutes at 4 degrees Celsius. The supernatant was collected to provide a source of serum for IgG binding tests. Cells were washed three times using centrifugation and PBS and resuspended in 100 μL PBS buffer with the addition of 2 μL of serum. Incubation was one on ice for 45 minutes. On target testing used serum that came from a KPB25Luv tumor bearing mouse on KPB25Luv cells from culture or serum from T11-apobec bearing mouse on T11-Apobec cells from tissue culture. Off-target binding was assessed by cross reactivity with opposite combinations of the aforementioned cells. Since T11-Apobec cells showed high cross-reactivity a pre-absorption protocol was followed to remove autoantibodies from the assay. Pre-absorption was done by incubating serum with the T11 parental cell line for 45 minutes on ice. Cells were then centrifuged and the supernatant collected and then incubated with T11-apobec cells for 45 minutes on ice. Background was assessed using the antibody. To detect IgG binding to cells, a FITC-tagged anti-mouse IgG (Thermofisher Scientific) was used. Background was assessed by using an isotype control IgG antibody.
Western blot
Mouse serum was harvested from tumor bearing Igmi and Balbc mice by cardiac puncture. In addition, serum was obtained from non-tumor bearing mice. Serum protein was quantified using DC™ Protein Assay (Bio-Rad, Hercules CA) and all samples were diluted to equal concentration using water. Samples were separate by electrophoresis on 4-15% Tris-Glycine polyacrylamide gels (Bio-Rad), transferred to Hybond® PVDF membrane (MilliporeSigma, St. Louis MO), blocked for 1 hour at room temperature in 5%BSA (MilliporeSigma) in TBS with 0.05% Tween-20. The membrane was incubated with either IgG1 HRP-conjugated (OBT1508P) or IgM MU CHAIN HRP-conjugated (5276-2504) antibody (Bio-Rad) for 2 hours while rocking at room temperature. The membrane was washed three times in TBS with 0.05% Tween-20 and exposed to SuperSignal chemiluminescent substrate (ThermoScientific Scientific, Waltham MA). The membrane was visualized using the ChemiDoc™ MP Imaging System (Bio-Rad).
Quantification and Statistical Analysis
RNA-seq analysis
mRNA was isolated using the Qiagen RNeasy kit according to manufacturer protocol. mRNA quality was assessed using the Agilent Bioanalyzer and libraries for mRNA-seq made using total RNA and the Illumina TruSeq mRNA sample preparation kit. Paired end (2×50bp) sequencing was performed on the Illumina HiSeq 2000/2500 sequencer at the UNC High Throughput Sequencing Facility. Resulting fastq files were aligned to the mouse mm10 reference genome using the STAR aligner algorithm(Dobin et al., 2013). Resulting BAM files were sorted and indexed using Samtools and quality control was performed using Picard. Transcript read counts were determined was performed using Salmon(Patro et al., 2015). Genes with no reads across any of the samples were removed. Salmon gene-level counts upper quartile normalized(Bullard et al., 2010). Genes with an average expression less than 10 were filtered from the dataset. Genes were log2 transformed using Cluster 3.0 and zeros were preserved for signature analysis. Data was then median centered and column standardized to establish the matrix in working form for statistical analyses. Hierarchical clustering was done using Cluster 3.0(de Hoon et al., 2004) and viewed in Java Tree View. Supervised gene expression analyses were performed using Significance Analysis of Microarrays (Tusher et al., 2001) and an FDR of 5%. Gene expression signatures were calculated as the median expression of all the genes in the signature as published(Fan et al., 2011). In signatures analysis, mouse genes were converted to human using BioMart. Univariate and multivariate analyses were performed using standardized signature scores in R-studio using logistic regression. Boxplots and KM plots were generated in graph pad prism. Sashimi plots demonstrating Apobec3 overexpression were done using IGV. All murine RNAseq data, totaling 290 samples, have been deposited into GEO under the series ID of GSE124821, GSE118164 (MMMTV-Wnt tumors(Pfefferle et al., 2019)), the CDH1/PIK3Ca tumors were published and included as RNA-seq data in this study (An et al., 2018), and raw sequence files in SRA under PRJNA506275.
Single Cell RNA-Seq
Single cell suspensions were generated using the Miltenyi mouse tumor dissociation kit and a gentleMACS tissue dissociator. Single cell suspensions were input to a 10x Genomics Chromium machine to establish single-cell gel beads in emulsion (GEMs) for directed retrieval of approximately 5000-10000 cells. Single-cell RNA-Seq libraries were primed using the following Single Cell 3’ Reagent Kits v2: Chromium™ Single Cell 3’ Library & Gel Bead Kit v2, PN-120237; Single Cell 3’ Chip Kit v2 PN-120236 and i7 Multiplex Kit PN-120262" (10x Genomics). Protocols were performed as directed in the Single Cell 3’ Reagent Kits v2 User Guide (Manual Part # CG00052 Rev A). Libraries were sequenced on an Illumina HiSeq 4000 as 2 × 150 paired-end reads. The Cell Ranger Single Cell Software Suite, version 3.0.2 was used for de-multiplexing, barcode ad UMI processing, and single-cell 3′ gene counting. Specific details and instructions to run Cell Ranger can be found at: https://support.10xgenomics.com/single-cell-gene-expression/software/pipelines/latest/what-is-cell-ranger). Reads were mapped to the mm10 genome.
Cell ranger output and single cell RNA-seq data were analyzed using the R-package Seurat version 2.3.4. Here quality control parameters were utilized to filter dead-cells, doublets, and cells without the minimal number of expressed genes. Preprocessing for clustering and marker gene analysis was as follows. Raw UMI counts were normalized using log-normalization. Variable genes were identified using the standard deviation from the mean (using only non-zero values). Data were scaled and centered by regressing on library size and mitochondrial mRNA counts. Principle component analysis (PCA) was performed using variable genes. For TSNE analysis, clusters were identified using shared nearest neighbor (SNN) and reduction was performed based on PCA using the first 20 principle components. Marker genes defining each cluster were identified using Seurat’s FindAllMarkers function, which employs a Wilcoxon rank sum test to determine significant genes. These marker genes were used to assign cluster identity to individual cell types. In order to establish identity the top 200 genes were analyzed on established gene expression data for immune cells which can be obtained at http://rstats.immgen.org/DataPage/ (Heng et al., 2008). In addition, cell clusters and markers were analyzed using the CellMarker database(Zhang et al., 2018): http://bio-bigdata.hrbmu.edu.cn/CellMarker/index.jsp, published signatures(Bindea et al., 2013; Liberzon et al., 2011; Newman et al., 2015), and existing literature (King, 2009; O'Garra, 1998; Vogelzang et al., 2008).
The single cell RNAseq data are available at the Gene Expression Omnibus: GSE136206.
5’ TCR/BCR Sequencing and Repertoire Analysis
Whole tumor mRNA coming from T11-apobec and KPB25Luv models treated for 7 days with ICI therapy was used as input for sequencing using each SMARTer Mouse TCR a/b Profiling Kit and SMARTer Mouse BCR IgG H/K/L Profiling Kit. First strand DNA-synthesis, amplification, and library generation followed protocol listed in the user manual. Following library selection additional cleanup utilized pippin prep and selection of fragments 400-900 bp. Paired-end, (2 × 300 bp) libraries were sequenced on the Illumina miSEQ next generation sequencer. Following demultiplexing, the resulting fastq files were analyzed using MIXCR(Bolotin et al., 2015), version 2.1.9-6. Top chain specific clone counts were extracted from resulting clones files and designated as those most expressed/highest numbers of counts detected. MIXCR determined clonotypes and their relative abundance were used to calculate shannon entropy(Bischof and Ibrahim, 2016; Magurran, 2013; Selitsky et al., 2019), a diversity index where lower entropy scores relate to low diversity/clonal restriction. Shannon entropy was calculated using the R package vegan. Results were visualized using GraphPad Prism.
External Gene Expression Data Analysis
Microarray data from Neoadjuvant chemotherapy treated breast tumors was downloaded from GEO as GSE32646(Miyake et al., 2012), Her2+ samples were excluded. Microarray data for the ISPY data was downloaded from the UNC microarray database and is also available as GSE22226 (Esserman et al., 2012). Samples were limited to those in the A/C/T arm, normal-like samples were removed. Data was median centered and column standardized prior to signatures analysis. Gene expression RNA-Seq data from the clinical trial CALG40601 was downloaded from GEO as GSE116335(Tanioka et al., 2018). Samples from the trastuzumab arm only were analyzed. The RNA-seq data from the melanoma clinical trial of ipilimumab was downloaded from DbGAP phs000452.v2.p1(Van Allen et al., 2015). RNA-seq data for NCT01560663 is published (Echavarria et al., 2018). Fastq files were aligned to hg38.d1 genomes using STAR(Dobin et al., 2013). Resulting BAM files were sorted and indexed using Samtools and quality control was performed using Picard. Transcript read counts were determined was performed using Salmon(Patro et al., 2015; Patro et al., 2017). For RNA-Seq datasets, genes with no reads across any of the samples were removed. Salmon gene-level counts upper quartile normalized. Genes with an average expression less than 10 were filtered from the dataset. Genes were log2 transformed in Cluster 3.0(de Hoon et al., 2004) and zeros were preserved for signature analysis. Data was the median centered and column standardized. CALGB40601 data was limited to pretreatment samples from the Trastuzumab arms only. PAM50 subtypes were used from the publication(Tanioka et al., 2018). RNA-seq data for sorted immune cell types were queried using the online tool http://rstats.immgen.org/MyGeneSet_New/index.html(Heng et al., 2008). Heatmaps were generated using the online tool and by selection of the depicted immune cell populations.
For the single-cell RNA-seq melanoma dataset (GSE120575(Sade-Feldman et al., 2018) ), levels of genes were quantified as Transcripts Per Million (TPM). For each cell, the gene expression measurement was normalized by its total expression, multiplied by a scale-factor 10,000, and log-transformed. The collapsed gene signature score down to each sample was computed as follows: first, we took a sum of the normalized TPM values for each gene in the signature over all the cells in a given sample, then we calculated the median gene expression signature score for each sample.
Whole Exome Sequencing
For whole exome sequencing of mouse tumor, genomic DNA was isolated using a Qiagen DNeasy blood and tissue kit (cat: 69506). As controls, we isolated DNA from whole-mouse mammary glands from Balbc and FVB mice. Libraries were constructed using the Agilent Sure Select XT kit with 1 ug of genomic DNA according to the manufacturer's protocol. DNA libraries were selected and amplified using the Agilent SureSelect Mouse All Exon kit. Final library size selection used approximately 300 bp fragments. Quality of libraries and captured exomes were measured using the Agilent Tapestation DNA 1000 and High Sensitivity D1000. Paired end (2 ×100 bp) sequencing was done using Illumina HiSeq 2000/2500 sequencer at the UNC High Throughput Sequencing Facility. Sequences from fastq files were aligned to the mm10 using BWA mem(Li, 2013). Biobambam was used to process BAM files(Tischler and Leonard, 2014) and Picard was used for quality assessment. Strelka was used to call mutations and generate VCF files(Saunders et al., 2012). Variant filtering used mouse mammary gland sequencing from the appropriate genetic background. Somatic mutations were considered provided the variants were not detected in unexpected regions (ie- introns), or had evidence for being “germline” (shared in models of a known common background). In addition, subjective filtering was performed using IGV (for example, low-level detection of potential variant in the normal control). Neoantigen predictions were done using pvac-seq and followed published guidelines(Hundal et al., 2016). All raw DNA sequence fastq files have been deposited into the SRA under the series PRJNA506275.
Data and Code Availability
The published article includes all datasets and code generated in this study. The datasets generated during this study are available at GEO Datasets GSE124821, GSE136206 and the Sequence Read Archive PRJNA506275. Please see the key resources table or contact by contacting Charles M Perou (cperou@med.unc.edu) for further information.
KEY RESOURCES TABLE
| REAGENT or RESOURCE | SOURCE | IDENTIFIER |
|---|---|---|
| Antibodies | ||
| Anti-mouse PD1 (clone RMP1-14) | Bioxcel | Cat: BE0146; RRID: AB_10949053 |
| Anti-mouse CTLA4 (clone 9D9) | Bioxcel | Cat: BE0164; RRID: AB_10949609 |
| Anti-mouse CD4 (clone GK1.5) | Bioxcel | Cat: BE0003-1; RRID: AB_1107636 |
| Anti-mouse CD8a (clone 53-6.7) | Bioxcel | Cat: BE0004-1; RRID: AB_1107671 |
| Anti-mouse CD19 (clone 1D3) | Bioxcel | Cat: BE0150; RRID: AB_10949187 |
| Anti-mouse CD16/32 (clone 2.4G2) | Bioxcel | Cat: BE0307; RRID: AB_2736987 |
| Anti-mouse CD20 (clone SA271G2) | Biolegend | Cat: 152104; RRID: AB_2629619 |
| Anti-mouse IL21 (clone FFA21) | Thermofisher | Cat: 16-7211-82; RRID: AB_1963610 |
| Mouse IgG2b Isotype Control (clone MPC-11) | Bioxcel | Cat: BE0086; RRID: AB_1107791 |
| Rat IgG2a Isotype Control (clone 2A3) | Bioxcel | Cat: BE0089; RRID: AB_1107769 |
| Anti-mouse CD45, eFluor 450 (clone 30-F11) | Thermofisher | Cat: 48-0451-82; RRID: AB_1518806 |
| Anti-mouse B220 (CD45R), BV785 (clone RA3-6B2) | Biolegend | Cat: 103246; RRID: AB_2563256 |
| Anti-mouse CD19, APC-H7 (clone 1D3) | BD Biosciences | Cat: 560245; AB_1645233 |
| Anti-mouse CD20, PE (clone AISB12) | Thermofisher | Cat: 12-0201-80; RRID: AB_1210737 |
| Anti-mouse I-A/I-E (MHC II); BV5210 (clone M5/114.15.2) | Biolegend | Cat: 107636; RRID: AB_2734168 |
| Anti-mouse CD80; APC (clone 16-10A1) | Biolegend | Cat: 104714; RRID: AB_313135 |
| Anti-mouse CD86; Fitc (clone GL1) | BD Biosciences | Cat: 561962; RRID: AB_10896136 |
| Anti-mouse CD16/32; Fitc (clone 2.4G2) | BD Biosciences | Cat: 553144; RRID: AB_394659 |
| Anti-mouse CD3; Fitc (clone 17A2) | Thermofisher | Cat: 11-0032-82; RRID: AB_2572431 |
| Anti-mouse CD4; BV510 (clone GK1.5) | Biolegend | Cat: 100449; RRID: AB_2564587 |
| Anti-mouse CD8a ; APH-H7 (clone 53-6.7) | BD Biosciences | Cat: 560182; RRID: AB_1645237 |
| Anti-mouse CD44; PerCP-Cyanine5.5 (clone IM7) | Thermofisher | Cat: 45-0441-82; RRID: AB_925746 |
| Anti-mouse CD62L; APC (clone MEL-14) | BD Biosciences | Cat: 553152; RRID: AB_398533 |
| Anti-mouse FOXP3; PE (clone FJK-16s) | Thermofisher | Cat: 12-5773-82; RRID: AB_465936 |
| Anti-mouse CD20; (clone SP32) | Abcam | Cat: ab64088; RRID: AB_1139386 |
| Anti-mouse B220/CD45R; (clone RA3-6B2) | Abcam | Cat: ab64100; RRID: AB_1140036 |
| Anti-mouse CD3;DAB (polyclonal) | Abcam | Cat: ab5690; RRID: AB_305055 |
| Anti-mouse IgG-Kappa; (clone RM103) | Abcam | Cat: ab190484; RRID:AB_2811042 |
| Anti-mouse IgM, HRP (polyclonal) | Biorad | Cat: 5276-2504; RRID: AB_619904 |
| Anti-mouse IgG1, HRP (polyclonal) | Biorad | Cat: OBT1508P; RRID: AB_619901 |
| Anti-rabbit IgG Cross-adsorbed, Unconjugated (polyclonal) | Thermofisher | Cat: 31213 ; RRID: AB_228376 |
| Anti-mouse IgG, Alexa Fluor 488 (polyclonal) | Thermofisher | Cat: A-11001; RRID: AB_2534069 |
| Anti-rabbit IgG, HRP | Ventana Medical Systems | Cat: 760-4311; RRID:AB_2811043 |
| Bacterial and Virus Strains | ||
| Biological Samples | ||
| 2336R Tumor Transplant Line2153L Tumor Transplant Line2225L Tumor Transplant Line2224L Tumor Transplant Line9263-3F Tumor Transplant Line | Tp53−/− Tumors (Jerry et al., 2000, Herschkowitz et al., 2012)This paperPerou Lab | NA |
| Chemicals, Peptides, and Recombinant Proteins | ||
| Fixable viability stain 700 | BD Biosciences | Cat: 564997 |
| Rodent Decloaker, 10XPretreatment Reagent | Biocare Medical | Cat: RD913 L, M |
| Critical Commercial Assays | ||
| TruSeq Stranded mRNA | Illumina | TruSeq® Stranded mRNA Library Prep (48 Samples) 20020594 |
| Chromium Single Cell 3' Reagent Kits | 10x Genomics | Chromium™Single Cell 3’ Library & Gel Bead Kit v2, PN-120237Single Cell 3’ Chip Kit v2 PN-12023i7 Multiplex Kit PN-120262 |
| MACS Tumor Dissociation Kit, mouse | Miltenyi Biotech | Tumor dissociation kit # 130-096-730 |
| ChromoMap DAB kit | Ventana Medical Systems | Cat: 760-159 |
| Qiagen DNeasy blood and tissue kit | Qiagen | Cat: 69506 |
| Qiagen RNeasy Mini Kit | Qiagen | Cat: 74104 |
| Mouse IFN-γ ELISA Kit II | BD Biosciences | Cat: 558258 |
| SMARTer Mouse BCR IgG H/K/L Profiling Kit | Takara | Cat: 634422 |
| SMARTer Mouse TCR a/b Profiling Kit | Takara | Cat: 634402 |
| Agilent Sure Select XT kit | Agilent | Cat: G9611B |
| Agilent SureSelect Mouse All Exon | Agilent | Cat: 5190-4642 |
| eBioscience FoxP3 staining kit | Thermofisher | Cat: 00-5523-00 |
| Deposited Data | ||
| Raw and normalized data; microarray | Miyake et al., 2012 | GSE32646 |
| Raw and normalized data; microarray | Esserman et al., 2012 | GSE22226 |
| Raw data; RNA-seq | Tanioka et al., 2018 | GSE116335 |
| Raw data; RNA-seq | Van Allen et al., 2015 | DbGAP phs000452.v2.p1 |
| Raw data; RNA-seq | Echavarria et al., 2018 | https://doi.org/10.1158/1078-0432.CCR-17-1912 |
| Raw and normalized data; single-cell RNA-seq | Sade-Feldman et al., 2018 | GSE120575 |
| Raw data and normalized data; RNA-seq | This paper | GSE124821; PRJNA506275 |
| Raw data and normalized data; RNA-seq | Pfefferle et al., 2019 | GSE118164 |
| Raw and normalized data; scRNA-seq | This paper | GSE136206 |
| Experimental Models: Cell Lines | ||
| KPB25L-ParentKPB25LuvKPB-Apobec | K14-Cre;Tp53 f/f Brca1 f/fParent model-(Hollern et al., 2018)Mutagenized- This paperPerou Lab | NA |
| T11- ParentT11-uvT11-Apobec | Tp53−/− Parent model-(Jerry et al. 2000 ; Herschkowitz et al., 2012)Mutagenized- This paperPerou Lab | NA |
| Experimental Models: Organisms/Strains | ||
| Mouse: FVB/NJ | The Jackson Laboratory | JAX: 001800 |
| Mouse: Balb/cJ | The Jackson Laboratory | JAX: 000651 |
| Mouse: Igmi | Waisman et al., 2007Serody lab- UNC | NA |
| Oligonucleotides | ||
| Igmi Mice Genotyping Primers: 5’GAGACGAGGGGGAAGACATTTG3’,5’CCTTCCTCCTACCCTACA AGCC3’ | Waisman et al., 2007 | NA |
| Recombinant DNA | ||
| Apobec3 plasmid | VectorBuilder | VB170110-1098xwd |
| Software and Algorithms | ||
| Seurat (version 2.3.4) | Satija et al., 2015Butler et al., 2018 | https://github.com/satijalab/seurat |
| MIXCR (version 2.1.9-6) | Bolotin et al., 2015 | https://github.com/milaboratory/mixcr/ |
| R (3.5.1) | R Core Team (2018) | https://www.R-project.org/ |
| R Studio | R Studio | https://www.rstudio.com |
| STAR aligner | Dobin et al., 2013 | https://github.com/alexdobin/STAR |
| SALMON | Patro et al., 2015 Patro et al., 2017 | https://combine-lab.github.io/salmon/ |
| Picard | Broad Institute | https://broadinstitute.github.io/picard/ |
| Cluster 3.0 | de Hoon et al., 2004 | http://bonsai.hgc.jp/~mdehoon/software/cluster/software.htm |
| Java TreeView | NA | http://bonsai.hgc.jp/~mdehoon/software/cluster/software.htm |
| FlowJo (version 10) | FlowJo, LLC | https://www.flowjo.com/solutions/flowjo/downloads/ |
| CellRanger (version 3.0.2) | 10X Genomics | https://support.10xgenomics.com/single-cell-gene-expression/software/pipelines/latest/what-is-cell-ranger |
| pVAC seq | Hundal et al., 2016 | https://pvac-seq.readthedocs.io/en/latest/ |
| IMMGEN MyGeneSet | Heng et al., 2008 | http://rstats.immgen.org/MyGeneSet_New/index.html |
| IGV | Broad Institute | http://software.broadinstitute.org/software/igv/userguide |
| Vegan | vegan: Community Ecology Package | https://cran.r-project.org/web/packages/vegan/vegan.pdf |
| GraphPad Prism | GraphPad Software | https://www.graphpad.com/ |
| Significance Analysis of Microarrays | Tusher et al., 2001 | https://CRAN.R-project.org/package=samr |
| SAMtools | Li H et al. 2009 | http://www.htslib.org |
| Biobambam | Tischler and Leonard, 2014 | https://github.com/gt1/biobambam |
| BWA mem | Li 2013 | http://bio-bwa.sourceforge.net |
| Strelka | Saunders et al., 2012 | https://github.com/Illumina/strelka |
| SigClust | Huang et al., 2015 | https://cran.r-project.org/web/packages/sigclust/index.html |
| Other | ||
| Matrigel® Basement Membrane Matrix | Corning | Cat: 354234 |
| HUMEC READY MEDIUM-(With supplement) | Life Technologies Inc. | Cat: 12752010 |
| RPMI 1640 | Life Technologies Inc. | Cat: 11875093 |
| DMEM | Life Technologies Inc. | Cat: 11995065 |
| Discovery antibody diluent | Ventana Medical Systems | Cat: 760-108 |
| FUGENE Transfection reagent | Promega | Cat: E2311 |
Supplementary Material
1
Figure S1- Somatic mutation burden and response to immune checkpoint therapy in mouse models of triple negative breast cancer. Related to Figure 2. (A) Top, overall survival of non-treated tumors and treated tumors on anti-PD1/anti-CTLA4 therapy and lower panel showing 10-day acute response to anti-PD1/anti-CTLA4 therapy demonstrated models that are resistant to immune checkpoint therapy. (B) Somatic mutation burden as called by strelka in our mouse model cohort, with samples being color coded for response as depicted. (C) Neoantigen burden as predicted by pVac-Seq; strong binders were determined by best predicted binding threshold <500mM and weak binders by predicted <2500mM binding threshold. (D) Tumor mutation burden in resistant tumors and human cancers from the depicted TCGA study cohorts. (E) Top, overall survival of non-treated and treated tumors on anti-PD1/anti-CTLA4 therapy and lower, 10-day acute response to anti-PD1/anti-CTLA4 therapy demonstrated KPB25L-Apobec and T11-UV as models that are sensitive to immune checkpoint therapy. (F) Single agent testing of anti-Pd1 or anti-Ctla4 in comparison to anti-PD1/anti-CTLA4 combination therapy, with overall survival on top and 10-day acute response showed on the lower. (G) Testing isotype control antibodies in the KPB25L and T11-Apobec models for anti-Pd1 and anti-Ctla4 shows no impact on top, overall survival, and lower, acute response. In Kaplan-Meier plots, p-value mark results of Log-rank (Mantel-Cox) test. In box and whiskers dot plots, the bar signify the average and standard deviation from average. The p-values represent two-tailed p-value from standard unmatched T-tests.
2
Figure S2- In vitro characterization of mouse tumor-derived cell lines mutagenized by Apobec3 or by exposure to short-wave ultra violet radiation. Related to Figure 2. (A) Apobec3 isoform2 over-expression in KPB25L-Apobec as compared to KPB25L parent (note the counts that isoform appropriately span/overlap exons 4 and 6 were identified using IGV sashimi plots and reported here). (B) Testing a proliferation signature(Fan et al., 2011) for median expression in Log2 normalized, uncentered, gene expression demonstrates no difference in proliferation features in KPB25L, KPB25L-Apobec, and KPB25Luv gene expression. (C) Cell counting experiment to measure proliferation in vitro to compare KPB25L parent, KPB25Luv (UV mutagenized), and KPB25L-Apobec. (D) Apobec3 isoform2 over-expression as compared to T11 parent (note the counts that isoform appropriately span/overlap exons 4 and 6 were identified using IGV sashimi plots and reported here). (E) Testing a proliferation signature(Fan et al., 2011) for median expression in Log2 normalized, uncentered, gene expression demonstrates no difference in proliferation features in T11 parent, T11-Apobec, and T11-uv gene expression. (F) Cell counting experiment to measure proliferation in vitro to compare T11 parent, T11-uv (UV mutagenized), and T11-Apobec. Cell counting experiments were done in experimental triplicate.
3
Figure S3- Supervised analysis of anti-PD1/anti-CTLA4 therapy sensitive and resistant mouse mammary tumors. Related to Figure 3. (A) An expression heatmap showing values of B cell/T cell co-cluster signature genes across RNA-seq data of sorted immune cells. Across the top, sample names as described on http://rstats.immgen.org/MyGeneSet_New/index.html. Below this, the color bar depicts the position of major immune cell types, as keyed on the right hand side. Immediately below, B cell and T cell subsets are depicted as color-coded. The heatmap depicts high expression to low expression as illustrated by the color bar. Heatmaps, clustering, and results generated using http://rstats.immgen.org/MyGeneSet_New/index.html. (B) Boxplot for expression of the immune activity cluster in pretreatment samples from a human melanoma study of anti-CTLA4 therapy (Van Allen et al., 2015). (C) Boxplot for the immune activity cluster in pretreatment samples from a human melanoma study of anti-PD1/ anti-CTLA4 therapy (Sade-Feldman et al., 2018). (D) Boxplot for expression of the immune activity cluster in pretreatment breast cancer samples from CALGB40601, trastuzumab arm (Tanioka et al., 2018). (E) Boxplot for expression of the immune activity cluster in pretreatment samples from the human breast cancer dataset GSE32646, excluding Her2+ samples; P-FEC = neoadjuvant paclitaxel followed by 5-fluorouracil/epirubicin/cyclophosphamide(Miyake et al., 2012). (F) Boxplot for expression of the immune activity cluster in pretreatment samples from the human breast cancer iSPY clinical trial; A/C/T arm = Doxorubicin hydrochloride (Adriamycin) and cyclophosphamide, followed by treatment with paclitaxel(Esserman et al., 2012). (G) Boxplot for expression of the immune activity cluster in pretreatment samples from the TNBC NCT 01560663 clinical trial(Echavarria et al., 2018). In boxplots, bars represent the average and standard deviation. The p-values represent two-tailed p-value from standard unmatched T-tests; exception in panel C where Mann-Whitney tests where used due to non-gaussian distribution. All tumors collected after 7days of treatment or non-treatment.
4
Figure S4- Validation of immune cell signatures and demonstration of key immune features for individual tumor cell lines. Related to Figure 4. (A) Gene expression signatures and flow cytometry features for T cells and B cells in tumors of the T11-Apobec tumor bearing mice without or with anti-PD1/anti-CTLA4 (or single agent) therapy. (B) Gene expression signatures and flow cytometry features for T cells and B cells in tumors of mice bearing KPB25Luv tumor model without or with anti-PD1/anti-CTLA4 (or single agent) therapy. (C) Gene expression signatures and flow cytometry features for T cells in mice bearing the T11-uv tumor model without or with anti-PD1/anti-CTLA4 therapy. (D) IgG binding assay using serum from ICI treated KPB25Luv bearing mice. Lines depict matched sera testing on parent and mutagenized cells. (E) Flow cytometry comparing the number of CD8+ T cells with effector memory status in tumors of mice receiving the parent T11 line or T11-Apobec without or with anti-PD1/anti-CTLA4 therapy. (F) A comparison of the CD8+ T cells as a ratio to CD4+ Foxp3+ T cells in individual tumor lines without or with anti-PD1/anti-CTLA4 therapy. All panels depict tumors isolated following 7 days past the therapeutic start point of a 5mm diameter tumor. In bar plots, the bar represents the average and standard deviation from average. The p-values represent two-tailed p-value from standard unmatched T-tests.
5
Figure S5- Single cell RNA-seq of T11-Apobec tumors with or without anti-PD1/anti-CTLA4 therapy. Related to Figure 5. (A) TSNE analysis of all cells that passed quality control in untreated and aPD1/aCTLA4 treated T11-Apobec tumors. Cells are color coded according to dominant cell type (identified by gene expression profiles) found in each cluster.(B) The numerical distribution of cell types between treated and non-treated tumor cells. (C) Heatmap depicting supervised analysis comparing treated and non-treated tumor cells. (D) Violin plot of Cd8a mRNA levels in cells of treated and non-treated tumor cells. (E) Heatmap for results of Seurat marker analysis of significant genes between clusters of CD8+ T cells (as identified in A), shown are significant genes along with checkpoint Pdcd1 and Ctla4 mRNA (n=20). (F) Classification of CD8+ T cell clusters based on gene expression profiles. Note the color coding is also mapped above the heatmap in E. (G) Feature plot showing expression of key markers across CD8+ T cell clusters. (H) Violin plot depicting Cd4 mRNA levels in cells of treated and non-treated tumor cells. (I) Heatmap depicting results of Seurat marker analysis of significant genes between clusters of CD4+ T cells (as identified in A), shown are significant genes along with checkpoint Pdcd1 and Ctla4 mRNA (n=20) (J) Classification of CD8+ T cell clusters based on gene expression profiles. Color coding is also mapped to the heatmap in I. (K) Feature plot showing expression of key markers across CD4+ T cell clusters. (L) Violin plot of Cd20 mRNA levels in cells of treated and non-treated tumor cells.(M) Heatmap for results of Seurat marker analysis of significant genes between clusters of B cells (as identified in A; n=20). (N) Classification of B cell clusters based on gene expression profiles. Color coding is also mapped to the heatmap in M. (O) Feature plot showing expression of key markers across B cell clusters. (P) Results of 5’ TCR/BCR sequencing. For each boxplot the number counts detected for each clone, as identified by MIXCR, is shown along with the calculated Shannon entropy (where higher values indicate high diversity/low clonality). Above each bar, indicates the percent of all reads occupied by a clone(s). Note the fourth bar groups all clones not represented by the top 3 clones. All heatmap values can be found according the legend. All violin plots depict the mean and SEM. Markers were identified using Seurat and Wilcoxon rank sum testing.
6
Figure S6- Flow cytometry analysis of targeted immune cell depletion in tumors and spleens in tumor bearing mice receiving anti-PD1/anti-CTLA4 therapy. Related to Figure 6. (A) Flow cytometry plots of CD4+ T cell depletion at tumor and spleen in tumor bearing mice receiving anti-PD1/anti-CTLA4 therapy. (B) Flow cytometry plots of CD8+ T cell depletion at tumor and spleen in tumor bearing mice receiving anti-PD1/anti-CTLA4 therapy. (C) Flow cytometry plots of CD19 inhibition at tumor and spleen in tumor bearing mice receiving anti-PD1/anti-CTLA4 therapy. (D) Flow cytometry plots of CD20+ B cell depletion at tumor and spleen in tumor bearing mice receiving anti-PD1/anti-CTLA4 therapy.
7
Figure S7- Testing B Cell Activation and IgG Functionality during immune checkpoint therapy. Related to Figure 7. (A) Left: X-Y plot depicting relationship between a IgG signature and Th1 T cell signature in sensitive tumors (mRNA-seq) at day 7 with or without therapy. Right: Boxplot of expression of a T helper 1 signature in sensitive tumors (mRNA-seq) at day 7 with or without therapy. (B) Left: X-Y plot depicting relationship between the IgG signature and a T helper 2 cells in sensitive tumors (mRNA-seq) at day 7 with or without therapy. Right: Boxplot of expression of a T helper 2 signature in sensitive tumors (mRNA-seq) at day 7 with or without therapy. (C) Feature plot of T helper 17, 1, or 2 cytokines in KPB25Luv tumor CD4+ T cell clusters. (D) Feature plot of T helper 17, 1, or 2 cytokines in T11-Apobec tumor CD4+ T cell clusters. (E) Quantification of flow cytometry for activated B cells (B220+, Cd19+, MHC II +, Cd80+ or Cd86+) in KPB25Luv tumors given aPD1/aCTLA4 therapy with or without IL21 blockade. (F) Quantification of flow cytometry for activated B cells (B220+, Cd20+, MHC II +, Cd80+ or Cd86+) in T11-Apobec tumors given aPD1/aCTLA4 therapy with or without IL21 blockade. (G) IHC staining for IgG-kappa chain in untreated,aPD1/aCTLA4 treated, or IL21blocked aPD1/CTLA4 treated T11-Apobec tumors. (H) Left: Flow cytometry plot demonstrating diphtheria toxin depletion of Foxp3+ cells exclusively in T11-Apobec tumors implanted into the Foxp3-DTR GEMM. Right top: Quantification of Tregs in WT and Foxp3-DTR GEMMs (bearing T11-Apobec) given diphtheria toxin. Right bottom: flow cytometry quantification of activated B cells in Foxp3-DTR GEMMs given diphtheria toxin (DT) to deplete Tregs. (I) 21 day acute response for KPB25Luv bearing mice given ICI or ICI with IL21 blockade. (J) 21 day acute response for T11-Apobec bearing mice given ICI or ICI with IL21 blockade. (K) Top: IHC for CD3, B220, or CD20 on day 7 T11-Apobec tumors implanted into Igmi mice demonstrates these mice to be intact for B cells and T cells. Bottom: Western blot analysis of serum IgM for Igmi mice (blue bars) or Balbc mice (purple bars) bearing T11-Apobec tumors. (L) Flow cytometry results for anti-CD16/32-FITC binding to splenocytes in mice either treated with anti-PD1/anti-CTLA4 combination therapy or anti-CD16/32 (shortened as anti-CD16) with anti-PD1/anti-CTLA4 . (M) Flow cytometry results for anti-CD16/32-FITC binding to cells in tumors of mice either treated with anti-PD1/anti-CTLA4 combination therapy or anti-CD16/32 (shortened as anti-CD16) with anti-PD1/anti-CTLA4 . In X-Y plots, p-values were determined by linear regression analysis. In box and whiskers dot plots, the bar represents the average and standard deviation from average.
8
Supplemental File 1- Supervised analysis of sensitive and resistant mouse mammary tumors at pretreatment. Related to Figure 3.
9
Highlights.
- New TNBC murine models with high mutation burden and immune cell activity.
- A genomics resource of immune checkpoint treated tumors from TNBC murine models.
- Immune checkpoint blockade activates Tfh and B cells in the anti-tumor response.
- B cells impact immunotherapy response by secreting antibody and activating T cells.
Mouse models of triple negative breast cancer provide insights into how T follicular helper cell activation of B cells facilitates the effects of immune checkpoint inhibitors.
Acknowledgments
We are grateful to the UNC Mouse Phase One Unit, Lineberger Comprehensive Cancer Center Immune Monitoring and Genomics Facility (IMGF), Janet Dow and the UNC Flow Cytometry Core Facility, Dr. Nana Feinberg, Yongjuan Xia, Dr. Dawud Hilliard from UNC Translational Pathology and Histopathology labs, and the UNC Animal Studies Core for technical support and assistance. We thank Dr. Eran Andrechek for providing MMTV-PyMT tumors for RNA-sequencing.
Grant Support
This work was supported by the following grants: To Daniel P Hollern, NCI F32 Ruth L. Kirschstein National Research Service Award Individual Postdoctoral Fellowship (Parent F32) CA21042. To Charles M Perou, NCI Breast SPORE program (P50-CA58223), RO1-CA148761, RO1-CA195740, Breast Cancer Research Foundation, and Susan G. Komen SAC-160074. To Benjamin G. Vincent, Susan G. Komen Career Catalyst Research Grant. To Susana Garcia-Recio Susan G. Komen Postdoctoral fellowship (PDF17479425). To Miguel Martin, Corsorcio Centro de Investigación Biomédica en Red, thematic area for Cancer (CIBERONC), Instituto de Salud Carlos III, Spain. O.
Footnotes
Disclosure of Potential Conflicts of Interest
C.M.P is an equity stock holder and Board of Director Member of BioClassifier, LLC and GeneCentric Therapeutics. C.M.P and J.P. are also listed as an inventor on patent applications on the Breast PAM50. C.M.P, B.G.V., and J.P. are equity stock holders in GeneCentric Therapeutics.
Publisher's Disclaimer: This is a PDF file of an unedited manuscript that has been accepted for publication. As a service to our customers we are providing this early version of the manuscript. The manuscript will undergo copyediting, typesetting, and review of the resulting proof before it is published in its final form. Please note that during the production process errors may be discovered which could affect the content, and all legal disclaimers that apply to the journal pertain.
References cited:
- An Y, Adams JR, Hollern DP, Zhao A, Chang SG, Gams MS, Chung PE, He X, Jangra R, and Shah JS (2018). Cdh1 and Pik3ca Mutations Cooperate to Induce Immune-Related Invasive Lobular Carcinoma of the Breast. Cell reports 25, 702–714. e706. [DOI] [PMC free article] [PubMed] [Google Scholar]
- Bindea G, Mlecnik B, Tosolini M, Kirilovsky A, Waldner M, Obenauf AC, Angell H, Fredriksen T, Lafontaine L, and Berger A (2013). Spatiotemporal dynamics of intratumoral immune cells reveal the immune landscape in human cancer. Immunity 39, 782–795. [DOI] [PubMed] [Google Scholar]
- Bischof J, and Ibrahim SM (2016). bcRep: R package for comprehensive analysis of B cell receptor repertoire data. PLoS One 11, e0161569. [DOI] [PMC free article] [PubMed] [Google Scholar]
- Bolotin DA, Poslavsky S, Mitrophanov I, Shugay M, Mamedov IZ, Putintseva EV, and Chudakov DM (2015). MiXCR: software for comprehensive adaptive immunity profiling. Nature methods 12, 380–381. [DOI] [PubMed] [Google Scholar]
- Budczies J, Seidel A, Christopoulos P, Endris V, Kloor M, Gyorffy B, Seliger B, Schirmacher P, Stenzinger A, and Denkert C (2018). Integrated analysis of the immunological and genetic status in and across cancer types: impact of mutational signatures beyond tumor mutational burden. OncoImmunology, 1–13. [DOI] [PMC free article] [PubMed] [Google Scholar]
- Bullard JH, Purdom E, Hansen KD, and Dudoit S (2010). Evaluation of statistical methods for normalization and differential expression in mRNA-Seq experiments. BMC bioinformatics 11, 94. [DOI] [PMC free article] [PubMed] [Google Scholar]
- Burns MB, Lackey L, Carpenter MA, Rathore A, Land AM, Leonard B, Refsland EW, Kotandeniya D, Tretyakova N, and Nikas JB (2013). APOBEC3B is an enzymatic source of mutation in breast cancer. Nature 494, 366–370. [DOI] [PMC free article] [PubMed] [Google Scholar]
- Clark EA, and Ledbetter JA (1994). How B and T cells talk to each other. Nature 367, 425. [DOI] [PubMed] [Google Scholar]
- Cristescu R, Mogg R, Ayers M, Albright A, Murphy E, Yearley J, Sher X, Liu XQ, Lu H, and Nebozhyn M (2018). Pan-tumor genomic biomarkers for PD-1 checkpoint blockade–based immunotherapy. Science 362, eaar3593. [DOI] [PMC free article] [PubMed] [Google Scholar]
- de Hoon MJ, Imoto S, Nolan J, and Miyano S (2004). Open source clustering software. Bioinformatics 20, 1453–1454. [DOI] [PubMed] [Google Scholar]
- Dobin A, Davis CA, Schlesinger F, Drenkow J, Zaleski C, Jha S, Batut P, Chaisson M, and Gingeras TR (2013). STAR: ultrafast universal RNA-seq aligner. Bioinformatics 29, 15–21. [DOI] [PMC free article] [PubMed] [Google Scholar]
- Echavarria I, López-Tarruella S, Picornell AC, Garcia-Saenz JA, Jerez-Gilarranz Y, Hoadley KA, Gomez H, Moreno F, Del Monte-Millan M, and Márquez-Rodas I (2018). Pathological response in a triple negative breast cancer cohort treated with neoadjuvant carboplatin and docetaxel according to Lehmann's refined classification. Clinical Cancer Research, clincanres. 1912.2017. [DOI] [PMC free article] [PubMed] [Google Scholar]
- Eksteen B, Miles A, Curbishley SM, Tselepis C, Grant AJ, Walker LS, and Adams DH (2006). Epithelial inflammation is associated with CCL28 production and the recruitment of regulatory T cells expressing CCR10. The Journal of Immunology 177, 593–603. [DOI] [PubMed] [Google Scholar]
- Esserman LJ, Berry DA, Cheang MC, Yau C, Perou CM, Carey L, DeMichele A, Gray JW, Conway-Dorsey K, and Lenburg ME (2012). Chemotherapy response and recurrence-free survival in neoadjuvant breast cancer depends on biomarker profiles: results from the I-SPY 1 TRIAL (CALGB 150007/150012; ACRIN 6657). Breast cancer research and treatment 132, 1049–1062. [DOI] [PMC free article] [PubMed] [Google Scholar]
- Fan C, Prat A, Parker JS, Liu Y, Carey LA, Troester MA, and Perou CM (2011). Building prognostic models for breast cancer patients using clinical variables and hundreds of gene expression signatures. BMC medical genomics 4, 1. [DOI] [PMC free article] [PubMed] [Google Scholar]
- Heng TS, Painter MW, Elpek K, Lukacs-Kornek V, Mauermann N, Turley SJ, Koller D, Kim FS, Wagers AJ, and Asinovski N (2008). The Immunological Genome Project: networks of gene expression in immune cells. Nature immunology 9, 1091–1094. [DOI] [PubMed] [Google Scholar]
- Herbst RS, Soria J-C, Kowanetz M, Fine GD, Hamid O, Gordon MS, Sosman JA, McDermott DF, Powderly JD, and Gettinger SN (2014). Predictive correlates of response to the anti-PD-L1 antibody MPDL3280A in cancer patients. Nature 515, 563–567. [DOI] [PMC free article] [PubMed] [Google Scholar]
- Herschkowitz JI, Zhao W, Zhang M, Usary J, Murrow G, Edwards D, Knezevic J, Greene SB, Darr D, and Troester MA (2012). Comparative oncogenomics identifies breast tumors enriched in functional tumor-initiating cells. Proceedings of the National Academy of Sciences 109, 2778–2783. [DOI] [PMC free article] [PubMed] [Google Scholar]
- Hollern DP, Contreras CM, Dance-Barnes S, Silva GO, Pfefferle AD, Xiong J, Darr DB, Usary J, Mott KR, and Perou CM (2018). A mouse model featuring tissue-specific deletion of p53 and Brca1 gives rise to mammary tumors with genomic and transcriptomic similarities to human basal-like breast cancer. Breast Cancer Research and Treatment. [DOI] [PMC free article] [PubMed] [Google Scholar]
- Hong S, Zhang Z, Liu H, Tian M, Zhu X, Zhang Z, Wang W, Zhou X, Zhang F, and Ge Q (2018). B cells are the dominant antigen-presenting cells that activate naive CD4+ T cells upon immunization with a virus-derived nanoparticle antigen. Immunity 49, 695–708. e694. [DOI] [PubMed] [Google Scholar]
- Huang H, Liu Y, Marron J, and Huang MH (2015). Package ‘sigclust’. In. [Google Scholar]
- Hundal J, Carreno BM, Petti AA, Linette GP, Griffith OL, Mardis ER, and Griffith M (2016). pVAC-Seq: A genome-guided in silico approach to identifying tumor neoantigens. Genome medicine 8, 11. [DOI] [PMC free article] [PubMed] [Google Scholar]
- Iglesia MD, Parker JS, Hoadley KA, Serody JS, Perou CM, and Vincent BG (2016). Genomic Analysis of Immune Cell Infiltrates Across 11 Tumor Types. Journal of the National Cancer Institute 108, djw144. [DOI] [PMC free article] [PubMed] [Google Scholar]
- Iglesia MD, Vincent BG, Parker JS, Hoadley KA, Carey LA, Perou CM, and Serody JS (2014). Prognostic B-cell signatures using mRNA-seq in patients with subtype-specific breast and ovarian cancer. Clinical Cancer Research 20, 3818–3829. [DOI] [PMC free article] [PubMed] [Google Scholar]
- Jerry D, Kittrell F, Kuperwasser C, Laucirica R, Dickinson E, Bonilla P, Butel J, and Medina D (2000). A mammary-specific model demonstrates the role of the p53 tumor suppressor gene in tumor development. Oncogene 19, 1052. [DOI] [PubMed] [Google Scholar]
- King C (2009). New insights into the differentiation and function of T follicular helper cells. Nature Reviews Immunology 9, 757. [DOI] [PubMed] [Google Scholar]
- Kooreman NG, Kim Y, de Almeida PE, Termglinchan V, Diecke S, Shao N-Y, Wei T-T, Yi H, Dey D, and Nelakanti R (2018). Autologous iPSC-based vaccines elicit anti-tumor responses in vivo. Cell stem cell 22, 501–513. e507. [DOI] [PMC free article] [PubMed] [Google Scholar]
- Le DT, Uram JN, Wang H, Bartlett BR, Kemberling H, Eyring AD, Skora AD, Luber BS, Azad NS, and Laheru D (2015). PD-1 blockade in tumors with mismatch-repair deficiency. The New England journal of medicine 372, 2509–2520. [DOI] [PMC free article] [PubMed] [Google Scholar]
- Li H (2013). Aligning sequence reads, clone sequences and assembly contigs with BWA-MEM. arXiv preprint arXiv:13033997. [Google Scholar]
- Liberzon A, Subramanian A, Pinchback R, Thorvaldsdottir H, Tamayo P, and Mesirov JP (2011). Molecular signatures database (MSigDB) 3.0. Bioinformatics 27, 1739–1740. [DOI] [PMC free article] [PubMed] [Google Scholar]
- Magurran AE (2013). Measuring biological diversity: John Wiley & Sons; ). [Google Scholar]
- Miller LD, Chou JA, Black MA, Chifman J, Alistar A, Putti T, Zhou X, Bedognetti D, Hendrickx W, and Pullikuth A (2016). Immunogenic subtypes of breast cancer delineated by gene classifiers of immune responsiveness. Cancer immunology research, canimm. 0149.2015. [DOI] [PMC free article] [PubMed] [Google Scholar]
- Miyake T, Nakayama T, Naoi Y, Yamamoto N, Otani Y, Kim SJ, Shimazu K, Shimomura A, Maruyama N, and Tamaki Y (2012). GSTP 1 expression predicts poor pathological complete response to neoadjuvant chemotherapy in ER-negative breast cancer. Cancer science 103, 913–920. [DOI] [PMC free article] [PubMed] [Google Scholar]
- Morganella S, Alexandrov LB, Glodzik D, Zou X, Davies H, Staaf J, Sieuwerts AM, Brinkman AB, Martin S, and Ramakrishna M (2016). The topography of mutational processes in breast cancer genomes. Nature communications 7, 11383. [DOI] [PMC free article] [PubMed] [Google Scholar]
- Nelson BH (2010). CD20+ B cells: the other tumor-infiltrating lymphocytes. The Journal of Immunology 185, 4977–4982. [DOI] [PubMed] [Google Scholar]
- Network CGA (2012). Comprehensive molecular portraits of human breast tumours. Nature 490, 61–70. [DOI] [PMC free article] [PubMed] [Google Scholar]
- Newman AM, Liu CL, Green MR, Gentles AJ, Feng W, Xu Y, Hoang CD, Diehn M, and Alizadeh AA (2015). Robust enumeration of cell subsets from tissue expression profiles. Nature methods 12, 453–457. [DOI] [PMC free article] [PubMed] [Google Scholar]
- Nolan E, Savas P, Policheni AN, Darcy PK, Vaillant F, Mintoff CP, Dushyanthen S, Mansour M, Pang J-MB, and Fox SB (2017). Combined immune checkpoint blockade as a therapeutic strategy for BRCA1-mutated breast cancer. Science translational medicine 9, eaal4922. [DOI] [PMC free article] [PubMed] [Google Scholar]
- Nzula S, Going JJ, and Stott DI (2003). Antigen-driven clonal proliferation, somatic hypermutation, and selection of B lymphocytes infiltrating human ductal breast carcinomas. Cancer research 63, 3275–3280. [PubMed] [Google Scholar]
- O'Garra A (1998). Cytokines induce the development of functionally heterogeneous T helper cell subsets. Immunity 8, 275–283. [DOI] [PubMed] [Google Scholar]
- Parker JS, Mullins M, Cheang MC, Leung S, Voduc D, Vickery T, Davies S, Fauron C, He X, and Hu Z (2009). Supervised risk predictor of breast cancer based on intrinsic subtypes. Journal of clinical oncology 27, 1160. [DOI] [PMC free article] [PubMed] [Google Scholar]
- Patro R, Duggal G, and Kingsford C (2015). Salmon: accurate, versatile and ultrafast quantification from RNA-seq data using lightweight-alignment. bioRxiv, 021592. [Google Scholar]
- Patro R, Duggal G, Love MI, Irizarry RA, and Kingsford C (2017). Salmon provides fast and bias-aware quantification of transcript expression. Nature methods 14, 417. [DOI] [PMC free article] [PubMed] [Google Scholar]
- Pauken KE, Sammons MA, Odorizzi PM, Manne S, Godec J, Khan O, Drake AM, Chen Z, Sen DR, and Kurachi M (2016). Epigenetic stability of exhausted T cells limits durability of reinvigoration by PD-1 blockade. Science 354, 1160–1165. [DOI] [PMC free article] [PubMed] [Google Scholar]
- Peggs KS, Quezada SA, Chambers CA, Korman AJ, and Allison JP (2009). Blockade of CTLA-4 on both effector and regulatory T cell compartments contributes to the antitumor activity of anti–CTLA-4 antibodies. Journal of Experimental Medicine 206, 1717–1725. [DOI] [PMC free article] [PubMed] [Google Scholar]
- Pfefferle AD, Agrawal YN, Koboldt DC, Kanchi KL, Herschkowitz JI, Mardis ER, Rosen JM, and Perou CM (2016). Genomic profiling of murine mammary tumors identifies potential personalized drug targets for p53-deficient mammary cancers. Disease models & mechanisms 9, 749–757. [DOI] [PMC free article] [PubMed] [Google Scholar]
- Pfefferle AD, Darr DB, Calhoun BC, Mott KR, Rosen JM, and Perou CM (2019). The MMTV-Wnt1 murine model produces two phenotypically distinct subtypes of mammary tumors with unique therapeutic responses to an EGFR inhibitor. Disease Models & Mechanisms, dmm. 037192. [DOI] [PMC free article] [PubMed] [Google Scholar]
- Pfefferle AD, Herschkowitz JI, Usary J, Harrell JC, Spike BT, Adams JR, Torres-Arzayus MI, Brown M, Egan SE, and Wahl GM (2013). Transcriptomic classification of genetically engineered mouse models of breast cancer identifies human subtype counterparts. Genome Biol 14, R125. [DOI] [PMC free article] [PubMed] [Google Scholar]
- Qin S, Rottman JB, Myers P, Kassam N, Weinblatt M, Loetscher M, Koch AE, Moser B, and Mackay CR (1998). The chemokine receptors CXCR3 and CCR5 mark subsets of T cells associated with certain inflammatory reactions. The Journal of clinical investigation 101, 746–754. [DOI] [PMC free article] [PubMed] [Google Scholar]
- Rizvi NA, Hellmann MD, Snyder A, Kvistborg P, Makarov V, Havel JJ, Lee W, Yuan J, Wong P, and Ho TS (2015). Mutational landscape determines sensitivity to PD-1 blockade in non-small cell lung cancer. Science 348, 124–128. [DOI] [PMC free article] [PubMed] [Google Scholar]
- Sade-Feldman M, Yizhak K, Bjorgaard SL, Ray JP, de Boer CG, Jenkins RW, Lieb DJ, Chen JH, Frederick DT, and Barzily-Rokni M (2018). Defining T Cell States Associated with Response to Checkpoint Immunotherapy in Melanoma. Cell 175, 998–1013. e1020. [DOI] [PMC free article] [PubMed] [Google Scholar]
- Saunders CT, Wong WS, Swamy S, Becq J, Murray LJ, and Cheetham RK (2012). Strelka: accurate somatic small-variant calling from sequenced tumor-normal sample pairs. Bioinformatics 28, 1811–1817. [DOI] [PubMed] [Google Scholar]
- Schmid P, Adams S, Rugo HS, Schneeweiss A, Barrios CH, Iwata H, Diéras V, Hegg R, Im S-A, and Shaw Wright G (2018). Atezolizumab and nab-paclitaxel in advanced triple-negative breast Cancer. New England Journal of Medicine. [DOI] [PubMed] [Google Scholar]
- Selitsky SR, Mose LE, Smith CC, Chai S, Hoadley KA, Dittmer DP, Moschos SJ, Parker JS, and Vincent BG (2019). Prognostic value of B cells in cutaneous melanoma. Genome medicine 11, 36. [DOI] [PMC free article] [PubMed] [Google Scholar]
- Sharma P, and Allison JP (2015). The future of immune checkpoint therapy. Science 348, 56–61. [DOI] [PubMed] [Google Scholar]
- Shen M, Wang J, and Ren X (2018). New insights into tumor-infiltrating B lymphocytes in breast cancer: clinical impacts and regulatory mechanisms. Frontiers in immunology 9, 470. [DOI] [PMC free article] [PubMed] [Google Scholar]
- Smid M, Rodríguez-González FG, Sieuwerts AM, Salgado R, Prager-Van Der Smissen WJ, van Der Vlugt-Daane M, Van Galen A, Nik-Zainal S, Staaf J, and Brinkman AB (2016). Breast cancer genome and transcriptome integration implicates specific mutational signatures with immune cell infiltration. Nature communications 7, 12910. [DOI] [PMC free article] [PubMed] [Google Scholar]
- Tanioka M, Fan C, Parker J, Hoadley K, Hu Z, Li Y, Hyslop T, Pitcher B, Soloway M, and Spears P (2018). Integrated Analysis of RNA and DNA from the Phase III Trial CALGB 40601 Identifies Predictors of Response to Trastuzumab-Based Neoadjuvant Chemotherapy in HER2-Positive Breast Cancer. Clinical cancer research: an official journal of the American Association for Cancer Research. [DOI] [PMC free article] [PubMed] [Google Scholar]
- Taylor NA, Vick SC, Iglesia MD, Brickey WJ, Midkiff BR, McKinnon KP, Reisdorf S, Anders CK, Carey LA, and Parker JS (2017). Treg depletion potentiates checkpoint inhibition in claudin-low breast cancer. The Journal of clinical investigation 127, 3472–3483. [DOI] [PMC free article] [PubMed] [Google Scholar]
- Thibult M-L, Mamessier E, Gertner-Dardenne J, Pastor S, Just-Landi S, Xerri L, Chetaille B, and Olive D (2012). PD-1 is a novel regulator of human B-cell activation. International immunology 25, 129–137. [DOI] [PubMed] [Google Scholar]
- Tischler G, and Leonard S (2014). biobambam: tools for read pair collation based algorithms on BAM files. Source Code for Biology and Medicine 9, 13. [Google Scholar]
- Topalian SL, Hodi FS, Brahmer JR, Gettinger SN, Smith DC, McDermott DF, Powderly JD, Carvajal RD, Sosman JA, and Atkins MB (2012). Safety, activity, and immune correlates of anti–PD-1 antibody in cancer. New England Journal of Medicine 366, 2443–2454. [DOI] [PMC free article] [PubMed] [Google Scholar]
- Tsavaris N, Kosmas C, Vadiaka M, Kanelopoulos P, and Boulamatsis D (2002). Immune changes in patients with advanced breast cancer undergoing chemotherapy with taxanes. British journal of cancer 87, 21. [DOI] [PMC free article] [PubMed] [Google Scholar]
- Tumeh PC, Harview CL, Yearley JH, Shintaku IP, Taylor EJ, Robert L, Chmielowski B, Spasic M, Henry G, and Ciobanu V (2014). PD-1 blockade induces responses by inhibiting adaptive immune resistance. Nature 515, 568–571. [DOI] [PMC free article] [PubMed] [Google Scholar]
- Turner LH, Kinder JM, Wilburn A, D’Mello RJ, Braunlin MR, Jiang TT, Pham G, and Way SS (2017). Preconceptual Zika virus asymptomatic infection protects against secondary prenatal infection. PLoS pathogens 13, e1006684. [DOI] [PMC free article] [PubMed] [Google Scholar]
- Tusher VG, Tibshirani R, and Chu G (2001). Significance analysis of microarrays applied to the ionizing radiation response. Proceedings of the National Academy of Sciences 98, 5116–5121. [DOI] [PMC free article] [PubMed] [Google Scholar]
- Van Allen EM, Miao D, Schilling B, Shukla SA, Blank C, Zimmer L, Sucker A, Hillen U, Foppen MHG, and Goldinger SM (2015). Genomic correlates of response to CTLA-4 blockade in metastatic melanoma. Science 350, 207–211. [DOI] [PMC free article] [PubMed] [Google Scholar]
- Vidarsson G, Dekkers G, and Rispens T (2014). IgG subclasses and allotypes: from structure to effector functions. Frontiers in immunology 5, 520. [DOI] [PMC free article] [PubMed] [Google Scholar]
- Vogelzang A, McGuire HM, Yu D, Sprent J, Mackay CR, and King C (2008). A fundamental role for interleukin-21 in the generation of T follicular helper cells. Immunity 29, 127–137. [DOI] [PubMed] [Google Scholar]
- Waisman A, Kraus M, Seagal J, Ghosh S, Melamed D, Song J, Sasaki Y, Classen S, Lutz C, and Brombacher F (2007). IgG1 B cell receptor signaling is inhibited by CD22 and promotes the development of B cells whose survival is less dependent on Igα/β. Journal of Experimental Medicine 204, 747–758. [DOI] [PMC free article] [PubMed] [Google Scholar]
- Wang S, Jia M, He Z, and Liu X-S (2018). APOBEC3B and APOBEC mutational signature as potential predictive markers for immunotherapy response in non-small cell lung cancer. Oncogene. [DOI] [PMC free article] [PubMed] [Google Scholar]
- Wang X, Wang G, Wang Z, Liu B, Han N, Li J, Lu C, Liu X, Zhang Q, and Yang Q (2019). PD-1-expressing B cells suppress CD4+ and CD8+ T cells via PD-1/PD-L1-dependent pathway. Molecular immunology 109, 20–26. [DOI] [PubMed] [Google Scholar]
- Wein L, Luen SJ, Savas P, Salgado R, and Loi S (2018). Checkpoint blockade in the treatment of breast cancer: current status and future directions. British journal of cancer, 1. [DOI] [PMC free article] [PubMed] [Google Scholar]
- Wherry EJ, and Kurachi M (2015). Molecular and cellular insights into T cell exhaustion. Nature Reviews Immunology 15, 486. [DOI] [PMC free article] [PubMed] [Google Scholar]
- Zhang X, Lan Y, Xu J, Quan F, Zhao E, Deng C, Luo T, Xu L, Liao G, Yan M, et al. (2018). CellMarker: a manually curated resource of cell markers in human and mouse. Nucleic Acids Research 47, D721–D728. [DOI] [PMC free article] [PubMed] [Google Scholar]
Associated Data
This section collects any data citations, data availability statements, or supplementary materials included in this article.
Supplementary Materials
1
Figure S1- Somatic mutation burden and response to immune checkpoint therapy in mouse models of triple negative breast cancer. Related to Figure 2. (A) Top, overall survival of non-treated tumors and treated tumors on anti-PD1/anti-CTLA4 therapy and lower panel showing 10-day acute response to anti-PD1/anti-CTLA4 therapy demonstrated models that are resistant to immune checkpoint therapy. (B) Somatic mutation burden as called by strelka in our mouse model cohort, with samples being color coded for response as depicted. (C) Neoantigen burden as predicted by pVac-Seq; strong binders were determined by best predicted binding threshold <500mM and weak binders by predicted <2500mM binding threshold. (D) Tumor mutation burden in resistant tumors and human cancers from the depicted TCGA study cohorts. (E) Top, overall survival of non-treated and treated tumors on anti-PD1/anti-CTLA4 therapy and lower, 10-day acute response to anti-PD1/anti-CTLA4 therapy demonstrated KPB25L-Apobec and T11-UV as models that are sensitive to immune checkpoint therapy. (F) Single agent testing of anti-Pd1 or anti-Ctla4 in comparison to anti-PD1/anti-CTLA4 combination therapy, with overall survival on top and 10-day acute response showed on the lower. (G) Testing isotype control antibodies in the KPB25L and T11-Apobec models for anti-Pd1 and anti-Ctla4 shows no impact on top, overall survival, and lower, acute response. In Kaplan-Meier plots, p-value mark results of Log-rank (Mantel-Cox) test. In box and whiskers dot plots, the bar signify the average and standard deviation from average. The p-values represent two-tailed p-value from standard unmatched T-tests.
2
Figure S2- In vitro characterization of mouse tumor-derived cell lines mutagenized by Apobec3 or by exposure to short-wave ultra violet radiation. Related to Figure 2. (A) Apobec3 isoform2 over-expression in KPB25L-Apobec as compared to KPB25L parent (note the counts that isoform appropriately span/overlap exons 4 and 6 were identified using IGV sashimi plots and reported here). (B) Testing a proliferation signature(Fan et al., 2011) for median expression in Log2 normalized, uncentered, gene expression demonstrates no difference in proliferation features in KPB25L, KPB25L-Apobec, and KPB25Luv gene expression. (C) Cell counting experiment to measure proliferation in vitro to compare KPB25L parent, KPB25Luv (UV mutagenized), and KPB25L-Apobec. (D) Apobec3 isoform2 over-expression as compared to T11 parent (note the counts that isoform appropriately span/overlap exons 4 and 6 were identified using IGV sashimi plots and reported here). (E) Testing a proliferation signature(Fan et al., 2011) for median expression in Log2 normalized, uncentered, gene expression demonstrates no difference in proliferation features in T11 parent, T11-Apobec, and T11-uv gene expression. (F) Cell counting experiment to measure proliferation in vitro to compare T11 parent, T11-uv (UV mutagenized), and T11-Apobec. Cell counting experiments were done in experimental triplicate.
3
Figure S3- Supervised analysis of anti-PD1/anti-CTLA4 therapy sensitive and resistant mouse mammary tumors. Related to Figure 3. (A) An expression heatmap showing values of B cell/T cell co-cluster signature genes across RNA-seq data of sorted immune cells. Across the top, sample names as described on http://rstats.immgen.org/MyGeneSet_New/index.html. Below this, the color bar depicts the position of major immune cell types, as keyed on the right hand side. Immediately below, B cell and T cell subsets are depicted as color-coded. The heatmap depicts high expression to low expression as illustrated by the color bar. Heatmaps, clustering, and results generated using http://rstats.immgen.org/MyGeneSet_New/index.html. (B) Boxplot for expression of the immune activity cluster in pretreatment samples from a human melanoma study of anti-CTLA4 therapy (Van Allen et al., 2015). (C) Boxplot for the immune activity cluster in pretreatment samples from a human melanoma study of anti-PD1/ anti-CTLA4 therapy (Sade-Feldman et al., 2018). (D) Boxplot for expression of the immune activity cluster in pretreatment breast cancer samples from CALGB40601, trastuzumab arm (Tanioka et al., 2018). (E) Boxplot for expression of the immune activity cluster in pretreatment samples from the human breast cancer dataset GSE32646, excluding Her2+ samples; P-FEC = neoadjuvant paclitaxel followed by 5-fluorouracil/epirubicin/cyclophosphamide(Miyake et al., 2012). (F) Boxplot for expression of the immune activity cluster in pretreatment samples from the human breast cancer iSPY clinical trial; A/C/T arm = Doxorubicin hydrochloride (Adriamycin) and cyclophosphamide, followed by treatment with paclitaxel(Esserman et al., 2012). (G) Boxplot for expression of the immune activity cluster in pretreatment samples from the TNBC NCT 01560663 clinical trial(Echavarria et al., 2018). In boxplots, bars represent the average and standard deviation. The p-values represent two-tailed p-value from standard unmatched T-tests; exception in panel C where Mann-Whitney tests where used due to non-gaussian distribution. All tumors collected after 7days of treatment or non-treatment.
4
Figure S4- Validation of immune cell signatures and demonstration of key immune features for individual tumor cell lines. Related to Figure 4. (A) Gene expression signatures and flow cytometry features for T cells and B cells in tumors of the T11-Apobec tumor bearing mice without or with anti-PD1/anti-CTLA4 (or single agent) therapy. (B) Gene expression signatures and flow cytometry features for T cells and B cells in tumors of mice bearing KPB25Luv tumor model without or with anti-PD1/anti-CTLA4 (or single agent) therapy. (C) Gene expression signatures and flow cytometry features for T cells in mice bearing the T11-uv tumor model without or with anti-PD1/anti-CTLA4 therapy. (D) IgG binding assay using serum from ICI treated KPB25Luv bearing mice. Lines depict matched sera testing on parent and mutagenized cells. (E) Flow cytometry comparing the number of CD8+ T cells with effector memory status in tumors of mice receiving the parent T11 line or T11-Apobec without or with anti-PD1/anti-CTLA4 therapy. (F) A comparison of the CD8+ T cells as a ratio to CD4+ Foxp3+ T cells in individual tumor lines without or with anti-PD1/anti-CTLA4 therapy. All panels depict tumors isolated following 7 days past the therapeutic start point of a 5mm diameter tumor. In bar plots, the bar represents the average and standard deviation from average. The p-values represent two-tailed p-value from standard unmatched T-tests.
5
Figure S5- Single cell RNA-seq of T11-Apobec tumors with or without anti-PD1/anti-CTLA4 therapy. Related to Figure 5. (A) TSNE analysis of all cells that passed quality control in untreated and aPD1/aCTLA4 treated T11-Apobec tumors. Cells are color coded according to dominant cell type (identified by gene expression profiles) found in each cluster.(B) The numerical distribution of cell types between treated and non-treated tumor cells. (C) Heatmap depicting supervised analysis comparing treated and non-treated tumor cells. (D) Violin plot of Cd8a mRNA levels in cells of treated and non-treated tumor cells. (E) Heatmap for results of Seurat marker analysis of significant genes between clusters of CD8+ T cells (as identified in A), shown are significant genes along with checkpoint Pdcd1 and Ctla4 mRNA (n=20). (F) Classification of CD8+ T cell clusters based on gene expression profiles. Note the color coding is also mapped above the heatmap in E. (G) Feature plot showing expression of key markers across CD8+ T cell clusters. (H) Violin plot depicting Cd4 mRNA levels in cells of treated and non-treated tumor cells. (I) Heatmap depicting results of Seurat marker analysis of significant genes between clusters of CD4+ T cells (as identified in A), shown are significant genes along with checkpoint Pdcd1 and Ctla4 mRNA (n=20) (J) Classification of CD8+ T cell clusters based on gene expression profiles. Color coding is also mapped to the heatmap in I. (K) Feature plot showing expression of key markers across CD4+ T cell clusters. (L) Violin plot of Cd20 mRNA levels in cells of treated and non-treated tumor cells.(M) Heatmap for results of Seurat marker analysis of significant genes between clusters of B cells (as identified in A; n=20). (N) Classification of B cell clusters based on gene expression profiles. Color coding is also mapped to the heatmap in M. (O) Feature plot showing expression of key markers across B cell clusters. (P) Results of 5’ TCR/BCR sequencing. For each boxplot the number counts detected for each clone, as identified by MIXCR, is shown along with the calculated Shannon entropy (where higher values indicate high diversity/low clonality). Above each bar, indicates the percent of all reads occupied by a clone(s). Note the fourth bar groups all clones not represented by the top 3 clones. All heatmap values can be found according the legend. All violin plots depict the mean and SEM. Markers were identified using Seurat and Wilcoxon rank sum testing.
6
Figure S6- Flow cytometry analysis of targeted immune cell depletion in tumors and spleens in tumor bearing mice receiving anti-PD1/anti-CTLA4 therapy. Related to Figure 6. (A) Flow cytometry plots of CD4+ T cell depletion at tumor and spleen in tumor bearing mice receiving anti-PD1/anti-CTLA4 therapy. (B) Flow cytometry plots of CD8+ T cell depletion at tumor and spleen in tumor bearing mice receiving anti-PD1/anti-CTLA4 therapy. (C) Flow cytometry plots of CD19 inhibition at tumor and spleen in tumor bearing mice receiving anti-PD1/anti-CTLA4 therapy. (D) Flow cytometry plots of CD20+ B cell depletion at tumor and spleen in tumor bearing mice receiving anti-PD1/anti-CTLA4 therapy.
7
Figure S7- Testing B Cell Activation and IgG Functionality during immune checkpoint therapy. Related to Figure 7. (A) Left: X-Y plot depicting relationship between a IgG signature and Th1 T cell signature in sensitive tumors (mRNA-seq) at day 7 with or without therapy. Right: Boxplot of expression of a T helper 1 signature in sensitive tumors (mRNA-seq) at day 7 with or without therapy. (B) Left: X-Y plot depicting relationship between the IgG signature and a T helper 2 cells in sensitive tumors (mRNA-seq) at day 7 with or without therapy. Right: Boxplot of expression of a T helper 2 signature in sensitive tumors (mRNA-seq) at day 7 with or without therapy. (C) Feature plot of T helper 17, 1, or 2 cytokines in KPB25Luv tumor CD4+ T cell clusters. (D) Feature plot of T helper 17, 1, or 2 cytokines in T11-Apobec tumor CD4+ T cell clusters. (E) Quantification of flow cytometry for activated B cells (B220+, Cd19+, MHC II +, Cd80+ or Cd86+) in KPB25Luv tumors given aPD1/aCTLA4 therapy with or without IL21 blockade. (F) Quantification of flow cytometry for activated B cells (B220+, Cd20+, MHC II +, Cd80+ or Cd86+) in T11-Apobec tumors given aPD1/aCTLA4 therapy with or without IL21 blockade. (G) IHC staining for IgG-kappa chain in untreated,aPD1/aCTLA4 treated, or IL21blocked aPD1/CTLA4 treated T11-Apobec tumors. (H) Left: Flow cytometry plot demonstrating diphtheria toxin depletion of Foxp3+ cells exclusively in T11-Apobec tumors implanted into the Foxp3-DTR GEMM. Right top: Quantification of Tregs in WT and Foxp3-DTR GEMMs (bearing T11-Apobec) given diphtheria toxin. Right bottom: flow cytometry quantification of activated B cells in Foxp3-DTR GEMMs given diphtheria toxin (DT) to deplete Tregs. (I) 21 day acute response for KPB25Luv bearing mice given ICI or ICI with IL21 blockade. (J) 21 day acute response for T11-Apobec bearing mice given ICI or ICI with IL21 blockade. (K) Top: IHC for CD3, B220, or CD20 on day 7 T11-Apobec tumors implanted into Igmi mice demonstrates these mice to be intact for B cells and T cells. Bottom: Western blot analysis of serum IgM for Igmi mice (blue bars) or Balbc mice (purple bars) bearing T11-Apobec tumors. (L) Flow cytometry results for anti-CD16/32-FITC binding to splenocytes in mice either treated with anti-PD1/anti-CTLA4 combination therapy or anti-CD16/32 (shortened as anti-CD16) with anti-PD1/anti-CTLA4 . (M) Flow cytometry results for anti-CD16/32-FITC binding to cells in tumors of mice either treated with anti-PD1/anti-CTLA4 combination therapy or anti-CD16/32 (shortened as anti-CD16) with anti-PD1/anti-CTLA4 . In X-Y plots, p-values were determined by linear regression analysis. In box and whiskers dot plots, the bar represents the average and standard deviation from average.
8
Supplemental File 1- Supervised analysis of sensitive and resistant mouse mammary tumors at pretreatment. Related to Figure 3.
9
Data Availability Statement
The published article includes all datasets and code generated in this study. The datasets generated during this study are available at GEO Datasets GSE124821, GSE136206 and the Sequence Read Archive PRJNA506275. Please see the key resources table or contact by contacting Charles M Perou (cperou@med.unc.edu) for further information.
KEY RESOURCES TABLE
| REAGENT or RESOURCE | SOURCE | IDENTIFIER |
|---|---|---|
| Antibodies | ||
| Anti-mouse PD1 (clone RMP1-14) | Bioxcel | Cat: BE0146; RRID: AB_10949053 |
| Anti-mouse CTLA4 (clone 9D9) | Bioxcel | Cat: BE0164; RRID: AB_10949609 |
| Anti-mouse CD4 (clone GK1.5) | Bioxcel | Cat: BE0003-1; RRID: AB_1107636 |
| Anti-mouse CD8a (clone 53-6.7) | Bioxcel | Cat: BE0004-1; RRID: AB_1107671 |
| Anti-mouse CD19 (clone 1D3) | Bioxcel | Cat: BE0150; RRID: AB_10949187 |
| Anti-mouse CD16/32 (clone 2.4G2) | Bioxcel | Cat: BE0307; RRID: AB_2736987 |
| Anti-mouse CD20 (clone SA271G2) | Biolegend | Cat: 152104; RRID: AB_2629619 |
| Anti-mouse IL21 (clone FFA21) | Thermofisher | Cat: 16-7211-82; RRID: AB_1963610 |
| Mouse IgG2b Isotype Control (clone MPC-11) | Bioxcel | Cat: BE0086; RRID: AB_1107791 |
| Rat IgG2a Isotype Control (clone 2A3) | Bioxcel | Cat: BE0089; RRID: AB_1107769 |
| Anti-mouse CD45, eFluor 450 (clone 30-F11) | Thermofisher | Cat: 48-0451-82; RRID: AB_1518806 |
| Anti-mouse B220 (CD45R), BV785 (clone RA3-6B2) | Biolegend | Cat: 103246; RRID: AB_2563256 |
| Anti-mouse CD19, APC-H7 (clone 1D3) | BD Biosciences | Cat: 560245; AB_1645233 |
| Anti-mouse CD20, PE (clone AISB12) | Thermofisher | Cat: 12-0201-80; RRID: AB_1210737 |
| Anti-mouse I-A/I-E (MHC II); BV5210 (clone M5/114.15.2) | Biolegend | Cat: 107636; RRID: AB_2734168 |
| Anti-mouse CD80; APC (clone 16-10A1) | Biolegend | Cat: 104714; RRID: AB_313135 |
| Anti-mouse CD86; Fitc (clone GL1) | BD Biosciences | Cat: 561962; RRID: AB_10896136 |
| Anti-mouse CD16/32; Fitc (clone 2.4G2) | BD Biosciences | Cat: 553144; RRID: AB_394659 |
| Anti-mouse CD3; Fitc (clone 17A2) | Thermofisher | Cat: 11-0032-82; RRID: AB_2572431 |
| Anti-mouse CD4; BV510 (clone GK1.5) | Biolegend | Cat: 100449; RRID: AB_2564587 |
| Anti-mouse CD8a ; APH-H7 (clone 53-6.7) | BD Biosciences | Cat: 560182; RRID: AB_1645237 |
| Anti-mouse CD44; PerCP-Cyanine5.5 (clone IM7) | Thermofisher | Cat: 45-0441-82; RRID: AB_925746 |
| Anti-mouse CD62L; APC (clone MEL-14) | BD Biosciences | Cat: 553152; RRID: AB_398533 |
| Anti-mouse FOXP3; PE (clone FJK-16s) | Thermofisher | Cat: 12-5773-82; RRID: AB_465936 |
| Anti-mouse CD20; (clone SP32) | Abcam | Cat: ab64088; RRID: AB_1139386 |
| Anti-mouse B220/CD45R; (clone RA3-6B2) | Abcam | Cat: ab64100; RRID: AB_1140036 |
| Anti-mouse CD3;DAB (polyclonal) | Abcam | Cat: ab5690; RRID: AB_305055 |
| Anti-mouse IgG-Kappa; (clone RM103) | Abcam | Cat: ab190484; RRID:AB_2811042 |
| Anti-mouse IgM, HRP (polyclonal) | Biorad | Cat: 5276-2504; RRID: AB_619904 |
| Anti-mouse IgG1, HRP (polyclonal) | Biorad | Cat: OBT1508P; RRID: AB_619901 |
| Anti-rabbit IgG Cross-adsorbed, Unconjugated (polyclonal) | Thermofisher | Cat: 31213 ; RRID: AB_228376 |
| Anti-mouse IgG, Alexa Fluor 488 (polyclonal) | Thermofisher | Cat: A-11001; RRID: AB_2534069 |
| Anti-rabbit IgG, HRP | Ventana Medical Systems | Cat: 760-4311; RRID:AB_2811043 |
| Bacterial and Virus Strains | ||
| Biological Samples | ||
| 2336R Tumor Transplant Line2153L Tumor Transplant Line2225L Tumor Transplant Line2224L Tumor Transplant Line9263-3F Tumor Transplant Line | Tp53−/− Tumors (Jerry et al., 2000, Herschkowitz et al., 2012)This paperPerou Lab | NA |
| Chemicals, Peptides, and Recombinant Proteins | ||
| Fixable viability stain 700 | BD Biosciences | Cat: 564997 |
| Rodent Decloaker, 10XPretreatment Reagent | Biocare Medical | Cat: RD913 L, M |
| Critical Commercial Assays | ||
| TruSeq Stranded mRNA | Illumina | TruSeq® Stranded mRNA Library Prep (48 Samples) 20020594 |
| Chromium Single Cell 3' Reagent Kits | 10x Genomics | Chromium™Single Cell 3’ Library & Gel Bead Kit v2, PN-120237Single Cell 3’ Chip Kit v2 PN-12023i7 Multiplex Kit PN-120262 |
| MACS Tumor Dissociation Kit, mouse | Miltenyi Biotech | Tumor dissociation kit # 130-096-730 |
| ChromoMap DAB kit | Ventana Medical Systems | Cat: 760-159 |
| Qiagen DNeasy blood and tissue kit | Qiagen | Cat: 69506 |
| Qiagen RNeasy Mini Kit | Qiagen | Cat: 74104 |
| Mouse IFN-γ ELISA Kit II | BD Biosciences | Cat: 558258 |
| SMARTer Mouse BCR IgG H/K/L Profiling Kit | Takara | Cat: 634422 |
| SMARTer Mouse TCR a/b Profiling Kit | Takara | Cat: 634402 |
| Agilent Sure Select XT kit | Agilent | Cat: G9611B |
| Agilent SureSelect Mouse All Exon | Agilent | Cat: 5190-4642 |
| eBioscience FoxP3 staining kit | Thermofisher | Cat: 00-5523-00 |
| Deposited Data | ||
| Raw and normalized data; microarray | Miyake et al., 2012 | GSE32646 |
| Raw and normalized data; microarray | Esserman et al., 2012 | GSE22226 |
| Raw data; RNA-seq | Tanioka et al., 2018 | GSE116335 |
| Raw data; RNA-seq | Van Allen et al., 2015 | DbGAP phs000452.v2.p1 |
| Raw data; RNA-seq | Echavarria et al., 2018 | https://doi.org/10.1158/1078-0432.CCR-17-1912 |
| Raw and normalized data; single-cell RNA-seq | Sade-Feldman et al., 2018 | GSE120575 |
| Raw data and normalized data; RNA-seq | This paper | GSE124821; PRJNA506275 |
| Raw data and normalized data; RNA-seq | Pfefferle et al., 2019 | GSE118164 |
| Raw and normalized data; scRNA-seq | This paper | GSE136206 |
| Experimental Models: Cell Lines | ||
| KPB25L-ParentKPB25LuvKPB-Apobec | K14-Cre;Tp53 f/f Brca1 f/fParent model-(Hollern et al., 2018)Mutagenized- This paperPerou Lab | NA |
| T11- ParentT11-uvT11-Apobec | Tp53−/− Parent model-(Jerry et al. 2000 ; Herschkowitz et al., 2012)Mutagenized- This paperPerou Lab | NA |
| Experimental Models: Organisms/Strains | ||
| Mouse: FVB/NJ | The Jackson Laboratory | JAX: 001800 |
| Mouse: Balb/cJ | The Jackson Laboratory | JAX: 000651 |
| Mouse: Igmi | Waisman et al., 2007Serody lab- UNC | NA |
| Oligonucleotides | ||
| Igmi Mice Genotyping Primers: 5’GAGACGAGGGGGAAGACATTTG3’,5’CCTTCCTCCTACCCTACA AGCC3’ | Waisman et al., 2007 | NA |
| Recombinant DNA | ||
| Apobec3 plasmid | VectorBuilder | VB170110-1098xwd |
| Software and Algorithms | ||
| Seurat (version 2.3.4) | Satija et al., 2015Butler et al., 2018 | https://github.com/satijalab/seurat |
| MIXCR (version 2.1.9-6) | Bolotin et al., 2015 | https://github.com/milaboratory/mixcr/ |
| R (3.5.1) | R Core Team (2018) | https://www.R-project.org/ |
| R Studio | R Studio | https://www.rstudio.com |
| STAR aligner | Dobin et al., 2013 | https://github.com/alexdobin/STAR |
| SALMON | Patro et al., 2015 Patro et al., 2017 | https://combine-lab.github.io/salmon/ |
| Picard | Broad Institute | https://broadinstitute.github.io/picard/ |
| Cluster 3.0 | de Hoon et al., 2004 | http://bonsai.hgc.jp/~mdehoon/software/cluster/software.htm |
| Java TreeView | NA | http://bonsai.hgc.jp/~mdehoon/software/cluster/software.htm |
| FlowJo (version 10) | FlowJo, LLC | https://www.flowjo.com/solutions/flowjo/downloads/ |
| CellRanger (version 3.0.2) | 10X Genomics | https://support.10xgenomics.com/single-cell-gene-expression/software/pipelines/latest/what-is-cell-ranger |
| pVAC seq | Hundal et al., 2016 | https://pvac-seq.readthedocs.io/en/latest/ |
| IMMGEN MyGeneSet | Heng et al., 2008 | http://rstats.immgen.org/MyGeneSet_New/index.html |
| IGV | Broad Institute | http://software.broadinstitute.org/software/igv/userguide |
| Vegan | vegan: Community Ecology Package | https://cran.r-project.org/web/packages/vegan/vegan.pdf |
| GraphPad Prism | GraphPad Software | https://www.graphpad.com/ |
| Significance Analysis of Microarrays | Tusher et al., 2001 | https://CRAN.R-project.org/package=samr |
| SAMtools | Li H et al. 2009 | http://www.htslib.org |
| Biobambam | Tischler and Leonard, 2014 | https://github.com/gt1/biobambam |
| BWA mem | Li 2013 | http://bio-bwa.sourceforge.net |
| Strelka | Saunders et al., 2012 | https://github.com/Illumina/strelka |
| SigClust | Huang et al., 2015 | https://cran.r-project.org/web/packages/sigclust/index.html |
| Other | ||
| Matrigel® Basement Membrane Matrix | Corning | Cat: 354234 |
| HUMEC READY MEDIUM-(With supplement) | Life Technologies Inc. | Cat: 12752010 |
| RPMI 1640 | Life Technologies Inc. | Cat: 11875093 |
| DMEM | Life Technologies Inc. | Cat: 11995065 |
| Discovery antibody diluent | Ventana Medical Systems | Cat: 760-108 |
| FUGENE Transfection reagent | Promega | Cat: E2311 |