Lysosome Positioning Influences mTORC2 and AKT Signaling (original) (raw)
. Author manuscript; available in PMC: 2020 Aug 25.
Summary
Growth factor signaling is initiated at the plasma membrane and propagated through the cytoplasm for eventual relay to intracellular organelles such as lysosomes. The serine/threonine kinase mTOR participates in growth factor signaling as a component of two complexes, mTORC1 and mTORC2. mTORC1 associates with lysosomes and its activity depends on the positioning of lysosomes within the cytoplasm, although there is no consensus regarding the importance of perinuclear vs. peripheral distribution. mTORC2 and its substrate kinase AKT have a widespread distribution, but they are thought to act mainly at the plasma membrane. Using cell lines with knock out of components of the lysosome-positioning machinery, we demonstrate that perinuclear clustering of lysosomes delays reactivation of not only mTORC1 but also mTORC2 and AKT upon serum replenishment. We also show partial association of mTORC2 and AKT with lysosomes. These experiments demonstrate that mTORC1, mTORC2 and AKT constitute a module for growth factor signaling that is sensitive to lysosome positioning.
Introduction
Growth factor signaling is initiated at the plasma membrane and propagated through the cytoplasm for eventual relay to target organelles such as lysosomes and the nucleus. Because this process requires transmission of the signals over the expanse of the cytoplasm, the ultimate responses would be expected to depend on the positioning of the target organelles. In most cases, however, the influence of organelle positioning on growth factor signaling remains poorly understood.
Recent studies have begun to address how the positioning of late endosomes and lysosomes regulates the activity of the atypical serine/threonine kinase mechanistic target of rapamycin (mTOR) in response to growth factors and nutrients. In mammalian cells, mTOR exists as a subunit of two distinct complexes: mTORC1 (additionally composed of mLST8, DEPTOR, PRAS40 and RAPTOR subunits) and mTORC2 (additionally composed of mLST8, DEPTOR, mSIN1 and RICTOR subunits) (Saxton and Sabatini, 2017) (Fig. 1A). The mTORC1 complex is activated at the lysosomal membrane by interactions with Rheb and Rag small GTPases (Fig. 1A) (Long et al., 2005, Sancak et al., 2010), and functions to regulate cell metabolism, growth and survival downstream of various stimuli (Saxton and Sabatini, 2017). Binding of growth factors such as insulin or insulin-like growth factors to their cognate receptors at the cell surface results in sequential activation of several lipid and protein kinases, including class I phosphatidylinositol 3-kinase (PI3K), phosphoinositide-dependent protein kinase-1 (PDK1) and protein kinase B (PKB, herein referred to by the alternative name AKT) (Dibble and Cantley, 2015, Manning and Toker, 2017) (Fig. 1A). This kinase cascade leads to phosphorylation of the TSC2 subunit of the tuberous sclerosis complex (TSC) (additionally composed of TSC1 and TBC1D7 subunits), inhibiting its function as a GTPase-activating protein (GAP) for Rheb at the lysosomal membrane (Fig. 1A) (Inoki et al., 2002, Potter et al., 2002). The resulting stabilization of active Rheb induces allosteric activation of mTORC1 (Long et al., 2005). For this activation to take place, however, mTORC1 must be recruited to the lysosomal membrane through another pathway that begins with sensing of amino-acid levels in the lumen of lysosomes by the multispanning transceptor protein SLC38A9 (Jung et al., 2015, Rebsamen et al., 2015, Wang et al., 2015). High amino-acid levels enhance the interaction of SLC38A9 with the multiprotein Ragulator complex (composed of LAMTOR1–5 subunits) and with a dimer of Rag GTPases (RagA/B and Rag C/D). Ragulator and SLC38A9 activate the Rags (Bar-Peled et al., 2012, Shen and Sabatini, 2018), leading to the recruitment of mTORC1 to the lysosomal membrane (Sancak et al., 2010) (Fig. 1A). Activated mTORC1 catalyzes the phosphorylation of many substrates, including the ribosomal protein S6 kinase (S6K) and eukaryotic translation initiation factor 4E-binding protein (4E-BP) (Burnett et al., 1998), as well as the autophagy activating kinase ULK1 (Kim et al., 2011), thus promoting protein synthesis while simultaneously inhibiting autophagy.
Figure 1. Juxtanuclear clustering of lysosomes does not affect basal mTORC1 activity.
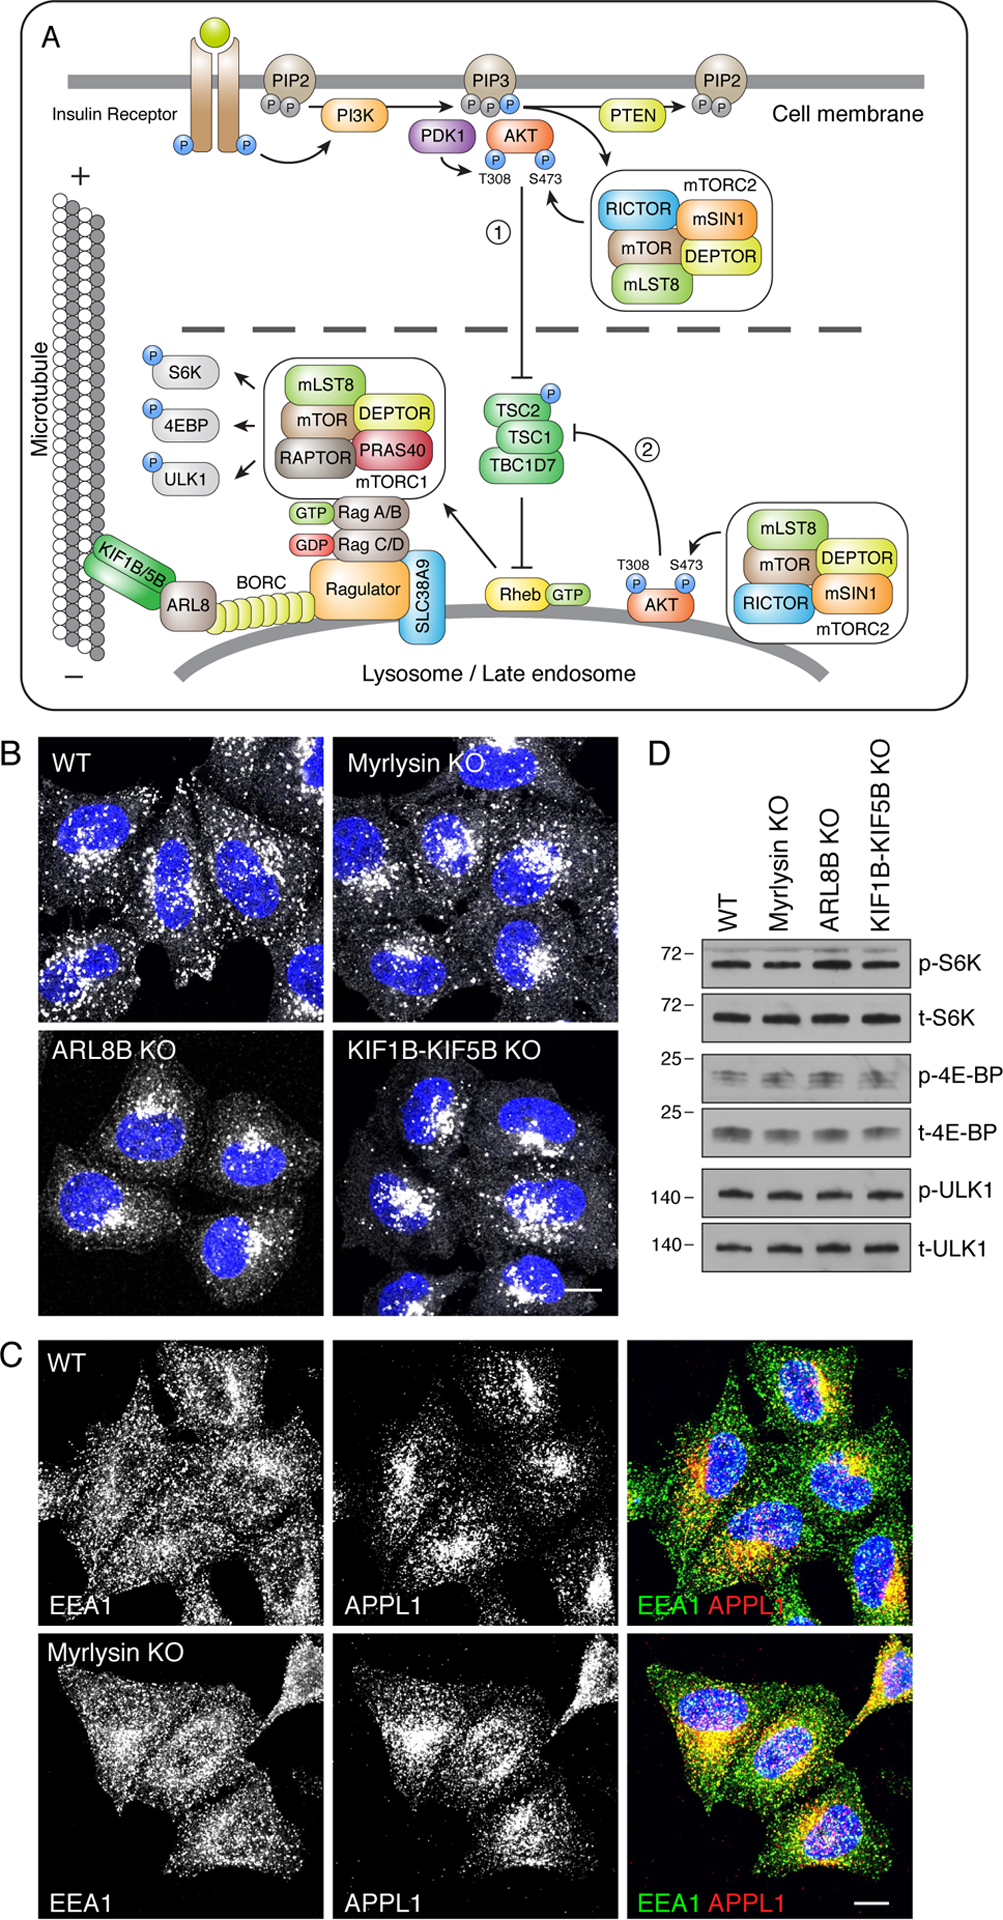
(A) Schematic representation of the PI3K-mTORC2-AKT-mTORC1 signaling pathway for the insulin receptor. Only selected components of this pathway are shown; for additional details see Saxton and Sabatini, 2017. mTORC1 is shown to function at the lysosomal membrane, according to Sancak et al., 2010. mTORC2 and AKT, on the other hand, are shown to act at both the plasma membrane (1) and lysosomes (2), the latter as revealed by our results. Ragulator is shown to connect mTORC1 activation with BORC-regulated lysosome movement (Pu et al., 2017, Filipek et al., 2017). The dashed line represents the spatial gap between signaling modules at the plasma membrane and lysosomes, which varies with lysosome positioning. (B) Confocal microscopy of WT, myrlysin-KO, ARL8B-KO and KIF1B-KIF5B-KO HeLa cells immunostained for LAMP1 and nuclear DNA (DAPI, blue). Scale bar: 10 μm. (C) Confocal microscopy of WT and myrlysin-KO HeLa cells immunostained with antibodies to EEA1 and APPL1. Scale bar: 10 μm. (D) Lysates of WT, myrlysin-KO, ARL8B-KO and KIF1B-KIF5B-KO HeLa cells were analyzed by immunoblotting for phosphorylated S6K (p-S6K), total S6K (t-S6K), phosphorylated 4E-BP (p-4E-BP), total 4E-BP (t-4E-BP), phosphorylated ULK1 (p-ULK1) and total ULK1 (t-ULK1). The positions of molecular mass markers (in kDa) are indicated on the left.
The precise intracellular distribution of mTORC2 is less well established. Different studies have variously reported localization of mTORC2 to the plasma membrane, Golgi, ribosomes, mitochondria, endosomes and lysosomes (Schroder et al., 2007, Berchtold and Walther, 2009, Oh et al., 2010, Boulbés et al., 2011, Zinzalla et al., 2011, Betz et al., 2013, Partovian et al., 2008, Arias et al., 2015, Ebner et al., 2017). mTORC2 was originally shown to regulate the actin cytoskeleton (Sarbassov et al., 2004), but subsequent studies revealed that it also plays a role in regulating cell metabolism and survival downstream of growth factor signaling (Sarbassov et al., 2005). This role involves phosphorylation of AKT at Ser473 (Hresko and Mueckler, 2005), which together with a PDK1-catalyzed phosphorylation at Thr308 (Stephens et al., 1998), results in maximal AKT activation (Fig. 1A). mTORC2 thus participates in the mTORC1 pathway, augmenting mTORC1 activation in response to growth factor stimulation.
In a landmark study, David Rubinsztein and colleagues (Korolchuk et al., 2011) showed that the positioning of lysosomes/late endosomes within the cytoplasm influences mTORC1 activation by both serum (a source of growth factors) and amino acids (lysosomes/late endosomes are henceforth indistinctly referred to as “lysosomes”). In that study, lysosome positioning was manipulated by knock down (KD) or overexpression of proteins that mediate anterograde transport of lysosomes on microtubules, such as the small GTPase ARL8B and the kinesin motors KIF2 and KIF1Bβ. Juxtanuclear clustering of lysosomes by ARL8B or KIF2A KD inhibited the activity of mTORC1 under basal conditions as well as upon recovery from nutrient starvation (Korolchuk et al., 2011). Conversely, peripheral scattering of lysosomes by overexpression of ARL8B, KIF2A or KIF1Bβ enhanced mTORC1 activity under both basal and nutrient-recovery conditions (Korolchuk et al., 2011). These results were interpreted to mean that the distance of lysosome-associated mTORC1 from upstream regulators such as plasma membrane-associated AKT determines the kinetics and extent of mTORC1 activation (Korolchuk et al., 2011).
In contrast, a more recent study arrived at the opposite conclusion regarding the effect of lysosome positioning on mTORC1 activation (Walton et al., 2018). In this case, peripheral dispersal of lysosomes by acidification of the culture medium (Heuser, 1989) was found to inhibit mTORC1 signaling (Walton et al., 2018). This finding is in line with previous studies showing that maintenance of the juxtanuclear localization of mTORC1 by human cytomegalovirus (HCMV) infection prevented inactivation of mTORC1 under amino-acid-free conditions (Clippinger et al., 2011), and that peripheral redistribution of mTORC1 by KD or pharmacologic inhibition of the retrograde microtubule motor dynein inhibited mTORC1 activity in both uninfected and HCMV-infected cells (Clippinger and Alwine, 2012). These effects were attributed to the distance of mTORC1 from a pool of Rheb localized to a juxtanuclear, non-lysosomal compartment that was insensitive to acidification, HCMV infection or dynein inhibition. The effect of lysosome positioning on mTORC2 activity was not examined in any of these studies.
Given the apparent discrepancies in these findings, we decided to use a panel of cell lines with CRISPR/Cas9 KO of various components of the lysosome-positioning machinery to re-examine the relationship between mTORC1 activation and lysosome positioning, and to elucidate the mechanisms involved. Although any manipulation of gene expression may have unintended consequences, the use of KO cell lines avoids the incomplete silencing and off-target effects of siRNA-mediated KD and the less specific effects of acidification or HCMV infection. Using these lines, we find that juxtanuclear clustering of lysosomes has no effect on basal mTORC1 activity but delays the recovery of mTORC1 activity from serum depletion. Unexpectedly, juxtanuclear clustering of lysosomes additionally delays the recovery of TSC2 phosphorylation by AKT, as well as Ser473 AKT phosphorylation by mTORC2, indicating that the reactivation of these kinases is also sensitive to lysosome positioning. In line with these observations, subcellular fractionation and confocal microscopy analyses reveal the presence of discrete pools of mTORC2 and AKT on lysosomes. These results demonstrate that juxtanuclear localization of lysosomes inhibits mTORC1 reactivation by serum refeeding, most likely because of the previously proposed distancing of lysosome-associated mTORC1 from plasma-membrane-associated growth factor receptors and proximal signaling molecules (Korolchuk et al., 2011). However, mTORC1 reactivation under these conditions relies on populations of mTORC2 and AKT that are also sensitive to lysosome positioning, possibly because of their partial association with the lysosomal membrane. These findings place pools of mTORC2 and AKT at the distal end of the spatial-temporal gap that separates growth factor receptors at the plasma membrane from signaling modules at the lysosomal membrane.
Results
Juxtanuclear Clustering of Lysosomes Delays Reactivation of mTORC1 by Serum
Lysosomes are normally distributed throughout the cytoplasm, though with a higher concentration in the juxtanuclear area of the cell (Pu et al., 2016, Bonifacino and Neefjes, 2017) (Fig. 1B, WT HeLa cells). In previous work, we showed that the localization of a population of lysosomes to the peripheral cytoplasm depends on BORC, a multiprotein complex composed of eight subunits named BLOS1 (also known as BORCS1 and BLOC1S1), BLOS2 (BORCS2/BLOC1S2), snapin (BORCS3), KXD1 (BORCS4), myrlysin (LOH12CR1/BORCS5), lyspersin (C17orf59/BORCS6), diaskedin (C10orf32/BORCS7) and MEF2BNB (BORCS8) (Pu et al., 2015, Guardia et al., 2016, Jia et al., 2017). BORC associates with the lysosomal membrane to promote the recruitment of the paralogous small GTPases ARL8A and ARL8B (Pu et al., 2015, Guardia et al., 2016), probably by acting as a GEF for ARL8A/ARL8B (Niwa et al., 2017) (Fig. 1A). In turn, activated ARL8A and ARL8B recruit two distinct kinesins, KIF1Bβ and KIF5B (the latter via the adaptor protein SKIP), to lysosomes, driving their centrifugal movement along microtubule tracks (Rosa-Ferreira and Munro, 2011, Mrakovic et al., 2012, Guardia et al., 2016) (Fig. 1A). Consistent with this mechanism, KO of any of the BORC subunits, ARL8B (the most abundant paralog in HeLa cells) or both KIF1B and KIF5B (KIF1B-KIF5B) in HeLa cells caused a collapse of the lysosomal population to the juxtanuclear area of the cell (Fig. 1B) (Pu et al., 2015, Guardia et al., 2016, Jia et al., 2017). These effects were specific to lysosomes, as myrlysin KO did not affect the distribution of two distinct populations of early endosomes labeled for EEA1 and APPL1 (Fig. 1C). We took advantage of these KO cell lines to assess the importance of the peripheral location of lysosomes for mTORC1 signaling. We observed that juxtanuclear clustering of lysosomes caused by KO of the myrlysin subunit of BORC, ARL8B or KIF1B-KIF5B, had no effect on the phosphorylation of the mTORC1 substrates S6K, 4E-BP and ULK1 under normal conditions of culture [i.e., complete Dulbecco’s Modified Eagle Medium (DMEM) with 10 % fetal bovine serum (FBS) and 2 mM glutamine] (Fig. 1D) (see also Pu et al., 2015, Jia et al., 2017).
mTORC1 is inactivated by removal of amino acids or serum, and reactivated upon addition of these nutrients to the culture medium (Saxton and Sabatini, 2017). To determine whether juxtanuclear clustering of lysosomes affected mTORC1 inactivation or reactivation, we measured S6K phosphorylation after various regimens of amino-acid and/or serum deprivation-refeeding of wild-type (WT) or myrlysin-KO cells (Fig. 2A). We observed that combined amino-acid (AAs) and serum depletion inhibited S6K phosphorylation, and that this could not be reversed by subsequent refeeding with only glutamine, amino acids or serum in both WT and myrlysin-KO cells (Fig. 2A). In contrast, refeeding with a combination of both amino acids and serum caused a time-dependent recovery of phosphorylated S6K (p-S6K) levels (Fig. 2A). Interestingly, this recovery was delayed in myrlysin-KO relative to WT HeLa cells (e.g., compare 15- and 30-min time points) (Fig. 2A). Delayed mTORC1 reactivation could also be seen upon serum refeeding of serum-deprived cells, but not amino-acid refeeding of amino-acid-deprived cells (Fig. 2A). These results indicated that myrlysin KO caused delayed reactivation of mTORC1 by serum but not amino-acid replenishment. Thus, BORC influences mTORC1 reactivation downstream of serum signaling but not amino-acid sensing pathways.
Figure 2. KO of BORC subunits, ARL8B or KIF1B-KIF5B delays reactivation of mTORC1 upon serum refeeding.
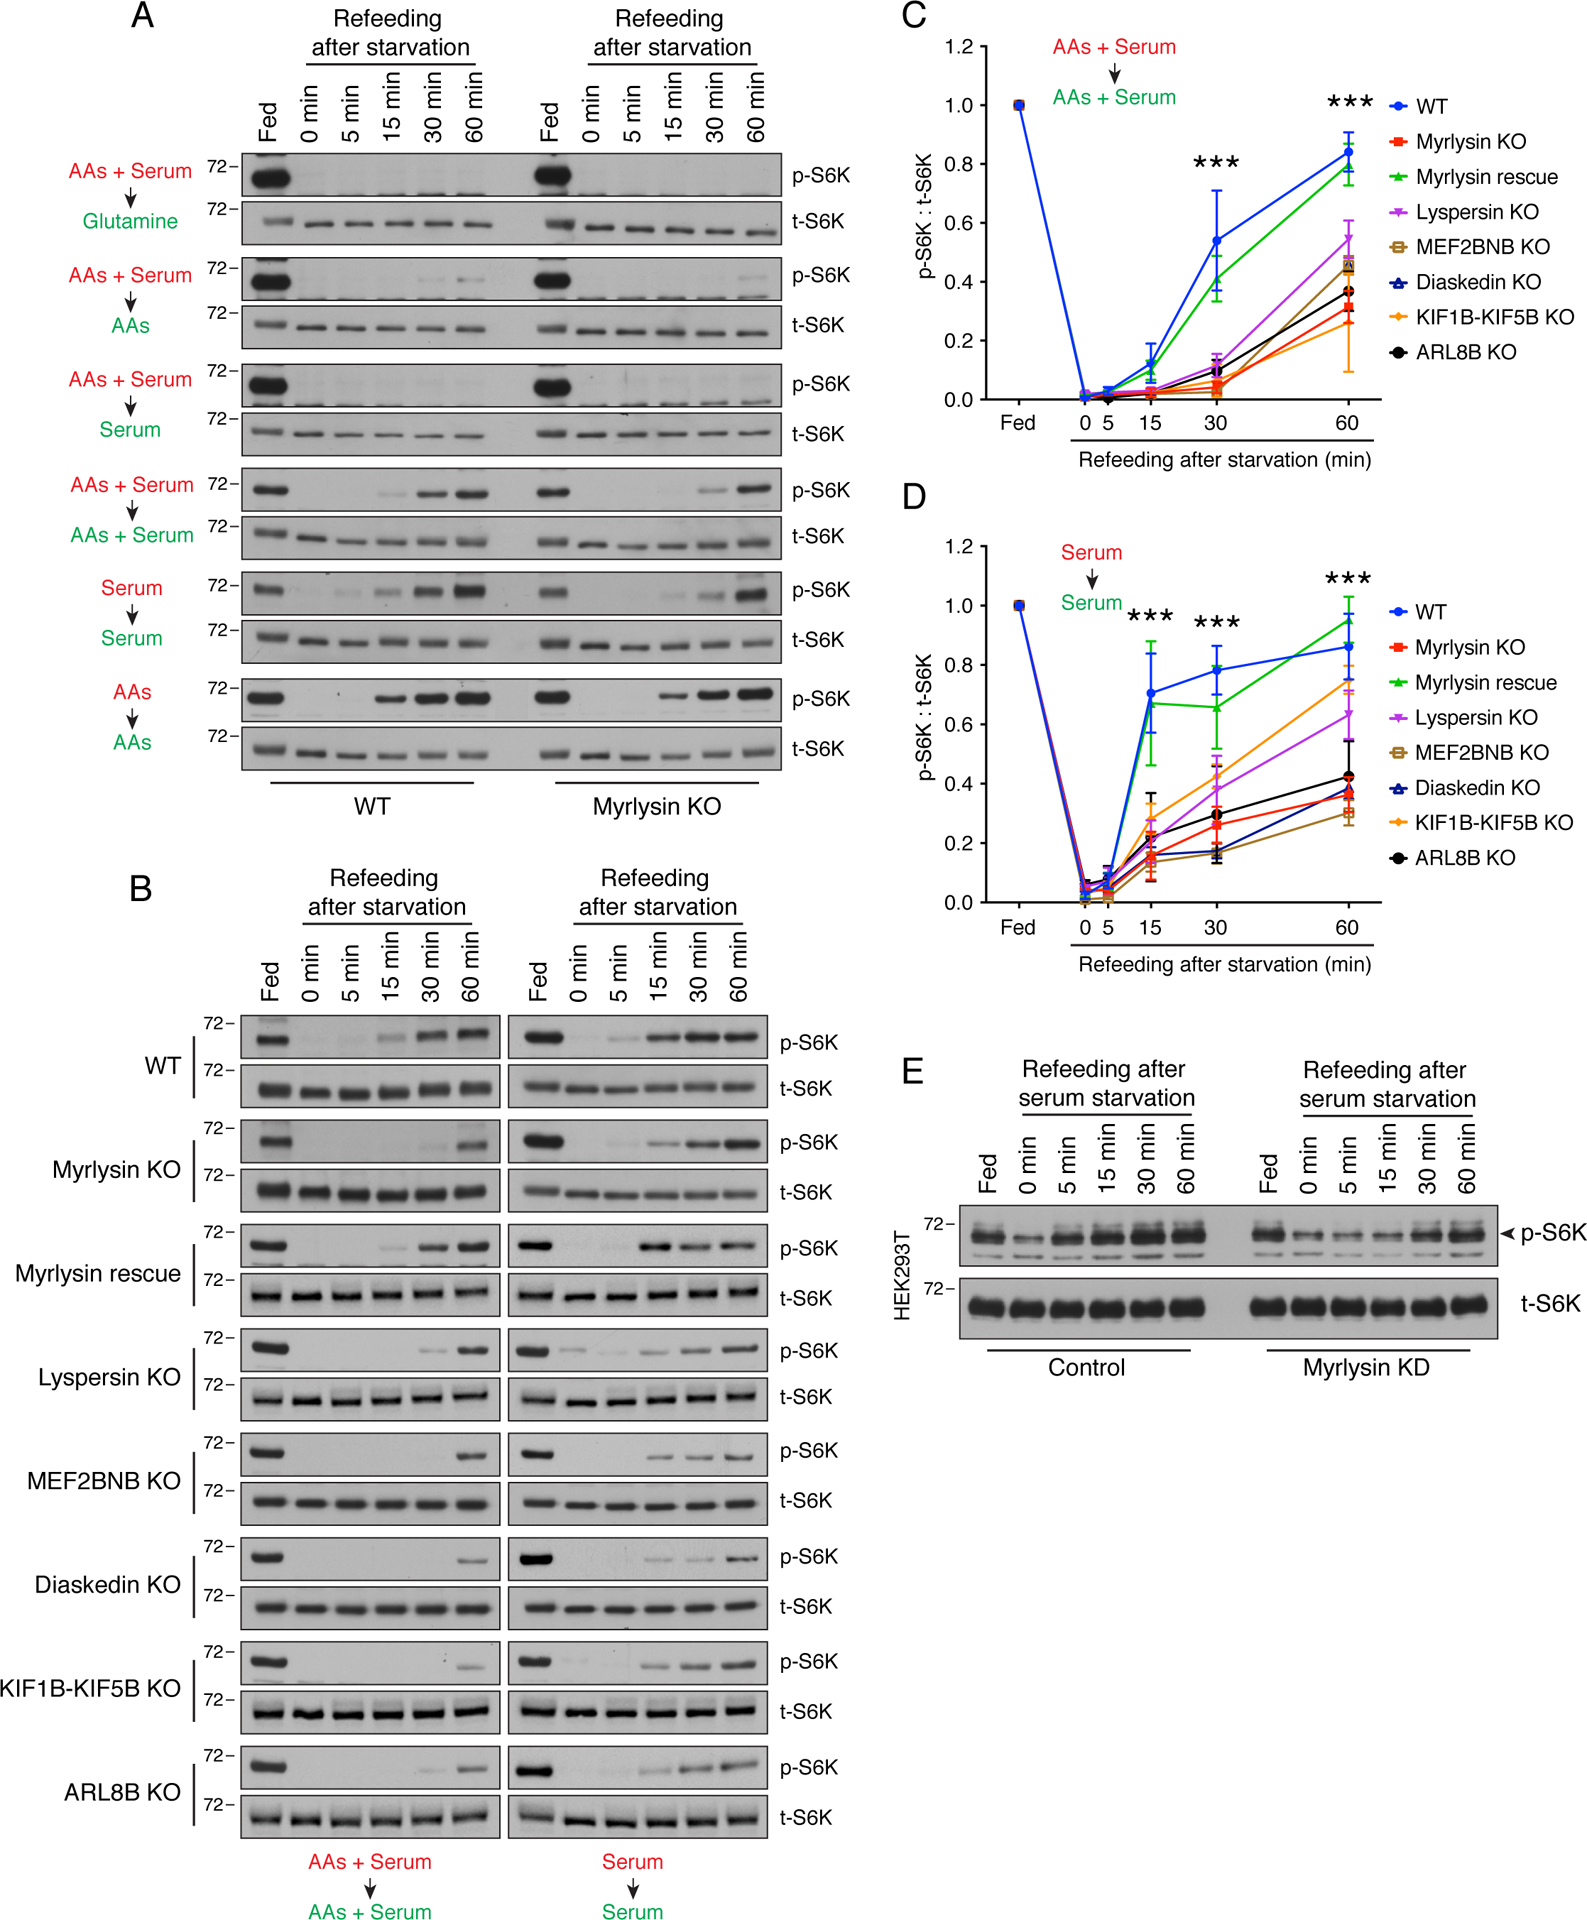
(A) WT and myrlysin-KO HeLa cells were incubated in medium depleted of the indicated nutrients (highlighted in red) for 30 min [combined amino acids (AAs) and serum starvation] or 1 h (either AAs or serum starvation), and then refed with the corresponding nutrients (highlighted in green) for the indicated periods. Cells were subsequently lysed with LDS loading buffer and subjected to SDS-PAGE and immunoblotting for phosphorylated S6K (p-S6K) and total S6K (t-S6K). (B) WT, myrlysin-KO, myrlysin-rescue, lyspersin-KO, MEF2BNB-KO, diaskedin-KO, KIF1B-KIF5B-KO and ARL8B-KO HeLa cells were starved for 30 min in medium depleted of both amino acids and serum, or 1 h in serum-depleted medium, followed by supplementation with the corresponding nutrients for the indicated periods. Cells were analyzed as in A. (C) Quantification of p-S6K relative to t-S6K in combined amino-acids and serum starvation-refeeding conditions. (D) Quantification of p-S6K relative to t-S6K in serum starvation-refeeding conditions. In C and D, values are the mean ± SEM from three independent experiments such as that shown in B. ***p < 0.0001 (WT vs. myrlysin KO) using two-way ANOVA with Tukey’s multiple comparisons test. (E) HEK293T cells were transfected with control and myrlysin-targeting siRNAs (KD), and then subjected to serum starvation and refeeding. Cells were analyzed as in A. In A, B and E, the positions of molecular mass markers (in kDa) are indicated on the left.
Further studies showed that re-expression of myrlysin in myrlysin-KO cells (i.e., “myrlysin rescue”) restored the normal kinetics of mTORC1 reactivation after starvation-refeeding of serum plus amino acids, or starvation-refeeding of only serum (Fig. 2B–D). We also found that KO of the lyspersin, MEF2BNB or diaskedin subunits of BORC in HeLa cells delayed mTORC1 reactivation to similar extents as myrlysin KO (Fig. 2B–D). Likewise, ARL8B- or KIF1B-KIF5B-KO HeLa cells exhibited delayed mTORC1 reactivation relative to WT cells (Fig. 2B–D), further demonstrating that changes in lysosome positioning, and not just BORC deficiency, underlie the altered kinetics of mTORC1 reactivation. siRNA-induced silencing of myrlysin in the embryonic kidney HEK293T cells also resulted in delayed recovery of mTORC1 activity upon addition of serum to serum-starved cells (Fig. 2E), demonstrating that the effects of myrlysin depletion were not limited to HeLa cells. Taken together, the above experiments indicated that juxtanuclear clustering of lysosomes caused by interference with the BORC/ARL8/KIF1B-KIF5B ensemble impaired mTORC1 reactivation by serum refeeding after serum deprivation.
Reactivation of mTORC2 and AKT by Serum is also Impaired by Juxtanuclear Clustering of Lysosomes
To determine whether or not lysosome positioning affected growth factor signaling upstream of mTORC1, we examined the effect of serum deprivation and refeeding on the phosphorylation of other components of this pathway in WT vs. myrlysin-KO HeLa cells. Because insulin is a major anabolic factor present in serum, we focused our analyses on signaling by the insulin receptor (IR) tyrosine kinase (Petersen and Shulman, 2018). FACS analysis showed that the surface expression of the IR was unaffected by myrlysin KO under both serum starvation and refeeding conditions (Fig. 3A). Myrlysin KO also had no effect on the basal phosphorylation of IR (autophosphorylation), PDK1 (at residue S241), AKT (T308 catalyzed by PDK1 and S473 catalyzed by mTORC2) and TSC2 (T1462 catalyzed by AKT) (Figs. 1A and 3B, fed lanes). Serum depletion reduced phosphorylation of the IR, AKT-S473 and TSC2 to similar extents in WT vs. myrlysin-KO cells (Fig. 3B, 0 min refeeding lanes). Phosphorylation of PDK1-S241 and AKT-T308, on the other hand, was not affected by serum depletion (Fig. 3B), in agreement with previous reports (Casamayor et al., 1999, Scheid et al., 2005). Serum replenishment induced only partial recovery of IR phosphorylation, albeit with similar kinetics in WT vs. myrlysin-KO cells (Fig. 3B). On the other hand, the recovery of AKT-S473 and TSC2 phosphorylation was delayed in myrlysin-KO relative to WT cells (compare 5 min time points, Fig. 3B–D).
Figure 3. Myrlysin KO delays reactivation of mTORC2 and AKT.
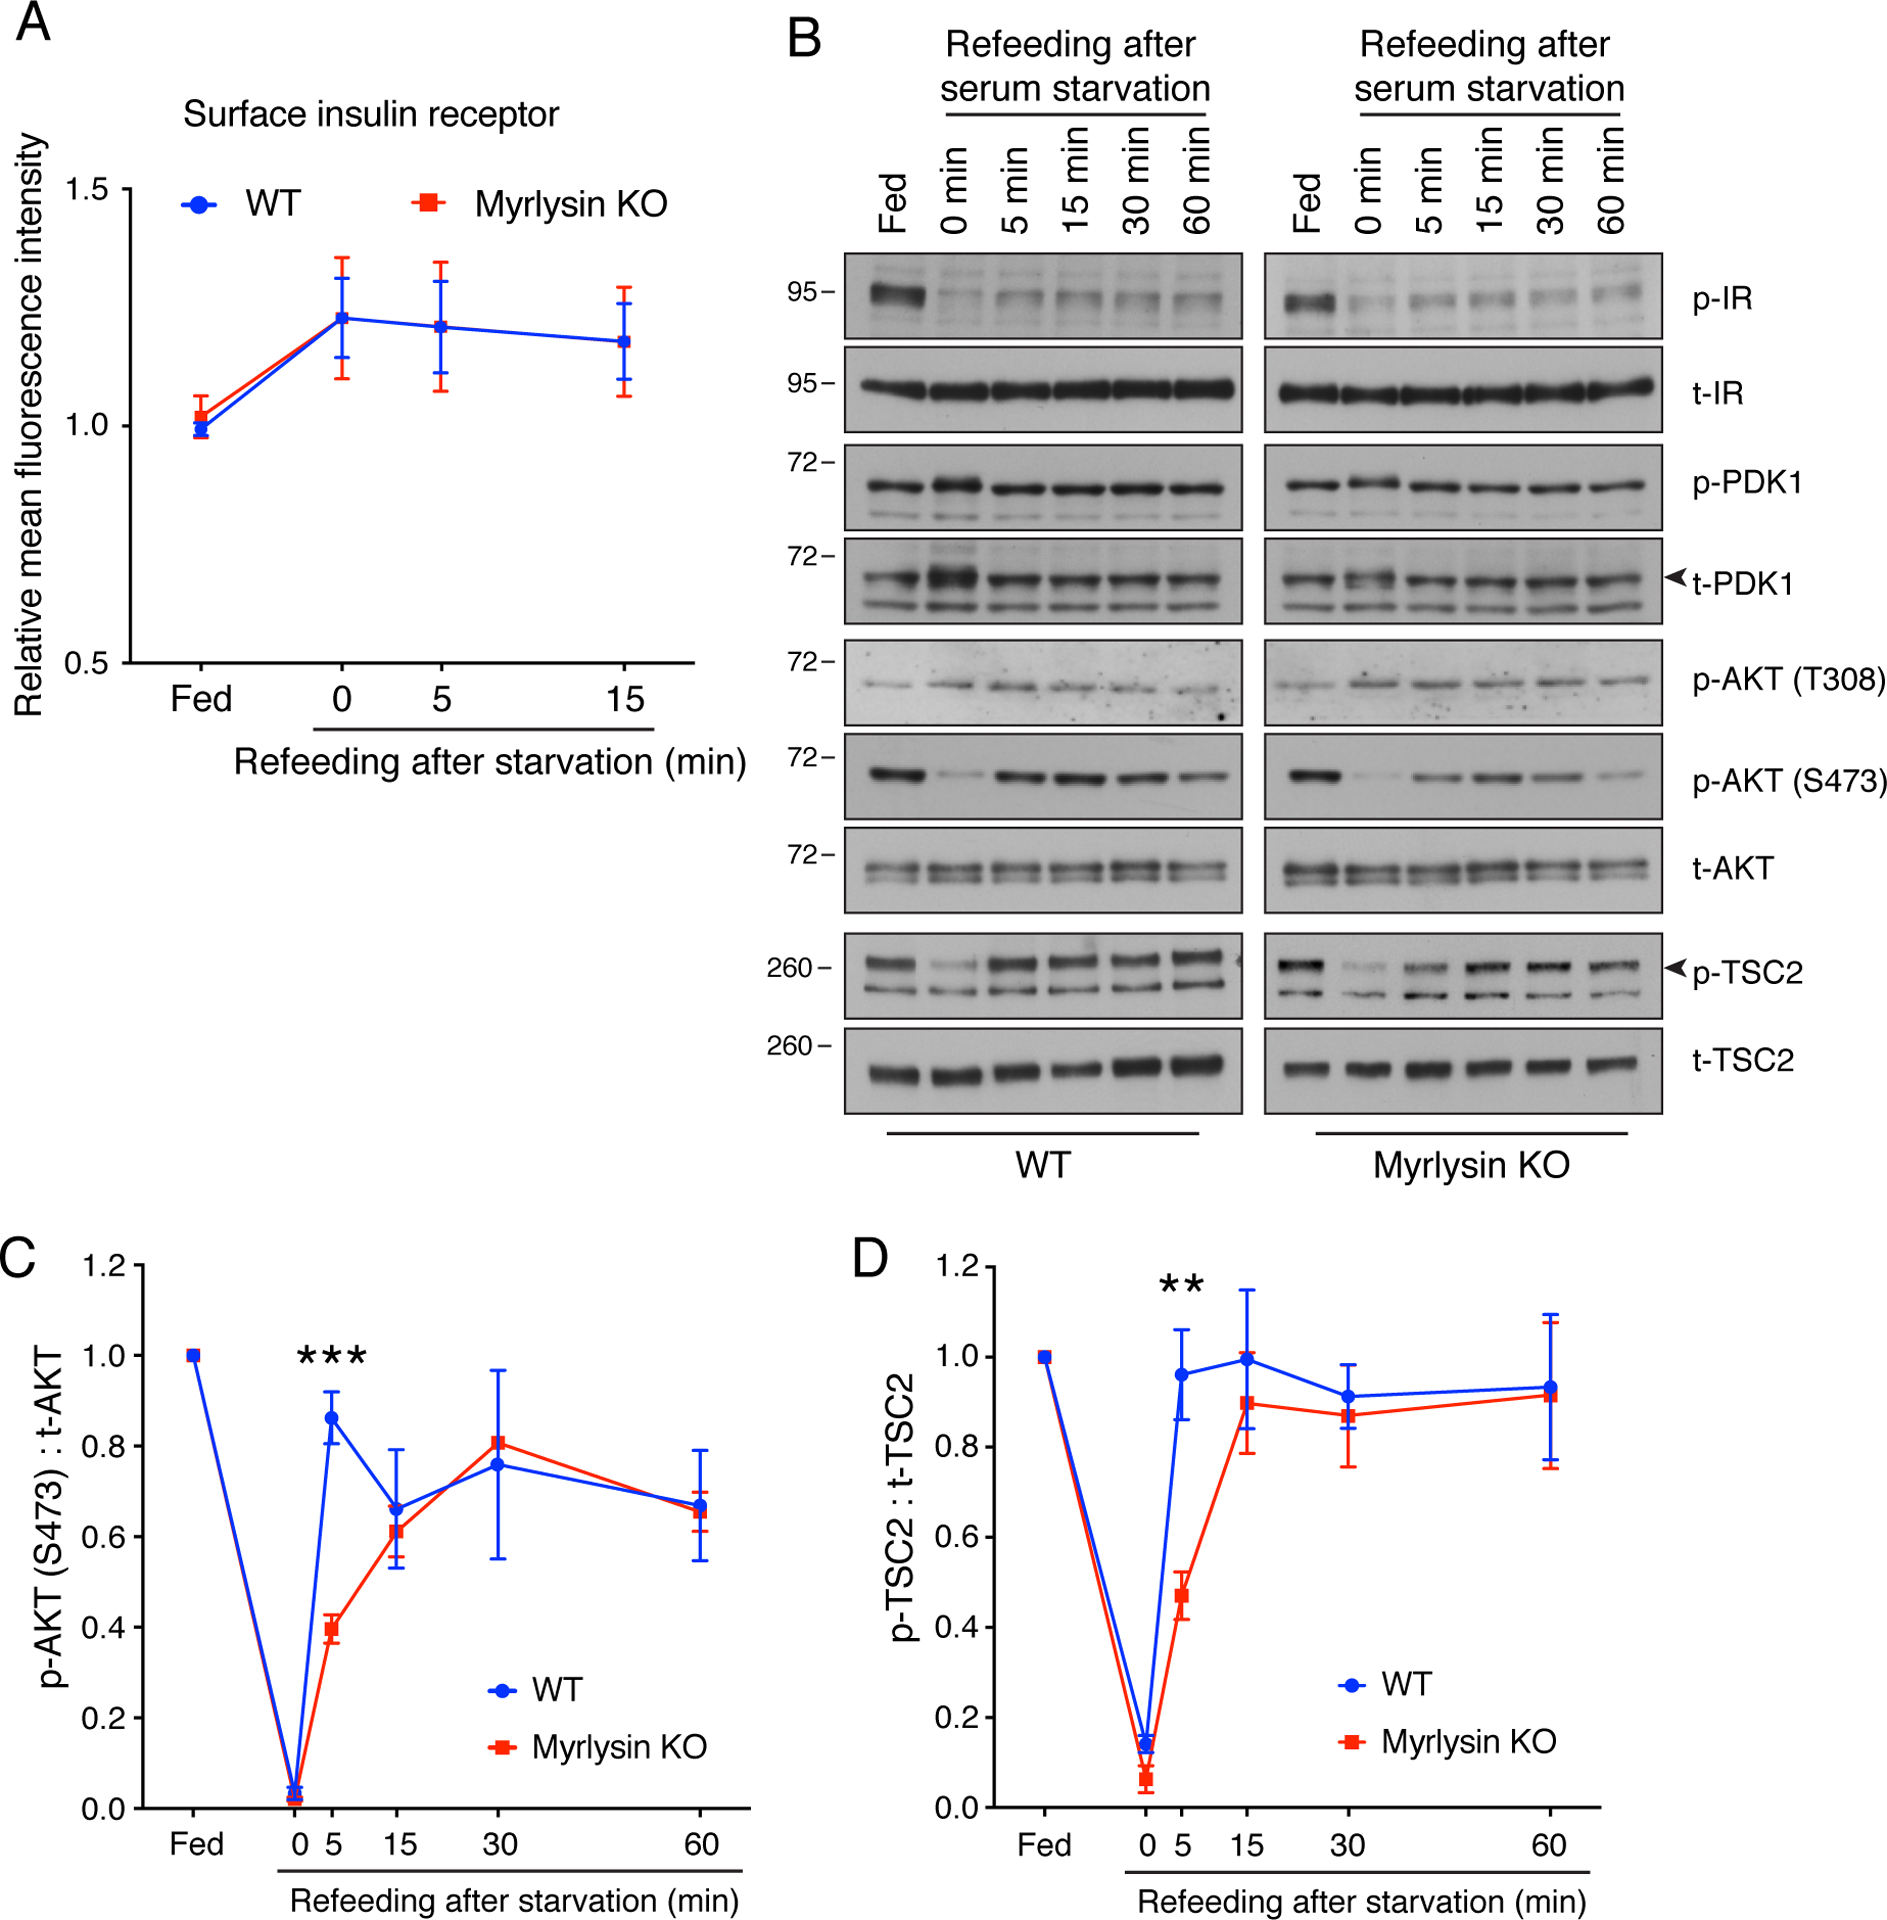
(A) WT and myrlysin-KO HeLa cells were incubated in serum-free medium for 1 h, and then serum was added for different periods. The cell surface expression of insulin receptor was measured by immunostaining of intact cells with antibody to the insulin receptor followed by flow cytofluorometric analysis. Values are the mean ± SEM from three independent experiments. (B) WT and myrlysin-KO HeLa cells were starved for 1 h in serum-free medium and then refed with serum for the indicated periods. Cell lysates were subjected to SDS-PAGE and immunoblotting with antibodies to phosphorylated insulin receptor (p-IR), total insulin receptor (t-IR), phosphorylated PDK1 (p-PDK1), total PDK1 (t-PDK1), T308-phosphorylated AKT [p-AKT (T308)], S473-phosphorylated AKT [p-AKT (S473)], total AKT (t-AKT), phosphorylated TSC2 (p-TSC2), and total TSC2 (t-TSC2). The positions of molecular mass markers (in kDa) are indicated on the left. Arrowheads indicate the specific t-PDK1 and p-TSC2 bands. (C) Quantification of the ratio of p-AKT (S473) to t-AKT. (D) Quantification of the ratio of p-TSC2 to t-TSC2. In C and D, values are the mean ± SEM from three independent experiments such as that shown in B. **p<0.001, ***p<0.0001 (WT vs. myrlysin KO) using two-way ANOVA with Tukey’s multiple comparisons test.
Further characterization of the effect of lysosome positioning on mTORC2 reactivation showed that myrlysin rescue restored the normal kinetics of AKT-S473 phosphorylation upon addition of amino acids plus serum to amino-acid- and serum-deprived cells (Fig. 4A,B), or addition of serum to serum-deprived cells (Fig. 4A,C). In addition, we observed that KO of diaskedin, lyspersin or KIF1B-KIF5B also delayed the recovery of AKT-S473 phosphorylation in comparison to that in WT HeLa cells under both deprivation-refeeding regimens (Fig. 4A–C). To investigate in more detail the kinetics of AKT-S473 phosphorylation recovery, we serum-deprived WT, myrlysin-KO and KIF1B-KIF5B-KO HeLa cells for 1 h and analyzed AKT-S473 phosphorylation at shorter times (including 1 and 2 min) after serum replenishment (Fig. 4D,E). We observed that the recovery of AKT-S473 phosphorylation to steady-state levels was complete at 2 min in WT cells and 15 min in myrlysin-KO or KIF1B-KIF5B-KO cells (Fig. 4D,E), further demonstrating the delayed reactivation of mTORC2 upon juxtanuclear clustering of lysosomes.
Figure 4. KO of BORC subunits or KIF1B-KIF5B delays reactivation of mTORC2.
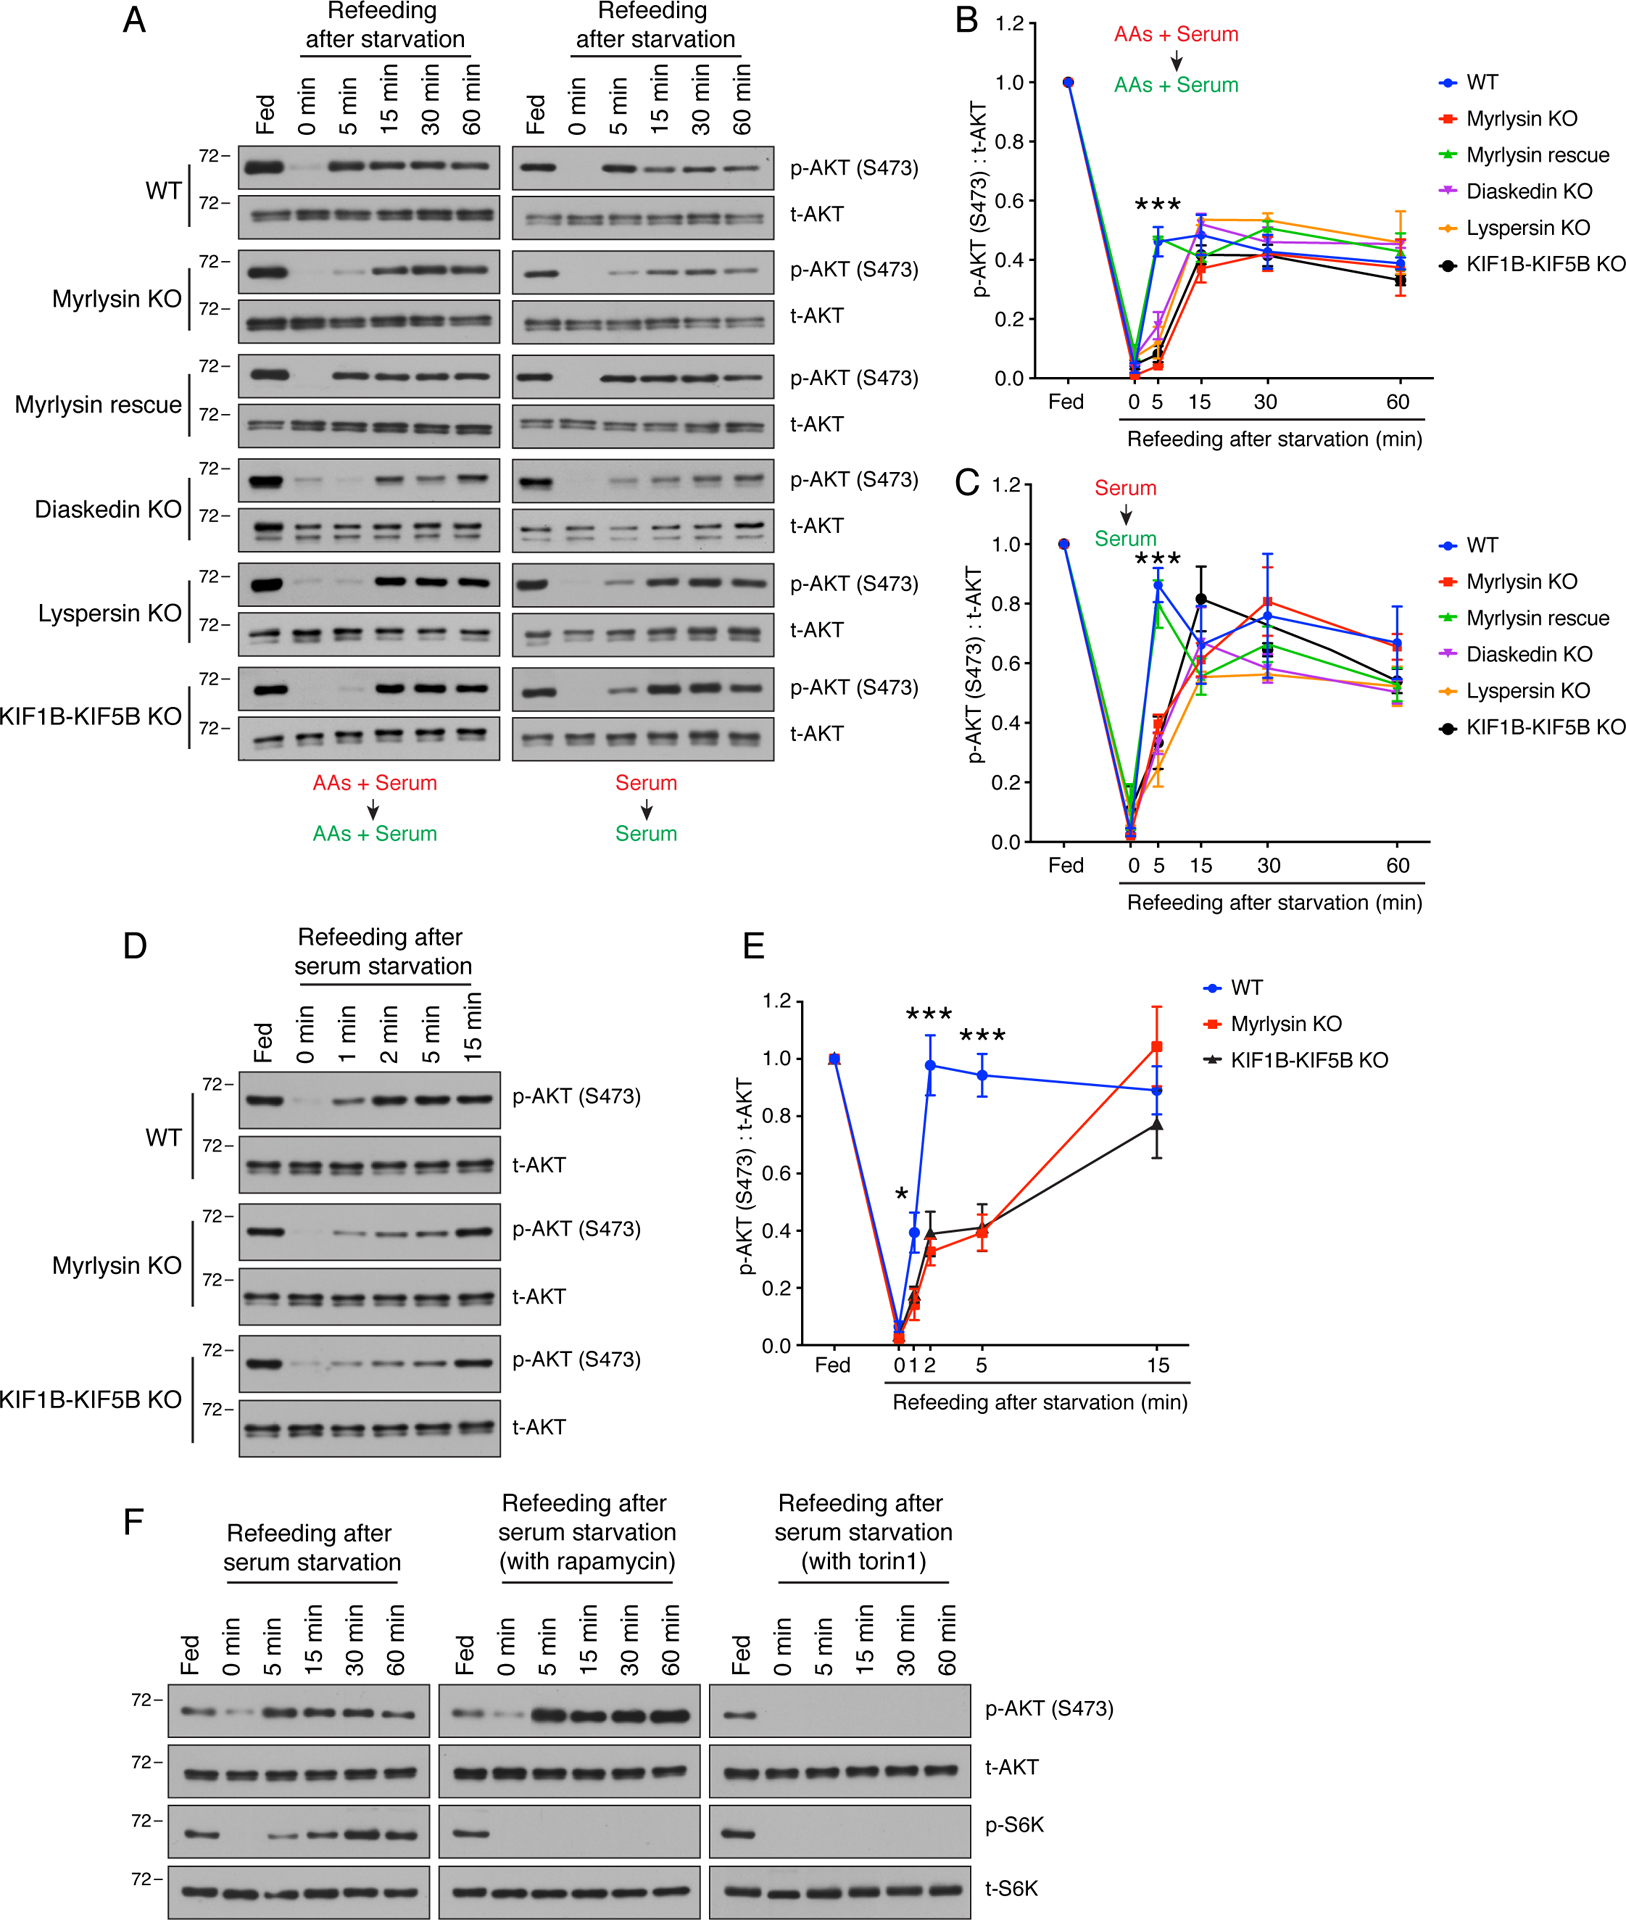
(A) WT, myrlysin-KO, myrlysin-rescue (myrlysin-KO transfected with myrlysin cDNA), diaskedin-KO, lyspersin-KO and KIF1B-KIF5B-KO HeLa cells were incubated in medium depleted of both amino acids and serum for 30 min, or depleted of serum for 1 h, and then refed with the corresponding nutrients for the indicated periods. Cell lysates were subjected to SDS-PAGE and immunoblotting with antibodies to S473-phosphorylated AKT [p-AKT (S473)] and total AKT (t-AKT). (B) Quantification of the ratio of p-AKT (S473) to t-AKT upon combined amino-acid and serum depletion-refeeding. (C) Quantification of the ratio of p-AKT (S473) to t-AKT upon serum depletion-refeeding. The line graphs for WT and myrlysin-KO cells are the same shown in Fig. 3C. In B and C, values are the mean ± SEM from three independent experiments such as that shown in A. ***p<0.0001 (WT vs. myrlysin KO) using two-way ANOVA with Tukey’s multiple comparisons test. (D,E) WT, myrlysin-KO and KIF1B-KIF5-KO HeLa cells were incubated in medium depleted of serum for 1 h, refed with serum for shorter periods, and analyzed as in A-C. Values in E are the mean ± SEM from three independent experiments. * p<0.01, ***p<0.0001 (WT vs. myrlysin KO) using two-way ANOVA with Tukey’s multiple comparisons test. (F) WT HeLa cells were subjected to serum depletion and refeeding in the presence of 50 nM rapamycin or 200 nM torin1. Cell lysates were subjected to SDS-PAGE and immunoblotting with antibodies to S473-phosphorylated AKT [p-AKT (S473)], total AKT (t-AKT), phosphorylated S6K (p-S6K) and total S6K (t-S6K). In A, D and F, the positions of molecular mass markers (in kDa) are indicated on the left.
To confirm that the recovery of AKT-S473 phosphorylation upon serum refeeding was mediated by mTORC2, we tested the effect of rapamycin, which acutely inhibits mTORC1 but not mTORC2, and torin1, which inhibits both forms of mTOR (Thoreen and Sabatini, 2009). Indeed, we found that rapamycin prevented the re-phosphorylation of S6K by mTORC1, but not AKT-S473 by mTORC2, upon serum deprivation-refeeding (Fig. 4F). In fact, the levels of S473-phosphorylated AKT were higher in the presence of rapamycin relative to untreated cells (Fig. 4F), consistent with the existence of negative feedback loops in which mTORC1 directly or indirectly inhibits upstream events in growth factor signaling (Hsu et al., 2011, Yu et al., 2011, Liu et al., 2013, Liu et al., 2014). In contrast to rapamycin, torin1 inhibited the re-phosphorylation of both S6K and AKT-S473 (Fig. 4F). This pattern of inhibition supports the notion that AKT-S473 phosphorylation in these cells reflects the activity of mTORC2.
We also further examined the effect of lysosome positioning on AKT reactivation. The delayed recovery of TSC2 phosphorylation could be restored by myrlysin re-expression in myrlysin-KO cells (Fig. 5A–C), and KO of diaskedin, lyspersin or KIF1B-KIF5B also delayed the kinetics of TSC2 phosphorylation (Fig. 5A–C) under both amino-acid plus serum, and serum-only depletion-refeeding regimens. Confirming that the effects of lysosome positioning on TSC2 phosphorylation were due to impaired AKT reactivation, we found that myrlysin KO also delayed the re-phosphorylation of other AKT substrates, including the transcription factor FoxO3 (Forkhead box O3), the RAB GTPase-activating protein AS160 (AKT substrate of 160 kDa), and the kinase GSK-3β (glycogen synthase kinase-3β) (Fig. 5D).
Figure 5. KO of BORC subunits or KIF1B-KIF5B delays reactivation of AKT.
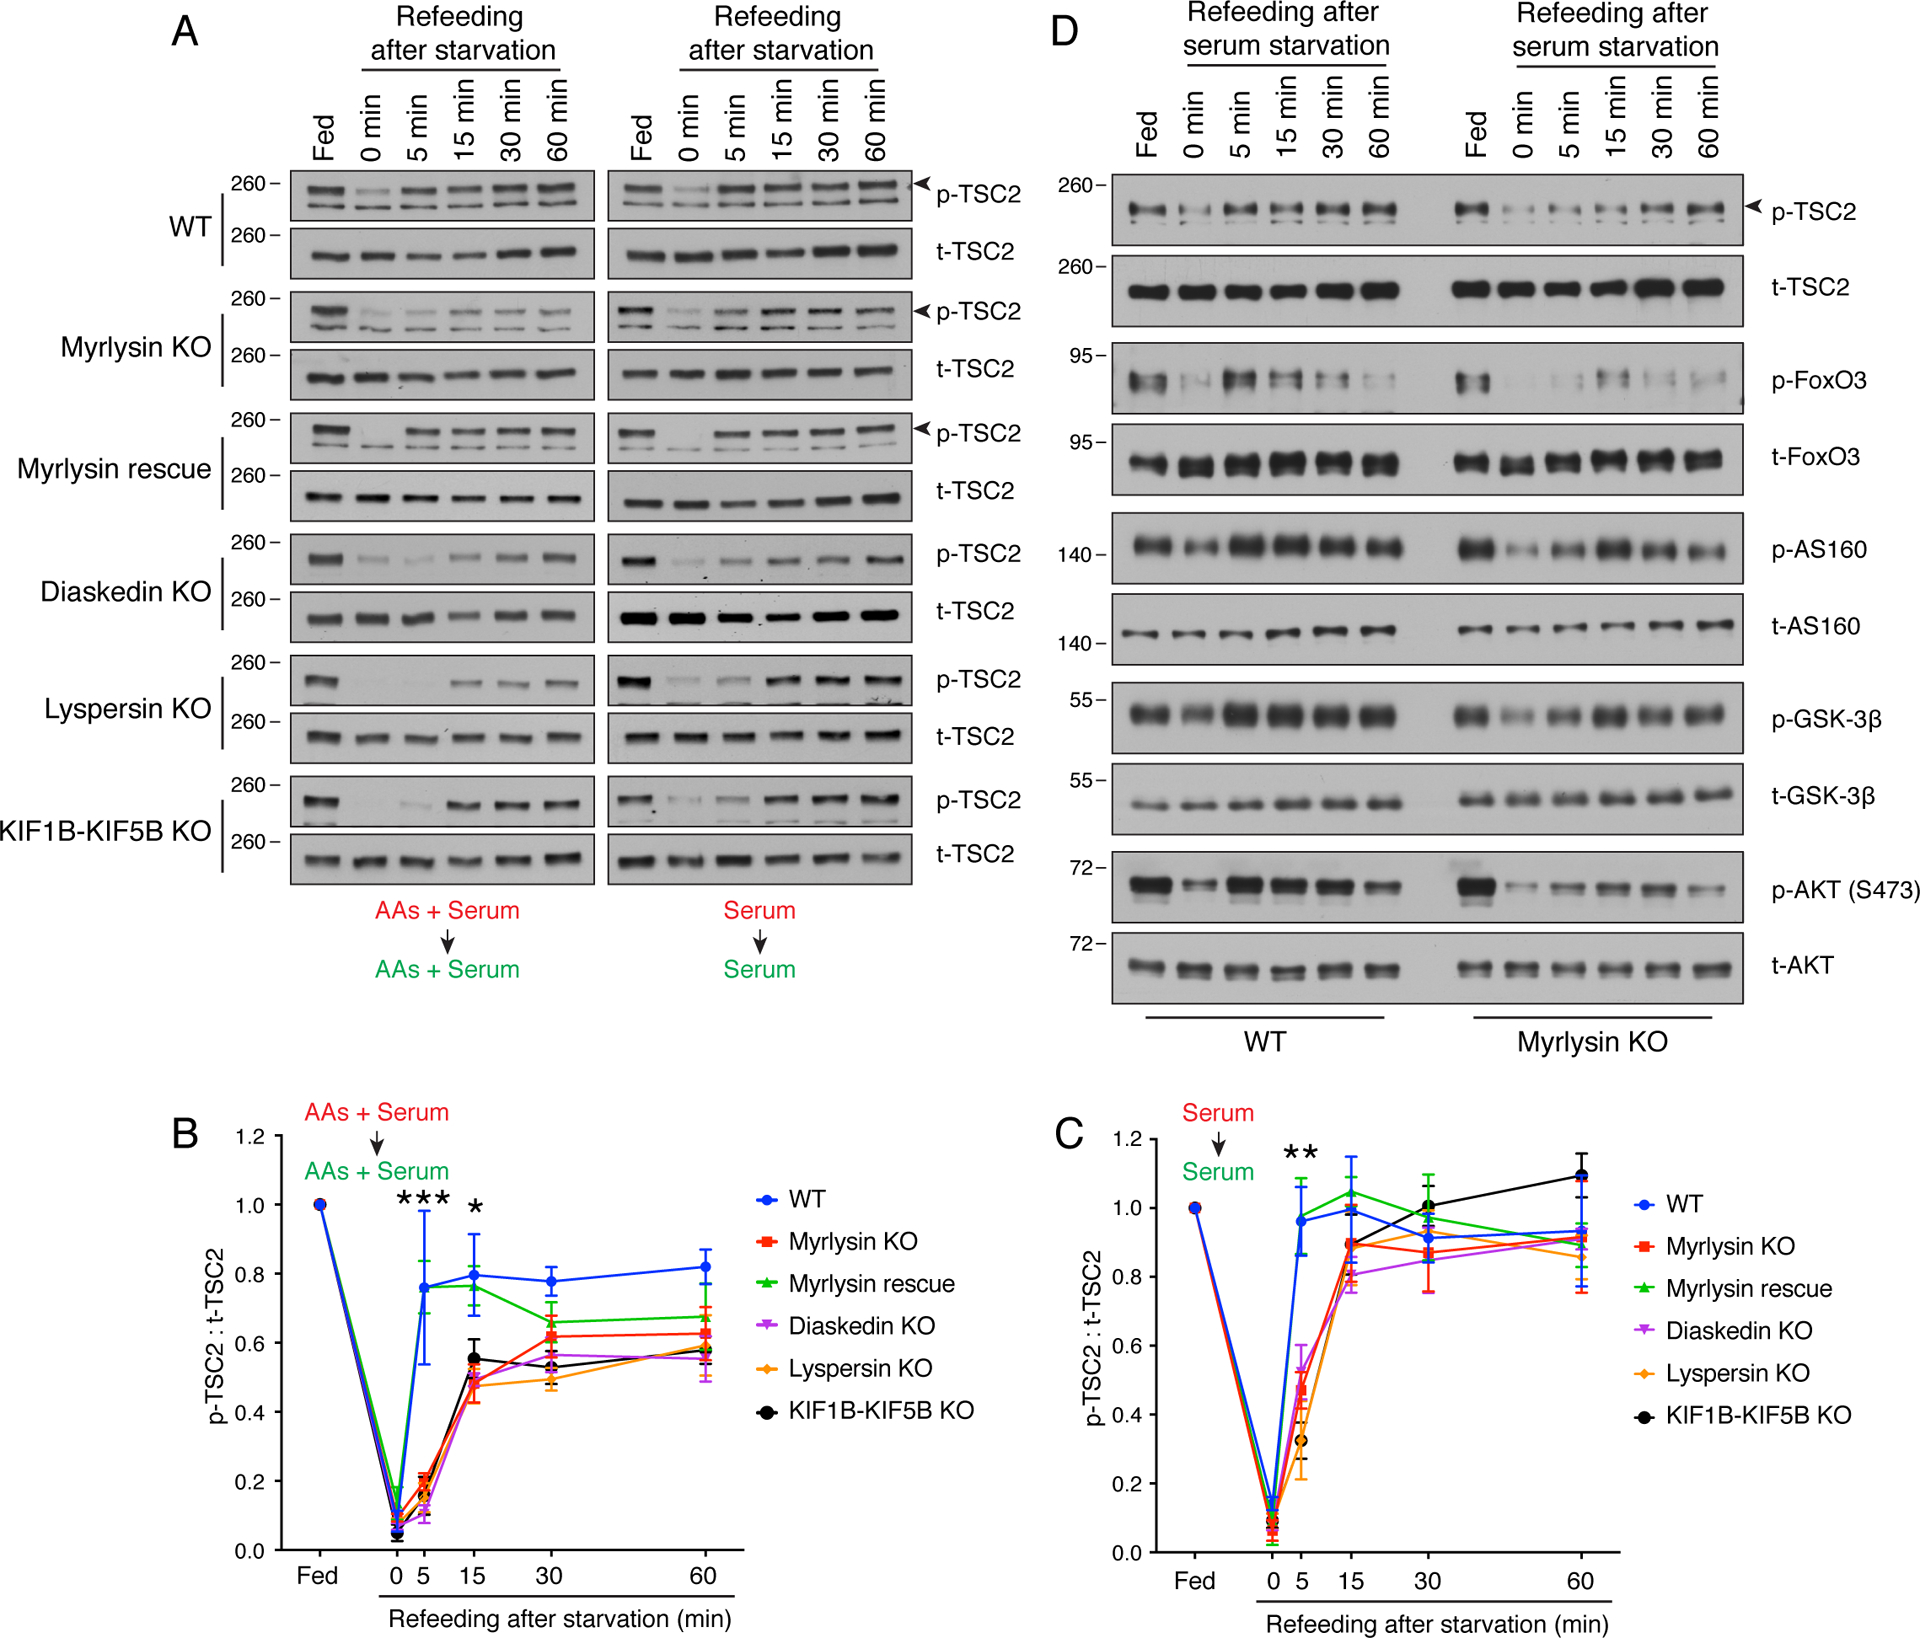
(A) WT, myrlysin-KO, myrlysin-rescue (myrlysin-KO transfected with myrlysin cDNA), diaskedin-KO, lyspersin-KO and KIF1B-KIF5B-KO HeLa cells were incubated in medium depleted of both amino acids and serum for 30 min, or serum for 1 h, and then refed with the corresponding nutrients for the indicated periods. Cell lysates were subjected to SDS-PAGE and immunoblotting with antibodies to phosphorylated TSC2 (p-TSC2), and total TSC2 (t-TSC2). Arrowheads indicate the specific p-TSC2 bands. (B) Quantification of the ratio of p-TSC2 to t-TSC2 upon combined amino-acid and serum depletion-refeeding. (C) Quantification of the ratio of p-TSC2 to t-TSC2 upon serum depletion-refeeding. The line graphs for WT and myrlysin-KO cells are the same shown in Fig. 3D. In B and C, values are the mean ± SEM from three independent experiments such as that shown in A. *p<0.01, **p<0.001, ***p<0.0001 (WT vs. myrlysin KO), two-way ANOVA with Tukey’s multiple comparisons test. (D) WT and myrlysin-KO HeLa cells were subjected to serum starvation and refeeding. Cell lysates were analyzed as in A for phosphorylated p-TSC2, t-TSC2, phosphorylated FoxO3 (p-FoxO3), total FoxO3 (t-FoxO3), phosphorylated AS160 (p-AS160), total AS160 (t-AS160), phosphorylated GSK-3β (p- GSK-3β), total GSK-β3 (p-GSK-3β), S473-phosphorylated AKT [p-AKT (S473)] and total AKT (t-AKT). In A and E, the positions of molecular mass markers (in kDa) are indicated on the left.
From all of the above results, we concluded that juxtanuclear clustering of lysosomes delayed the reactivation of not only mTORC1 (Fig. 2) but also its upstream regulators mTORC2 and AKT by serum (Figs. 3–5).
Association of mTORC2 with Lysosomes
Whereas the dependence of mTORC1 reactivation on lysosome positioning can be explained by its association with lysosomes (Sancak et al., 2010), the reason for the dependence of mTORC2 and AKT reactivation was unclear, since their presence on lysosomes is less well established (Berchtold and Walther, 2009, Oh et al., 2010, Zinzalla et al., 2011, Betz et al., 2013, Partovian et al., 2008, Ebner et al., 2017). To determine to what extent mTORC2 and AKT are associated with membranous organelles, we separated post-nuclear supernatants (PNS) from WT and myrlysin-KO cells into membrane and cytosolic fractions. SDS-PAGE and immunoblot analysis showed that in WT cells the control lysosomal protein LAMP1 and ER protein calnexin exclusively appeared in the membrane fraction, and the microtubule protein tubulin exclusively in the cytosolic fraction (Fig. 6A), validating the specificity of the approach. Approximately 20–21% of RICTOR and 23–24% of mSIN1 (both subunits of mTORC2), as well as 4–5% of AKT, were recovered in the membrane fraction relative to the PNS (Fig. 6A). Myrlysin KO did not change the proportion of mTORC2 and AKT associated with both subcellular fractions (Fig. 6A).
Figure 6. A population of mTORC2 associated with lysosomes.
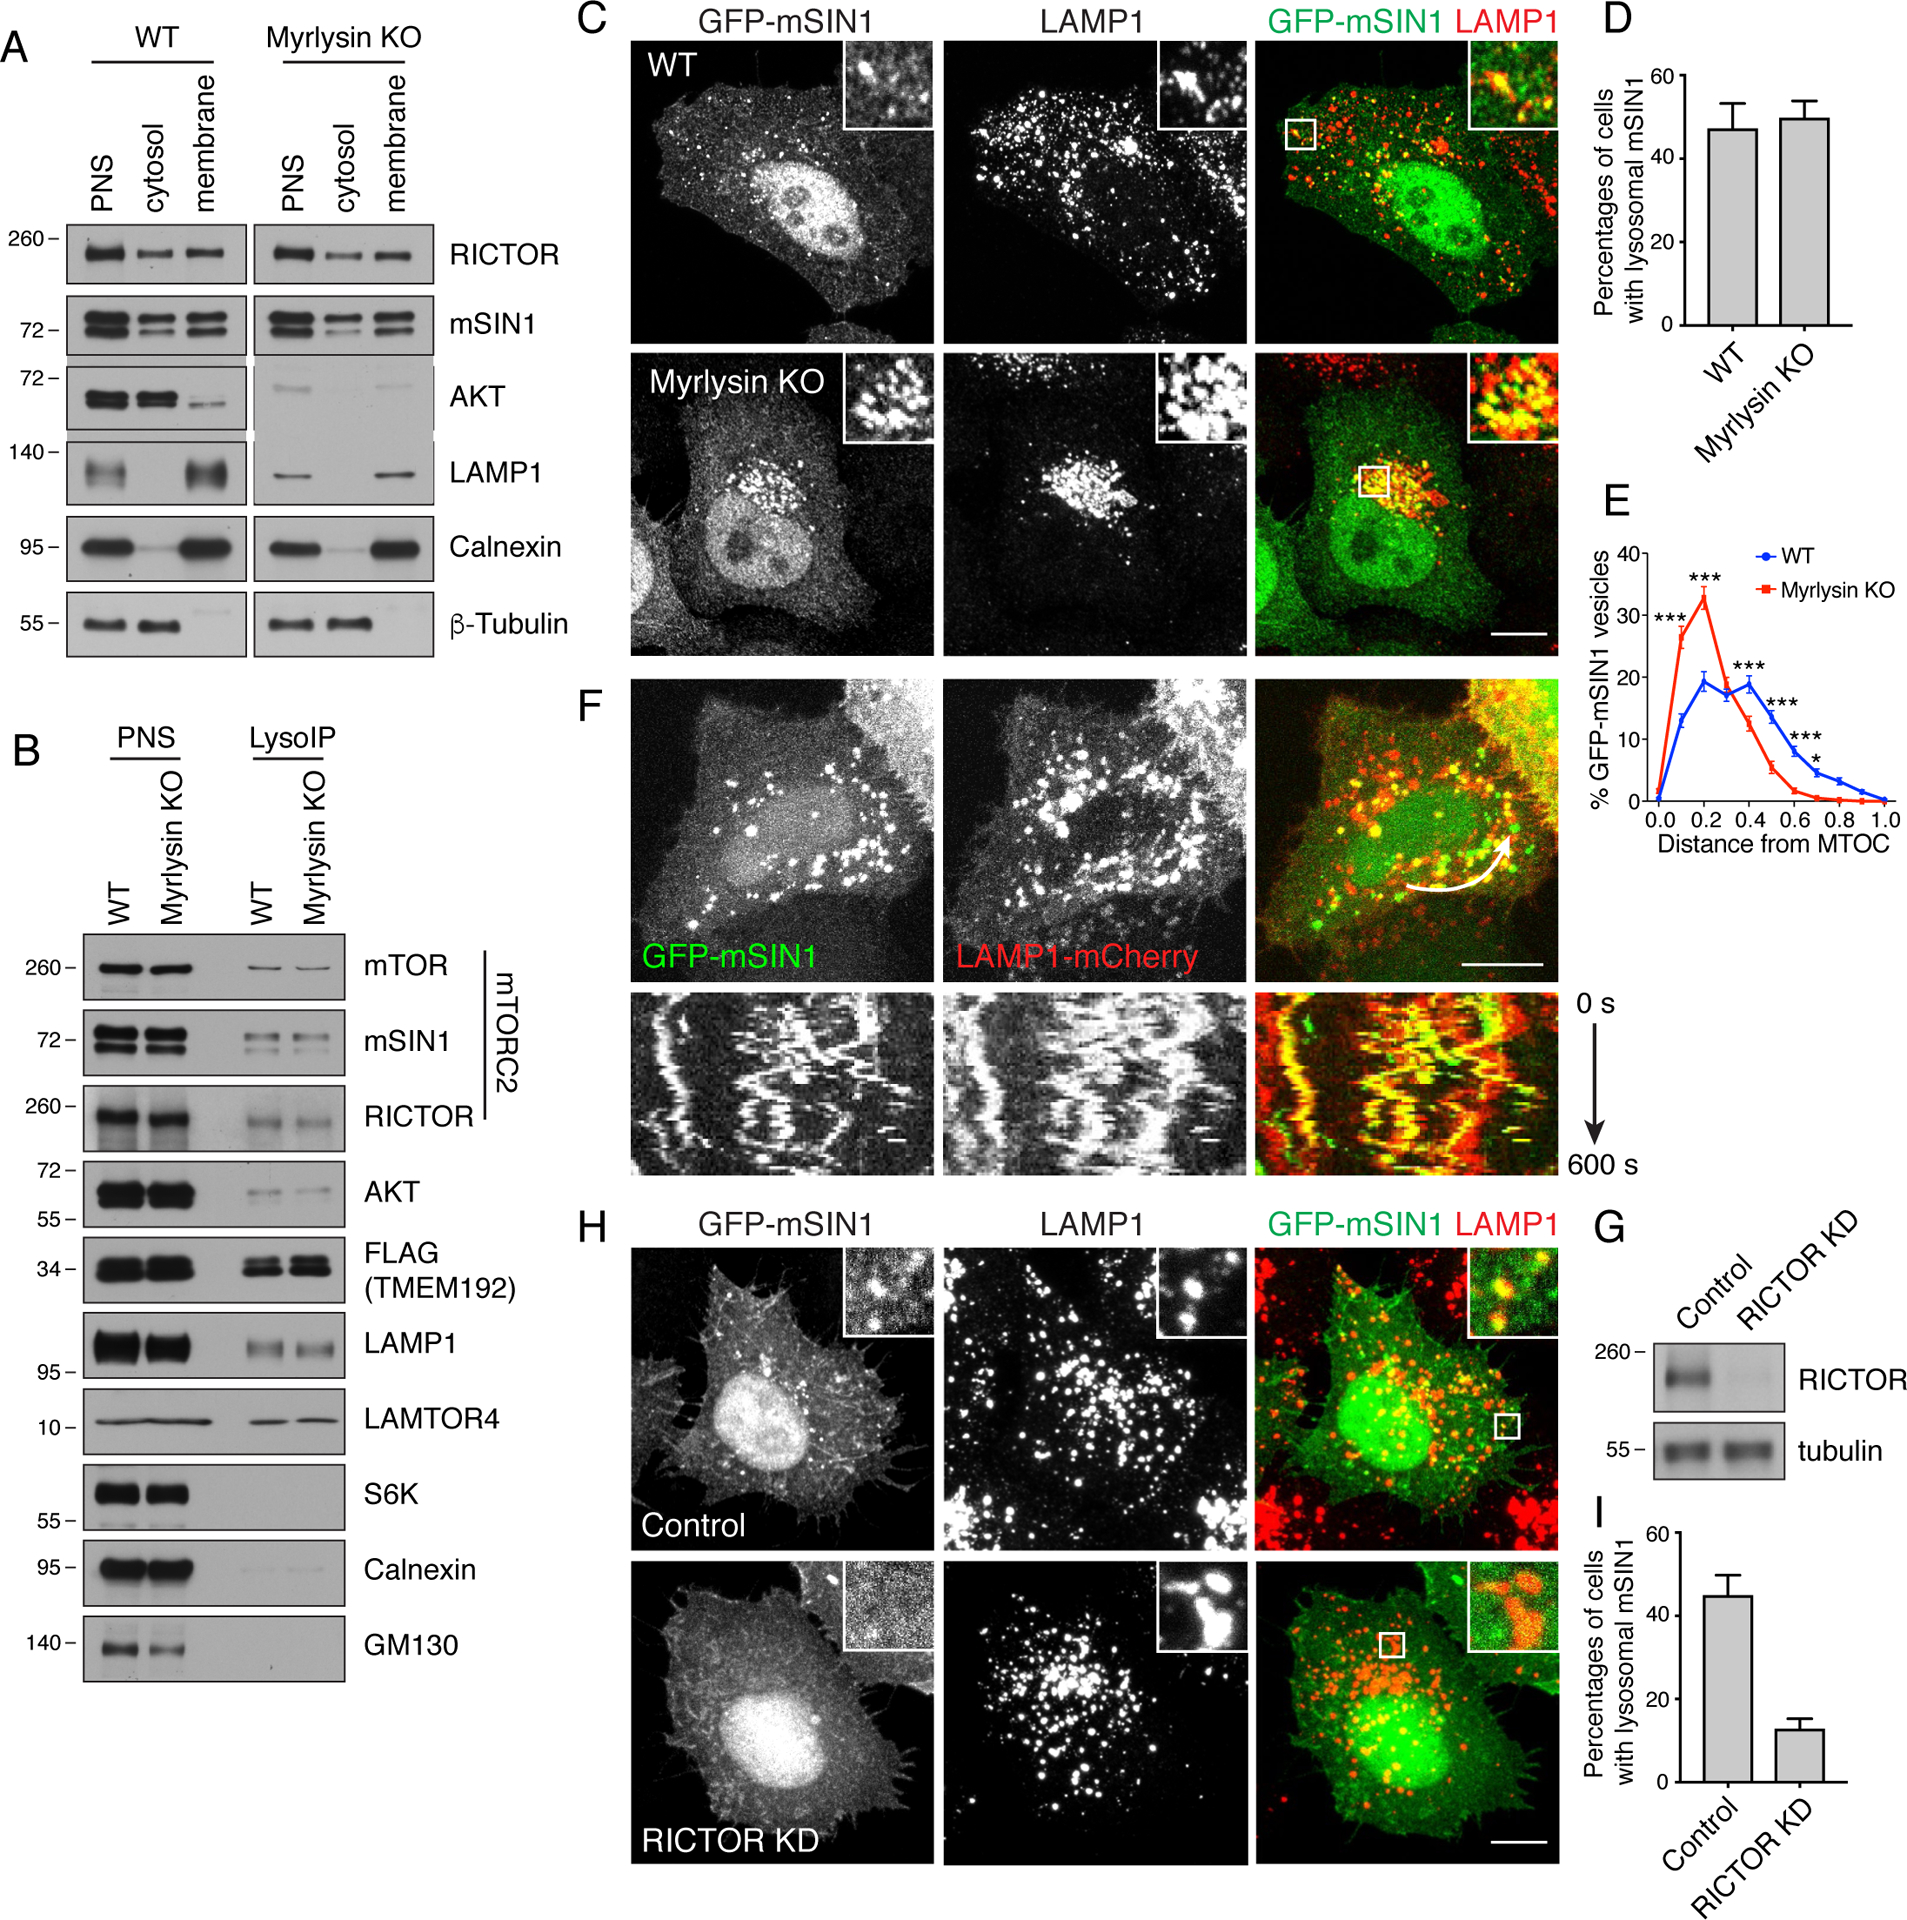
(A) WT and myrlysin-KO HeLa cells were homogenized and fractionated into post-nuclear supernatant (PNS), cytosol and membrane fractions. Samples were analyzed by SDS-PAGE and immunoblotting for the RICTOR and mSIN1 subunits of mTORC2, AKT, LAMP1 (lysosomes), calnexin (ER) and β-tubulin (cytosol). Loading of membrane fractions was 2.5-fold that of the cytosolic fractions. The recovery of the different proteins in the membrane fraction relative to the PNS was 20–21% for RICTOR, 23–24% for mSIN1, 4–5% for AKT and 69–73% for LAMP1 in both WT and myrlysin-KO cells. (B) WT and myrlysin-KO HeLa cells were transiently transfected with a plasmid encoding TMEM192-FLAG. After 48 h, cells were homogenized and lysosomes isolated from a PNS fraction with an antibody to the FLAG epitope (LysoIP). PNS and LysoIP fractions were analyzed by SDS-PAGE and immunoblotting for the proteins indicated on the right. GM130 is a Golgi marker. Loading of LysoIP fractions was 20-fold that of PNS fractions. The recovery of the different proteins in the LysoIP fraction relative to the PNS was 0.6–0.7% for mTOR, 0.5–0.6% for mSIN1, 0.8–1-1% for RICTOR, 0.2–0.3% for AKT, 3.6–4.3% for TMEM192-FLAG and 0.7–0.8% for LAMP1 in both WT and myrlysin-KO cells. In both A and B, the positions of molecular mass markers (in kDa) are indicated on the left. (C) Confocal microscopy of WT and myrlysin-KO HeLa cells transiently transfected with a plasmid coding GFP-mSIN1. Cells were fixed, permeabilized and immunostained with antibody to LAMP1. Scale bar: 10 μm. Insets show enlargements of the boxed areas. (D) The percentages of cells with lysosomal mSIN1 were quantified in 100 cells from 3 independent experiments in each group. Values are the mean ± SEM. (E) The distribution of GFP-mSIN1 vesicles was quantified in the cells indicated in panel C (n = 50 cells from three independent experiments). The distance between GFP-mSIN1 vesicles and the microtubule-organizing center (MTOC) was normalized to the longest distance between the cell periphery and the MTOC. Values are the mean ± SEM. Probabilities: ***p<0.0001, *p<0.05, calculated by two-way ANOVA with Tukey’s multiple comparisons test. (F) WT HeLa cells were transfected with plasmids encoding GFP-mSIN1 and LAMP1-mCherry and analyzed by live-cell imaging. Kymograph shows mSIN1 moving together with LAMP1 vesicles along the trajectory shown in the upper row. Scale bar: 10 μm. (G) siRNA-mediated KD of RICTOR was performed in HeLa cells. RICTOR in control and RICTOR-KD cells was detected by immunoblotting. The positions of molecular mass markers (in kDa) are indicated on the left. (H) Control or RICTOR-KD cells were transfected with a plasmid encoding GFP-mSIN1. Cells were immunostained with antibody to LAMP1. Scale bar: 10 μm. Insets show enlargements of the boxed areas. (I) The percentages of cells with lysosomal GFP-mSIN1 were quantified in 100 cells from 3 independent experiments in each group. Values are the mean ± SEM. *p<0.01 using unpaired Student’s t test.
Because the membrane fraction contained other organelles previously shown to have associated mTORC2, such as plasma membrane, endosomes, mitochondria and ribosomes (Schroder et al., 2007, Berchtold and Walther, 2009, Oh et al., 2010, Boulbés et al., 2011, Zinzalla et al., 2011, Betz et al., 2013, Partovian et al., 2008, Arias et al., 2015, Ebner et al., 2017), we used a lysosome immunoprecipitation (LysoIP) protocol (Abu-Remaileh et al., 2017) to determine if mTORC2 was specifically associated with lysosomes. This protocol consisted of transfecting WT and myrlysin-KO HeLa cells with a plasmid encoding the lysosomal protein TMEM192 appended with two copies of the FLAG epitope (TMEM192-FLAG), followed by immunoisolation with an antibody to the FLAG epitope conjugated to magnetic beads. SDS-PAGE and immunoblotting showed the presence of TMEM192-FLAG, LAMP1 and the also lysosomal LAMTOR4 subunit of the Ragulator complex, but not cytosolic S6K, ER calnexin and Golgi GM130 proteins, in the LysoIP fraction of WT cells (Fig. 6B). These controls demonstrated that the LysoIP procedure yielded a fraction of highly purified lysosomes, although comparison of the amount of LAMP1 and LAMTOR4 in the LysoIP fraction relative to the PNS showed that the yield in lysosomes was very low (0.7–0.8%). Nevertheless, comparable amounts of mSIN1 (0.5–0.6%), RICTOR (0.8-1-1%), AKT (0.2–0.3%) were recovered in the LysoIP fraction (Fig. 6B). Also in these experiments, no differences were observed between WT and myrlysin-KO cells (Fig. 6B). Taken together, these subcellular fractionation experiments demonstrated that small but significant quantities of mTORC2 and AKT are associated with lysosomes, irrespective of the integrity of BORC and lysosome positioning.
We wished to confirm the localization of a subpopulation of mTORC2 and AKT to lysosomes by immunofluorescence microscopy, but, in our hands, commercial antibodies to subunits of mTORC2 and to AKT gave only non-specific or cytosolic staining in HeLa cells. We therefore decided to examine the localization of GFP-mSIN1 (isoform 2) expressed by transient transfection in HeLa cells; this construct was previously shown to be readily incorporated into the endogenous mTORC2 complex and to localize to intracellular vesicles including late endosomes (Ebner et al., 2017). We observed that in ~47% of the cells this protein indeed localized to intracellular puncta in addition to the plasma membrane, nucleus, cytoplasmic filaments and cytosol (Fig. 6C,D). About 90% of the GFP-mSIN1 puncta co-localized with endogenous LAMP1 (Fig. 6C), confirming their identity as lysosomes. Conversely, ~29% of the endogenous LAMP1 co-localized with GFP-mSIN1 (Fig. 6C), indicating that only a subpopulation of lysosomes contains associated mTORC2. Similar observations were made in WT and myrlysin-KO cells (Fig. 6C,D). It is also noteworthy that GFP-mSIN1 followed the redistribution of lysosomes towards the juxtanuclear area upon KO of myrlysin (Fig. 6E), indicating that GFP-mSIN1 remained associated with lysosomes under these conditions. Further confirmation of the localization of GFP-mSIN1 to lysosomes was obtained by live-cell imaging of WT HeLa cells, which showed that ~72% of GFP-mSIN1-containing vesicles co-moved with LAMP1-mCherry, while ~27% of LAMP1-mCherry-positive vesicles co-moved with GFP-mSIN1 (Fig. 6F). Swelling of lysosomes by treatment with methionine methyl ester (Long et al., 1983) produced ring-like structures with hollow interiors, allowing visualization of GFP-mSIN1 on the limiting membrane of lysosomes that also stained for endogenous mTOR in both WT and myrlysin-KO cells (Fig. S1). Depletion of another subunit of mTORC2, RICTOR, decreased the association of GFP-mSIN1 with lysosomes (Fig. 6G–I), confirming that this association depends on the endogenous mTORC2 complex.
These findings thus demonstrated the existence of a subpopulation of mTORC2 that associates with lysosomes independently of BORC.
Insulin Recapitulates the Dependence on Lysosome Positioning of mTORC2 Reactivation by Serum
In addition to insulin, fetal bovine serum (FBS) contains other growth factors, such as insulin-like growth factor 1 (IGF-1), epidermal growth factor (EGF), transforming growth factor β1 (TGF-β1) and fibroblast growth factor 2. To determine whether or not the influence of lysosome positioning on the reactivation of mTORC2 by serum refeeding could be recapitulated by any of these factors in isolation, we tested the effect of adding purified insulin or EGF to serum-deprived cells. We observed that addition of 6 ng/ml insulin was sufficient to induce rapid re-phosphorylation of AKT-S473 in WT cells, and to a lesser extent in myrlysin-KO cells (Fig. 7A). Addition of 0.5 ng/ml EGF also induced recovery of AKT-S473 phosphorylation, but this was independent of myrlysin and, therefore, lysosome positioning (Fig. 7A). A similar myrlysin-independent recovery of S473-AKT phosphorylation was observed upon treatment of serum-starved cells with concentrations of EGF ranging from 0.2 to 0.5 ng/ml (Fig. 7B). Addition of 4 mg/ml bovine serum albumin, the most abundant protein in serum, did not induce AKT-S473 re-phosphorylation in either WT or myrlysin-KO cells (Fig. 7A). Therefore, the reactivation of mTORC2 by insulin, but not EGF, exhibited a dependence on BORC and lysosome positioning similar to that shown by serum.
Figure 7. Delayed mTORC2 reactivation by insulin in myrlysin-KO cells.
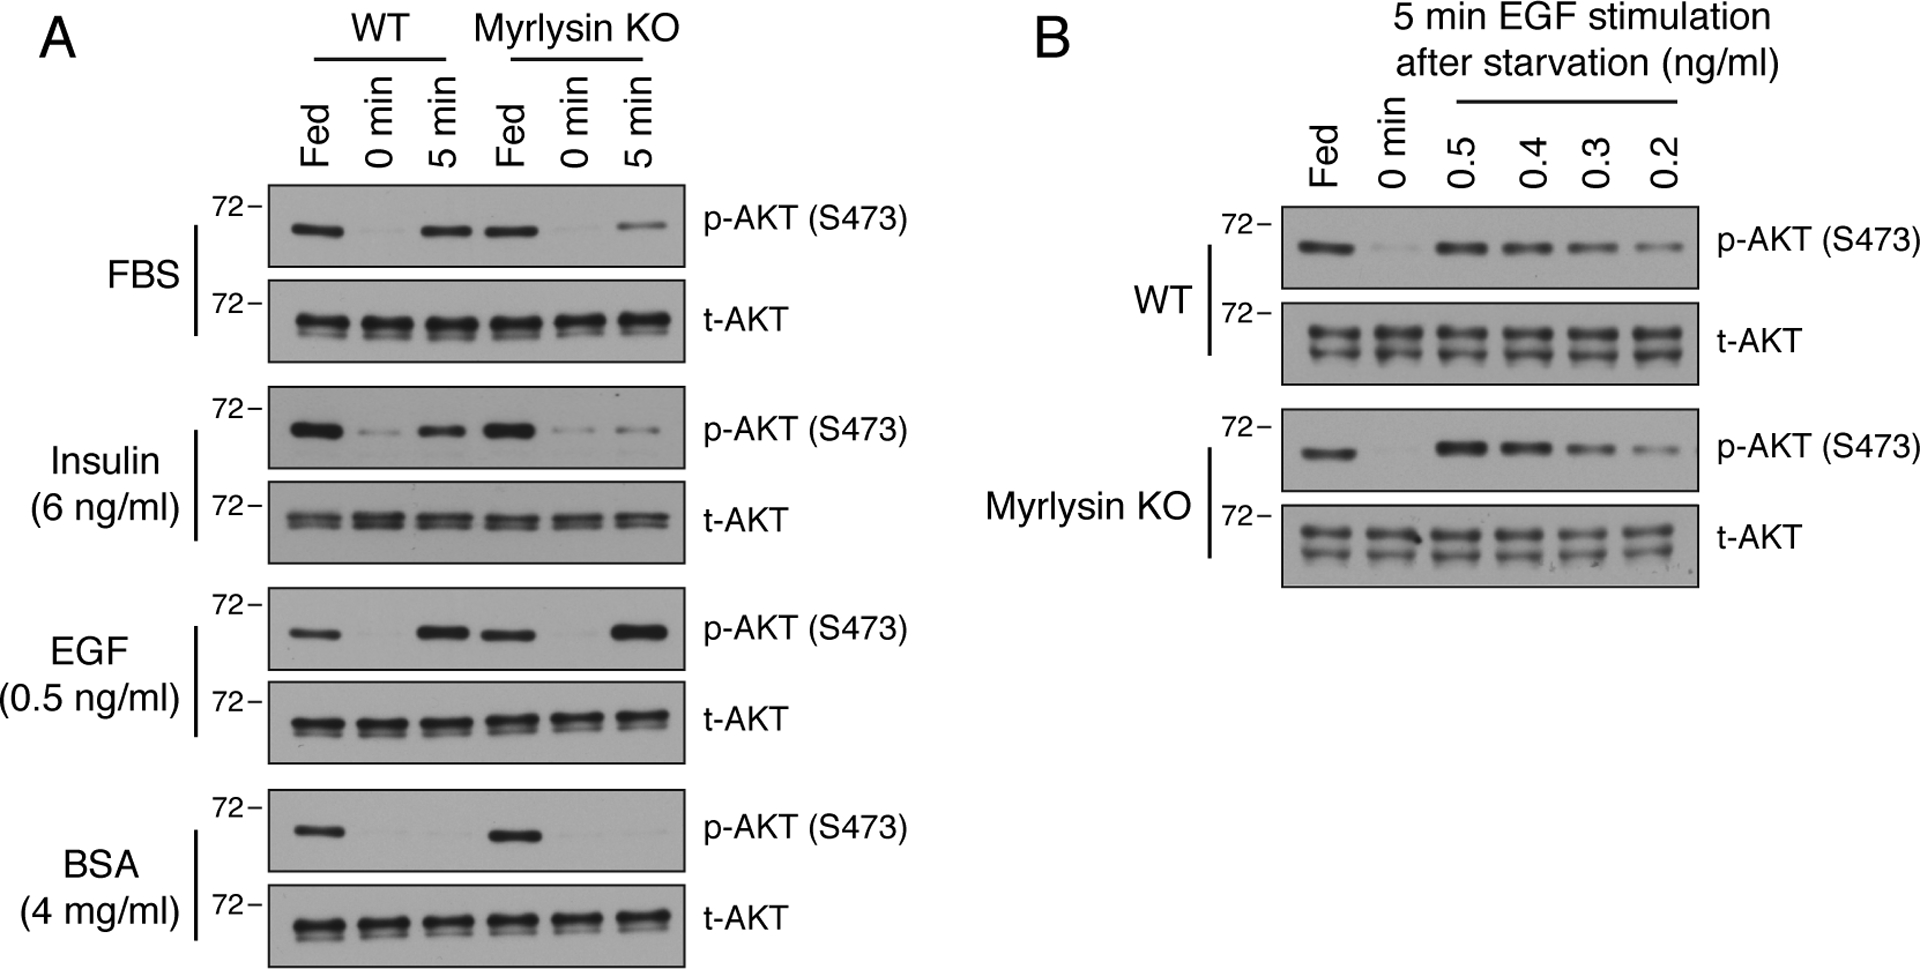
(A) WT and myrlysin-KO HeLa cells were incubated for 1 h in serum-free medium, and further incubated with 10 % FBS, 4 mg/ml BSA, 6 ng/ml insulin or 0.5 ng/ml EGF for 5 min. Cells were then lysed and analyzed by SDS-PAGE and immunoblotting for S473-phosphorylated AKT [p-AKT (S473)] and total AKT (t-AKT). (B) WT and myrlysin-KO HeLa cells were serum-depleted as above and incubated with varying concentrations of EGF (0.2–0.5 ng/ml) for 5 min. Cell lysates were analyzed by SDS-PAGE and immunoblotting as above. The positions of molecular mass markers (in kDa) are indicated on the left.
Discussion
The results of this study demonstrate that juxtanuclear accumulation of lysosomes by genetic disruption of the lysosome-dispersal machinery (i.e., BORC, ARL8B or KIF1B-KIF5B) delays the reactivation of not only mTORC1 but also mTORC2 and AKT by serum. Although individually BORC, ARL8B and KIF1B-KIF5B have more than one function, in conjunction they cooperate to move lysosomes towards the cell periphery (Pu et al., 2016, Bonifacino and Neefjes, 2017), supporting the interpretation that alterations in lysosome positioning underlie the changes in mTORC1, mTORC2 and AKT reactivation in the KO cells. The dependence of mTORC1 reactivation on lysosome positioning was expected, because of the well-known association of mTORC1 with lysosomes under nutrient-replete conditions (Sancak et al., 2010); however, the similar dependence of mTORC2 and AKT reactivation was surprising due to their more heterogeneous distribution within cells (Schroder et al., 2007, Oh et al., 2010, Boulbés et al., 2011, Zinzalla et al., 2011, Betz et al., 2013, Partovian et al., 2008, Ebner et al., 2017, Berchtold and Walther, 2009). This behavior of mTORC2 and AKT may be explained by the association of discrete pools of mTORC2 and AKT with lysosomes.
Despite our expectation that there would be changes in mTORC1 activity depending on the positioning of lysosomes, a priori we could not predict the direction of the changes because of conflicting data regarding the relative activity of mTORC1 at central vs. peripheral locations of the cell (Korolchuk et al., 2011, Clippinger et al., 2011, Clippinger and Alwine, 2012, Walton et al., 2018). Using cells with KO of components of the lysosome-dispersal machinery, we find that central localization of lysosomes decreases mTORC1 activity, albeit only under certain conditions. These conditions include mTORC1 reactivation following depletion-refeeding with a combination of serum and amino acids. Of this combination, serum is the factor that accounts for the delayed reactivation, a fact that may be explained by the longer distance of centrally-located lysosomes from the origin of growth factor signaling at the plasma membrane. Amino acids, on the other hand, regulate mTORC1 reactivation independently of lysosome positioning, probably because amino-acid sensing occurs at the lysosome itself or in the cytosol (Wolfson and Sabatini, 2017). Although central clustering of lysosomes in our KO cells delays mTORC1 reactivation by serum, it does not alter basal mTORC1 activity. This observation suggests that the level of basal mTORC1 activity is tightly controlled to allow cell survival and growth during selection of the KO clones.
The delayed reactivation of mTORC1 when lysosomes are centrally clustered by KO (this study) or KD (Korolchuk et al., 2011) of components of the lysosome-dispersal machinery contrasts with the persistent activation of mTORC1 when it is centrally maintained by infection with HCMV (Clippinger et al., 2011). The behavior of mTORC1 in our study is also difficult to reconcile with the observations that mTORC1 activity is inhibited by peripheral redistribution of lysosomes upon acidification of the medium (Walton et al., 2018) or dynein inhibition (Clippinger and Alwine, 2012). A plausible explanation for these findings is that acidification or HCMV infection alter mTORC1 activity by processes other than changes in lysosome or mTORC1 positioning, and that dynein inhibition affects multiple organelles in addition to lysosomes. In any event, a more definitive determination of the effect of the peripheral redistribution of lysosomes on mTORC1 signaling will require the analysis of cells with KO of specific components of the lysosomal retrograde-transport machinery, as was done here for the lysosome-dispersal machinery.
Because growth factor signaling starts at the plasma membrane, it is logical to assume that the kinetics of mTORC1 reactivation at the lysosomal membrane depend on the distance between the plasma membrane and lysosomes, as generally proposed for intracellular signaling cascades (Kholodenko, 2003, Hwang et al., 2014). However, it is unclear which specific steps in the mTORC1 reactivation pathway are distance-sensitive. Early models assumed that activation of growth factor receptors led to translocation of PDK1, mTORC2 and AKT from the cytosol to the plasma membrane (Manning and Toker, 2017). In this context, it was pertinent to hypothesize that the distance between plasma-membrane-associated AKT and lysosome-associated TSC (Demetriades et al., 2014), Rheb and mTORC1 (Sancak et al., 2010) determined the rate of mTORC1 recovery from serum depletion (Korolchuk et al., 2011). However, we find that the influence of lysosome positioning extends to mTORC2 and AKT reactivation by serum. These effects could be explained by a positive feedback loop in which mTORC1 directly or indirectly activates its upstream regulators mTORC2 and AKT. However, to date mTORC1-catalyzed phosphorylation has been shown to negatively regulate insulin signaling through inhibition and destabilization of insulin receptor substrate 1 (IRS-1) and activation and stabilization of growth factor receptor-bound protein 10 (Grb10) (Hsu et al., 2011,Yu et al., 2011). In the same vein, S6K-catalyzed mSin1 phosphorylation impairs mTORC2 complex integrity and inhibits downstream AKT signaling (Liu et al., 2013,Liu et al., 2014). Moreover, we observed that inhibition of mTORC1 with rapamycin increases mTORC2 activity (Fig. 4F). Thus, these findings do not support a positive feedback loop as an explanation for our observations.
An alternative explanation could be that perinuclear clustering of lysosomes indirectly alters the composition and properties of the plasma membrane through impairment of lysosome exocytosis, autophagy or cell adhesion, processes that depend on lysosome positioning and motility (Korolchuk et al., 2011, Schiefermeier et al., 2014, Pu et al., 2015, Jia et al., 2017). These alterations could produce imbalances in the proteins and lipids that participate in the early stages of growth factor signaling at the plasma membrane, perhaps also affecting mTORC2 and AKT.
These hypothetical mechanisms notwithstanding, we considered the additional possibility that pools of mTORC2 and AKT could be associated with lysosomes. Subcellular fractionation and microscopic imaging experiments supported this explanation (Fig. 6), in agreement with previous findings (Ebner et al., 2017, Arias et al., 2015, Hirata et al., 2018). The fraction of the total mTORC2 and AKT that was associated with membrane and lysosomal fractions in our subcellular fractionation experiments was low, but this could be due to the inefficient isolation of lysosomes, the dissociation of the enzymes from membranes during the isolation procedures, and the presence of the enzymes in other subcellular fractions, as previously shown (Schroder et al., 2007, Berchtold and Walther, 2009, Oh et al., 2010, Boulbés et al., 2011, Zinzalla et al., 2011, Betz et al., 2013, Partovian et al., 2008, Arias et al., 2015, Ebner et al., 2017). Whereas the mechanism of mTORC1 recruitment to lysosomes is known to depend on the Rag GTPases, in the case of mTORC2 and AKT this mechanism is unknown. The mSIN1 subunit of mTORC2 as well as AKT comprise PH domains that bind membrane PI(3,4,5)P3 and/or PI(3,4)P2 (Frech et al., 1997, Ebner et al., 2017), but these phosphoinositides are not thought to be enriched at the lysosomal membrane. Nevertheless, mSIN1 has been shown to associate with early and late endosomes independently of PI3K activity (Ebner et al., 2017) and to bind to additional phosphoinositides that are not phosphorylated at position 3 (Schroder et al., 2007). The small GTPase Rac1 associates with a subpopulation of lysosomes under conditions of nutrient starvation (Arias et al., 2015), and can activate both mTORC1 and mTORC2 (Saci et al., 2011). However, KD of Rac1 did not change the association of mTORC2 with lysosomes (Arias et al., 2015). AKT has been shown to interact with the endosome-associated APPL1 protein (Mitsuuchi et al., 1999, Miaczynska et al., 2004), but there is no evidence for the presence of APPL1 on lysosomes. The mechanisms of mTORC2 and AKT association with lysosomes thus remain to be elucidated.
Serum contains many growth factors, and it is currently unknown which ones are responsible for the dependence of mTORC1, mTORC2 and AKT reactivation on lysosome positioning. Nevertheless, we find that insulin alone recapitulates the effects of serum on mTORC2, including its impaired reactivation in myrlysin-KO cells. Insulin-like growth factors, which share common signal-transduction pathways with insulin (Taguchi and White, 2008), could be similarly responsible. In contrast to insulin, EGF induced recovery of mTORC2 activity independently of lysosome positioning. This could be explained by the ability of the activated EGF receptor to recruit cytosolic mTORC1 and mTORC2 directly to the plasma membrane via Grb2 and Gab1 (Chang et al., 2015). In any event, our results show that the characteristics of the serum response are more akin to those of insulin than those of EGF. A likely explanation is that serum contains higher levels of “insulin-like” than “EGF-like” growth factors, or that insulin-like factors exert a dominant effect.
The peripheral distribution of lysosomes has been shown to be an important factor for pathologic processes such as cancer cell growth, invasion and metastasis (Pu et al., 2016). More specifically, ARL8B was shown to promote tumor invasion and proliferative growth in low nutrient environments through its ability to mobilize lysosomes to the peripheral cytoplasm (Dykes et al., 2016). Although these effects were proposed to be mediated by increased secretion of degradative enzymes and remodeling of focal adhesions (Hämälistö and Jäättelä, 2016, Naegeli et al., 2017), it is tempting to speculate that they could also result from a higher rate of mTORC1 and mTORC2 activation on peripheral lysosomes. This mechanism would be consistent with the known role of these two forms of mTOR in cancer cell growth, proliferation and metastasis (Guertin and Sabatini, 2007).
STAR★Methods
Contact for Reagent and Resource Sharing
Further information and requests for reagents may be directed to the corresponding author, Juan S. Bonifacino (juan.bonifacino@nih.gov), and his staff.
Experimental Model and Subject Details
Cells
HeLa, HeLa-derived KO and HEK293T cells were grown in DMEM with 10 % fetal bovine serum (FBS) and 2 mM L-glutamine at 37°C, 5 % CO2. Transient transfection of siRNAs was performed with Oligofectamine and plasmid transfections were performed with Lipofectamine 2000, both according to the manufacturers’ instructions. Experiments were done 48 h after transfection.
Method Details
Starvation and Recovery
Serum starvation was performed by incubating cells in DMEM with 2 mM L-glutamine for 1 h. Combined amino-acid and serum starvation was performed by incubating cells in amino-acid-free DMEM for 30 min. Amino-acid starvation was performed by incubating cells in amino-acid-free DMEM supplemented with 10 % dialyzed FBS for 1 h. Cells were briefly washed once with starvation medium before incubation. After starvation, the medium was replaced with new medium containing the corresponding nutrients for different periods. Cells were lysed in lithium dodecyl sulfate (LDS) sample buffer, and analyzed by SDS-PAGE and immunoblotting.
Immunofluorescence Microscopy and Live-Cell Imaging
Cells for immunofluorescence microscopy were grown on glass coverslips coated with 5 μg/ml fibronectin for 24 h prior to the experiment. Cells were fixed in 4 % paraformaldehyde (PFA) and permeabilized in 0.2 % Triton X-100 in PBS. Cells were incubated with primary antibody for 1 h at 37°C, washed three times with 0.2 % Triton X-100 in PBS, incubated for 30 min at 37°C with Alexa Fluor Secondary Antibodies (ThermoFisher), washed and mounted with DAPI-Fluoromount-G (Electron Microscopy Sciences). Live-cell imaging was performed in 4-well Nunc Lab-Tek Chambered Coverglasses coated with fibronectin as above. Fluorescence was visualized on a Zeiss LSM780 confocal microscope (Carl Zeiss). Image analysis was performed with ImageJ.
Subcellular Fractionation
Cells were scraped in culture medium and pelleted by centrifugation at 1,000 g for 5 min at 4°C. The cell pellets were washed twice with ice-cold PBS and re-suspended in 1 ml ice-cold homogenization buffer (20 mM tricine, 250 mM sucrose, adjusted to pH 7.8 with KOH) with freshly added protease inhibitor cocktail. Cells were mechanically disrupted by 40 passages through a 25G needle. The homogenates were centrifuged at 1,000 g for 2 min at 4°C, yielding a post-nuclear supernatant (PNS). The PNS was centrifuged at 100,000 g for 1 h at 4°C to separate the supernatant (cytosol) and pellet (membrane) fractions. The membrane fraction was resuspended in homogenization buffer. PNS, cytosol and membrane fractions were subsequently analyzed by SDS-PAGE and immunoblotting.
Lysosome Immunoisolation
Lysosome immunoisolation was carried out using magnetic beads as previously described (Abu-Remaileh et al., 2017). Briefly, WT HeLa or myrlysin-KO HeLa cells transiently expressing TMEM192-FLAG were mechanically homogenized in KPBS (136 mM KCl, 10 mM KH2PO4, adjusted to pH 7.25 with KOH). PNS fractions were incubated with anti-FLAG magnetic beads with rotation at 4°C for 2 h. Beads were washed three times with KPBS. Bound lysosomes were eluted by incubation with 3xFLAG peptide in homogenization buffer and subjected to SDS-PAGE and immunoblotting.
Flow Cytofluorometry
After starvation and refeeding, WT or myrlysin-KO HeLa cells were detached from the culture dishes with 5 mM EDTA on ice, pelleted and washed twice with ice-cold FACS buffer (PBS with 1 % BSA). Cell surface insulin receptor was stained with PE-conjugated anti-insulin receptor antibody in FACS buffer for 1 h on ice. The cells were washed twice with FACS buffer prior to fixation in 1 % PFA in PBS. Fluorescence intensities of the cells were measured on an LSRFortessa™ Flow Cytometer (BD Biosciences) and analyzed with Flow-jo.
Genome Editing by CRISPR/Cas9
Myrlysin-KO, lyspersin-KO, MEF2BNB-KO, diaskedin-KO, KIF1B-KIF5B-KO and ARL8B-KO HeLa cells, generated by CRISPR/Cas9, were described previously (Pu et al., 2015, Guardia et al., 2016, Jia et al., 2017).
Quantification and Statistical Analysis
All graphs report the mean ± SEM, and represent data from three independent experiments. Unless otherwise indicated, statistical comparisons were made using two-way analysis of variance (two-way ANOVA) with Tukey’s multiple comparisons test provided by Prism 7 software. The statistical significance is denoted as follows: ***p < 0.0001, **p < 0.001, *p < 0.01.
Supplementary Material
Supplement
Key Resources Table
| REAGENT or RESOURCE | SOURCE | IDENTIFIER |
|---|---|---|
| Antibodies | ||
| LAMP1 | Developmental Studies Hybridoma Bank | H4A3 |
| Phospho-p70 S6 Kinase (Thr389) | Cell Signaling Technology | 9234 |
| p70 S6 Kinase | Cell Signaling Technology | 2708 |
| Phospho-4E-BP1 (Thr37/46) | Cell Signaling Technology | 2855 |
| 4E-BP1 | Cell Signaling Technology | 9452 |
| Phospho-ULK1 (Ser757) | Cell Signaling Technology | 14202 |
| ULK1 | Cell Signaling Technology | 8054 |
| Insulin Receptor β (Tyr1150/1151) | Cell Signaling Technology | 3024 |
| Insulin Receptor β | Cell Signaling Technology | 3025 |
| Phospho-PDK1 (Ser241) | Cell Signaling Technology | 3061 |
| PDK1 | Cell Signaling Technology | 3062 |
| Phospho-AKT (Thr308) | Cell Signaling Technology | 13038 |
| Phospho-AKT (Ser473) | Cell Signaling Technology | 4060 |
| AKT | Cell Signaling Technology | 4691 |
| Phospho-TSC2 (Thr1462) | Cell Signaling Technology | 3617 |
| TSC2 | Cell Signaling Technology | 4308 |
| Phospho-FoxO3a (Ser253) | Cell Signaling Technology | 13129 |
| FoxO3a | Cell Signaling Technology | 12829 |
| Phospho-AS160 (Ser318) | Cell Signaling Technology | 8619 |
| AS160 | Cell Signaling Technology | 2670 |
| Phospho-GSK-3β (Ser9) | Cell Signaling Technology | 5558 |
| GSK-3β | Cell Signaling Technology | 12456 |
| Phospho-PKCα/β II (Thr638/641) | Cell Signaling Technology | 9375 |
| PKCα | Cell Signaling Technology | 59754 |
| RICTOR | Cell Signaling Technology | 2140 |
| mSIN1 | EMD Millipore | 05-1044 |
| β-Tubulin | Cell Signaling Technology | 2146 |
| Calnexin | EMD Millipore | MAB3126 |
| FLAG | Sigma-Aldrich | F1804 |
| mTOR | Cell Signaling Technology | 2983 |
| PE-conjugated anti-insulin receptor antibody | BD Biosciences | 559955 |
| Chemicals, Peptides, and Recombinant Proteins | ||
| Rapamycin | Sigma-Aldrich | R0395 |
| Torin1 | Cell Signaling Technology | 14379 |
| Insulin solution | Sigma-Aldrich | I9278 |
| EGF recombinant human protein | ThermoFisher Scientific | 10605-HNAE-5 |
| Fibronectin human plasma | Sigma-Aldrich | F2006 |
| Paraformaldehyde | Electron Microscopy Sciences | 15714 |
| Triton X-100 | Sigma-Aldrich | T8787 |
| Protease inhibitor cocktail | Roche | 11697498001 |
| 3xFLAG peptide | Sigma-Aldrich | F4799 |
| Methionine methyl ester | Sigma-Aldrich | 860409 |
| Experimental Models: Cell Lines | ||
| HeLa | ATCC | CCL-2 |
| HEK293T | ATCC | CRL-11268 |
| Oligonucleotides | ||
| siRNA targeting myrlysin | Dharmacon | J-018197-20 |
| siRNA targeting RICTOR | Cell Signaling Technology | 8649 |
| Non-targeting siRNA | Eurofins | UGGUUUACAUGUCGACUAAUU |
| Recombinant DNA | ||
| GFP-mSIN1.2 | Addgene | 72908 |
| LAMP1-mCherry | Jia et al., 2017 | N/A |
| Software and Algorithms | ||
| Microsoft Excel | Microsoft | https://products.office.com/en-us/excel |
| Flow-jo | Flow-jo | https://www.flowjo.com/ |
| Prism 7 | GraphPad software | https://www.graphpad.com/scientific-software/prism/ |
| ImageJ | National Institutes of Health | https://imagej.nih.gov/ij/ |
| Other | ||
| Dulbecco’s Modified Eagle Medium | Corning | 15-013-CV |
| Fetal bovine serum | Corning | 35-011-CV |
| L-glutamine | Corning | 25-005-CI |
| DMEM without amino acids | MyBioSource | MBS653087 |
| Fetal bovine serum, dialyzed | ThermoFisher Scientific | A3382001 |
| Oligofectamine transfection reagent | ThermoFisher Scientific | 12252011 |
| Lipofectamine 2000 transfection reagent | ThermoFisher Scientific | 11668019 |
| Anti-FLAG magnetic beads | Sigma-Aldrich | M8823 |
Highlights.
- Central clustering of lysosomes delays mTORC1 reactivation by serum but not amino acids
- Central clustering of lysosomes also delays mTORC2 and AKT reactivation by serum
- Subpopulations of mTORC2 and AKT exist in association with lysosomes
- Not only mTORC1 but also mTORC2 and AKT activity depend on lysosome positioning
Acknowledgments
We thank Carlos Guardia, Mary Lilly, Rafael Mattera and Jing Pu for critical reading of the manuscript, and all the members of the Bonifacino lab for helpful discussions. This work was supported by the Intramural Program of NICHD (project ZIA HD001607).
Footnotes
Declaration of Interests
The authors declare no conflicts of interests.
References
- Abu-Remaileh M, Wyant GA, Kim C, Laqtom NN, Abbasi M, Chan SH, Freinkman E, and Sabatini DM (2017). Lysosomal metabolomics reveals V-ATPase- and mTOR-dependent regulation of amino acid efflux from lysosomes. Science 358, 807–813. [DOI] [PMC free article] [PubMed] [Google Scholar]
- Arias E, Koga H, Diaz A, Mocholi E, Patel B, and Cuervo AM (2015). Lysosomal mTORC2/PHLPP1/Akt Regulate Chaperone-Mediated Autophagy. Mol Cell 59, 270–284. [DOI] [PMC free article] [PubMed] [Google Scholar]
- Bar-Peled L, Schweitzer LD, Zoncu R, and Sabatini DM (2012). Ragulator is a GEF for the rag GTPases that signal amino acid levels to mTORC1. Cell 150, 1196–1208. [DOI] [PMC free article] [PubMed] [Google Scholar]
- Berchtold D, and Walther TC (2009). TORC2 plasma membrane localization is essential for cell viability and restricted to a distinct domain. Mol Biol Cell 20, 1565–1575. [DOI] [PMC free article] [PubMed] [Google Scholar]
- Betz C, Stracka D, Prescianotto-Baschong C, Frieden M, Demaurex N, and Hall MN (2013). mTOR complex 2-Akt signaling at mitochondria-associated endoplasmic reticulum membranes (MAM) regulates mitochondrial physiology. Proceedings of the National Academy of Sciences 110, 12526–12534. [DOI] [PMC free article] [PubMed] [Google Scholar]
- Bonifacino JS, and Neefjes J (2017). Moving and positioning the endolysosomal system. Curr Opin Cell Biol 47, 1–8. [DOI] [PMC free article] [PubMed] [Google Scholar]
- Boulbés DR, Shaiken T, and Sarbassov DD (2011). Endoplasmic reticulum is a main localization site of mTORC2. Biochem Biophys Res Commun 413, 46–52. [DOI] [PMC free article] [PubMed] [Google Scholar]
- Burnett PE, Barrow RK, Cohen NA, Snyder SH, and Sabatini DM (1998). RAFT1 phosphorylation of the translational regulators p70 S6 kinase and 4E-BP1. Proc Natl Acad Sci U S A 95, 1432–1437. [DOI] [PMC free article] [PubMed] [Google Scholar]
- Casamayor A, Morrice NA, and Alessi DR (1999). Phosphorylation of Ser-241 is essential for the activity of 3-phosphoinositide-dependent protein kinase-1: identification of five sites of phosphorylation in vivo. Biochem J 342, 287–292. [PMC free article] [PubMed] [Google Scholar]
- Chang CH, Chan PC, Li JR, Chen CJ, Shieh JJ, Fu YC, Chen HC, and Wu MJ (2015). Gab1 is essential for membrane translocation, activity and integrity of mTORCs after EGF stimulation in urothelial cell carcinoma. Oncotarget 6, 1478–1489. [DOI] [PMC free article] [PubMed] [Google Scholar]
- Clippinger AJ, and Alwine JC (2012). Dynein mediates the localization and activation of mTOR in normal and human cytomegalovirus-infected cells. Genes & development 26, 2015–2026. [DOI] [PMC free article] [PubMed] [Google Scholar]
- Clippinger AJ, Maguire TG, and Alwine JC (2011). Human cytomegalovirus infection maintains mTOR activity and its perinuclear localization during amino acid deprivation. Journal of virology JVI. 05102–11. [DOI] [PMC free article] [PubMed] [Google Scholar]
- Demetriades C, Doumpas N, and Teleman AA (2014). Regulation of TORC1 in response to amino acid starvation via lysosomal recruitment of TSC2. Cell 156, 786–799. [DOI] [PMC free article] [PubMed] [Google Scholar]
- Dibble CC, and Cantley LC (2015). Regulation of mTORC1 by PI3K signaling. Trends Cell Biol 25, 545–555. [DOI] [PMC free article] [PubMed] [Google Scholar]
- Dykes SS, Gray AL, Coleman DT, Saxena M, Stephens CA, Carroll JL, Pruitt K, and Cardelli JA (2016). The Arf-like GTPase Arl8b is essential for three-dimensional invasive growth of prostate cancer in vitro and xenograft formation and growth in vivo. Oncotarget 7, 31037–31052. [DOI] [PMC free article] [PubMed] [Google Scholar]
- Ebner M, Sinkovics B, Szczygieł M, Ribeiro DW, and Yudushkin I (2017). Localization of mTORC2 activity inside cells. J Cell Biol 216, 343–353. [DOI] [PMC free article] [PubMed] [Google Scholar]
- Filipek PA, de Araujo MEG, Vogel GF, De Smet CH, Eberharter D, Rebsamen M, Rudashevskaya EL, Kremser L, Yordanov T, Tschaikner P, Fürnrohr BG, Lechner S, Dunzendorfer-Matt T, Scheffzek K, Bennett KL, Superti-Furga G, Lindner HH, Stasyk T, and Huber LA (2017). LAMTOR/Ragulator is a negative regulator of Arl8b- and BORC-dependent late endosomal positioning. J Cell Biol 216, 4199–4215. [DOI] [PMC free article] [PubMed] [Google Scholar]
- Frech M, Andjelkovic M, Ingley E, Reddy KK, Falck JR, and Hemmings BA (1997). High affinity binding of inositol phosphates and phosphoinositides to the pleckstrin homology domain of RAC/protein kinase B and their influence on kinase activity. J Biol Chem 272, 8474–8481. [DOI] [PubMed] [Google Scholar]
- Guardia CM, Farías GG, Jia R, Pu J, and Bonifacino JS (2016). BORC Functions Upstream of Kinesins 1 and 3 to Coordinate Regional Movement of Lysosomes along Different Microtubule Tracks. Cell Rep 17, 1950–1961. [DOI] [PMC free article] [PubMed] [Google Scholar]
- Guertin DA, and Sabatini DM (2007). Defining the role of mTOR in cancer. Cancer Cell 12, 9–22. [DOI] [PubMed] [Google Scholar]
- Hämälistö S, and Jäättelä M (2016). Lysosomes in cancer-living on the edge (of the cell). Curr Opin Cell Biol 39, 69–76. [DOI] [PMC free article] [PubMed] [Google Scholar]
- Heuser J (1989). Changes in lysosome shape and distribution correlated with changes in cytoplasmic pH. J Cell Biol 108, 855–864. [DOI] [PMC free article] [PubMed] [Google Scholar]
- Hirata N, Suizu F, Matsuda-Lennikov M, Tanaka T, Edamura T, Ishigaki S, Donia T, Lithanatudom P, Obuse C, Iwanaga T, and Noguchi M (2018). Functional characterization of lysosomal interaction of Akt with VRK2. Oncogene [DOI] [PMC free article] [PubMed] [Google Scholar]
- Hresko RC, and Mueckler M (2005). mTOR· RICTOR is the Ser473 kinase for Akt/protein kinase B in 3T3-L1 adipocytes. Journal of Biological Chemistry 280, 40406–40416. [DOI] [PubMed] [Google Scholar]
- Hsu PP, Kang SA, Rameseder J, Zhang Y, Ottina KA, Lim D, Peterson TR, Choi Y, Gray NS, Yaffe MB, Marto JA, and Sabatini DM (2011). The mTOR-regulated phosphoproteome reveals a mechanism of mTORC1-mediated inhibition of growth factor signaling. Science 332, 1317–1322. [DOI] [PMC free article] [PubMed] [Google Scholar]
- Hwang Y, Kumar P, and Barakat AI (2014). Intracellular regulation of cell signaling cascades: how location makes a difference. J Math Biol 69, 213–242. [DOI] [PubMed] [Google Scholar]
- Inoki K, Li Y, Zhu T, Wu J, and Guan K-L (2002). TSC2 is phosphorylated and inhibited by Akt and suppresses mTOR signalling. Nature cell biology 4, 648. [DOI] [PubMed] [Google Scholar]
- Jia R, Guardia CM, Pu J, Chen Y, and Bonifacino JS (2017). BORC coordinates encounter and fusion of lysosomes with autophagosomes. Autophagy 13, 1648–1663. [DOI] [PMC free article] [PubMed] [Google Scholar]
- Jung J, Genau HM, and Behrends C (2015). Amino Acid-Dependent mTORC1 Regulation by the Lysosomal Membrane Protein SLC38A9. Mol Cell Biol 35, 2479–2494. [DOI] [PMC free article] [PubMed] [Google Scholar]
- Kim J, Kundu M, Viollet B, and Guan KL (2011). AMPK and mTOR regulate autophagy through direct phosphorylation of Ulk1. Nat Cell Biol 13, 132–141. [DOI] [PMC free article] [PubMed] [Google Scholar]
- Korolchuk VI, Saiki S, Lichtenberg M, Siddiqi FH, Roberts EA, Imarisio S, Jahreiss L, Sarkar S, Futter M, Menzies FM, O’Kane CJ, Deretic V, and Rubinsztein DC (2011). Lysosomal positioning coordinates cellular nutrient responses. Nat Cell Biol 13, 453–460. [DOI] [PMC free article] [PubMed] [Google Scholar]
- Long WM, Chua BH, Lautensack N and Morgan HE (1983) Effects of amino acid methyl esters on cardiac lysosomes and protein degradation. Am J Physiol. 245, C101–112. [DOI] [PubMed] [Google Scholar]
- Liu P, Gan W, Inuzuka H, Lazorchak AS, Gao D, Arojo O, Liu D, Wan L, Zhai B, Yu Y, Yuan M, Kim BM, Shaik S, Menon S, Gygi SP, Lee TH, Asara JM, Manning BD, Blenis J, Su B, and Wei W (2013). Sin1 phosphorylation impairs mTORC2 complex integrity and inhibits downstream Akt signalling to suppress tumorigenesis. Nat Cell Biol 15, 1340–1350. [DOI] [PMC free article] [PubMed] [Google Scholar]
- Liu P, Guo J, Gan W, and Wei W (2014). Dual phosphorylation of Sin1 at T86 and T398 negatively regulates mTORC2 complex integrity and activity. Protein Cell 5, 171–177. [DOI] [PMC free article] [PubMed] [Google Scholar]
- Long X, Lin Y, Ortiz-Vega S, Yonezawa K, and Avruch J (2005). Rheb binds and regulates the mTOR kinase. Current Biology 15, 702–713. [DOI] [PubMed] [Google Scholar]
- Manning BD, and Toker A (2017). AKT/PKB Signaling: Navigating the Network. Cell 169, 381–405. [DOI] [PMC free article] [PubMed] [Google Scholar]
- Miaczynska M, Christoforidis S, Giner A, Shevchenko A, Uttenweiler-Joseph S, Habermann B, Wilm M, Parton RG, and Zerial M (2004). APPL proteins link Rab5 to nuclear signal transduction via an endosomal compartment. Cell 116, 445–456. [DOI] [PubMed] [Google Scholar]
- Mitsuuchi Y, Johnson SW, Sonoda G, Tanno S, Golemis EA, and Testa JR (1999). Identification of a chromosome 3p14.3–21.1 gene, APPL, encoding an adaptor molecule that interacts with the oncoprotein-serine/threonine kinase AKT2. Oncogene 18, 4891–4898. [DOI] [PubMed] [Google Scholar]
- Mrakovic A, Kay JG, Furuya W, Brumell JH, and Botelho RJ (2012). Rab7 and Arl8 GTPases are necessary for lysosome tubulation in macrophages. Traffic 13, 1667–1679. [DOI] [PubMed] [Google Scholar]
- Naegeli KM, Hastie E, Garde A, Wang Z, Keeley DP, Gordon KL, Pani AM, Kelley LC, Morrissey MA, Chi Q, Goldstein B, and Sherwood DR (2017). Cell Invasion In Vivo via Rapid Exocytosis of a Transient Lysosome-Derived Membrane Domain. Dev Cell 43, 403–417.e10. [DOI] [PMC free article] [PubMed] [Google Scholar]
- Niwa S, Tao L, Lu SY, Liew GM, Feng W, Nachury MV, and Shen K (2017). BORC Regulates the Axonal Transport of Synaptic Vesicle Precursors by Activating ARL-8. Curr Biol 27, 2569–2578.e4. [DOI] [PMC free article] [PubMed] [Google Scholar]
- Oh WJ, Wu C, Kim SJ, Facchinetti V, Julien L, Finlan M, Roux PP, Su B, and Jacinto E (2010). mTORC2 can associate with ribosomes to promote cotranslational phosphorylation and stability of nascent Akt polypeptide. The EMBO journal 29, 3939–3951. [DOI] [PMC free article] [PubMed] [Google Scholar]
- Partovian C, Ju R, Zhuang ZW, Martin KA, and Simons M (2008). Syndecan-4 regulates subcellular localization of mTOR Complex2 and Akt activation in a PKCα-dependent manner in endothelial cells. Molecular cell 32, 140–149. [DOI] [PMC free article] [PubMed] [Google Scholar]
- Petersen MC, and Shulman GI (2018). Mechanisms of Insulin Action and Insulin Resistance. Physiol Rev 98, 2133–2223. [DOI] [PMC free article] [PubMed] [Google Scholar]
- Potter CJ, Pedraza LG, and Xu T (2002). Akt regulates growth by directly phosphorylating Tsc2. Nature cell biology 4, 658. [DOI] [PubMed] [Google Scholar]
- Pu J, Guardia CM, Keren-Kaplan T, and Bonifacino JS (2016). Mechanisms and functions of lysosome positioning. J Cell Sci 129, 4329–4339. [DOI] [PMC free article] [PubMed] [Google Scholar]
- Pu J, Keren-Kaplan T, and Bonifacino JS (2017). A Ragulator-BORC interaction controls lysosome positioning in response to amino acid availability. J Cell Biol 216, 4183–4197. [DOI] [PMC free article] [PubMed] [Google Scholar]
- Pu J, Schindler C, Jia R, Jarnik M, Backlund P, and Bonifacino JS (2015). BORC, a multiprotein complex that regulates lysosome positioning. Dev. Cell 33, 176–188. [DOI] [PMC free article] [PubMed] [Google Scholar]
- Rebsamen M, Pochini L, Stasyk T, de Araújo ME, Galluccio M, Kandasamy RK, Snijder B, Fauster A, Rudashevskaya EL, Bruckner M, Scorzoni S, Filipek PA, Huber KV, Bigenzahn JW, Heinz LX, Kraft C, Bennett KL, Indiveri C, Huber LA, and Superti-Furga G (2015). SLC38A9 is a component of the lysosomal amino acid sensing machinery that controls mTORC1. Nature 519, 477–481. [DOI] [PMC free article] [PubMed] [Google Scholar]
- Rosa-Ferreira C, and Munro S (2011). Arl8 and SKIP act together to link lysosomes to kinesin-1. Dev Cell 21, 1171–1178. [DOI] [PMC free article] [PubMed] [Google Scholar]
- Saci A, Cantley LC, and Carpenter CL (2011). Rac1 regulates the activity of mTORC1 and mTORC2 and controls cellular size. Mol Cell 42, 50–61. [DOI] [PMC free article] [PubMed] [Google Scholar]
- Sancak Y, Bar-Peled L, Zoncu R, Markhard AL, Nada S, and Sabatini DM (2010). Ragulator-Rag complex targets mTORC1 to the lysosomal surface and is necessary for its activation by amino acids. Cell 141, 290–303. [DOI] [PMC free article] [PubMed] [Google Scholar]
- Sarbassov DD, Guertin DA, Ali SM, and Sabatini DM (2005). Phosphorylation and regulation of Akt/PKB by the rictor-mTOR complex. Science 307, 1098–1101. [DOI] [PubMed] [Google Scholar]
- Saxton RA, and Sabatini DM (2017). mTOR Signaling in Growth, Metabolism, and Disease. Cell 169, 361–371. [DOI] [PubMed] [Google Scholar]
- Scheid MP, Parsons M, and Woodgett JR (2005). Phosphoinositide-dependent phosphorylation of PDK1 regulates nuclear translocation. Mol Cell Biol 25, 2347–2363. [DOI] [PMC free article] [PubMed] [Google Scholar]
- Schiefermeier N, Scheffler JM, de Araujo ME, Stasyk T, Yordanov T, Ebner HL, Offterdinger M, Munck S, Hess MW, Wickstrom SA, Lange A, Wunderlich W, Fassler R, Teis D, and Huber LA (2014). The late endosomal p14-MP1 (LAMTOR2/3) complex regulates focal adhesion dynamics during cell migration. J Cell Biol 205, 525–540. [DOI] [PMC free article] [PubMed] [Google Scholar]
- Schroder WA, Buck M, Cloonan N, Hancock JF, Suhrbier A, Sculley T, and Bushell G (2007). Human Sin1 contains Ras-binding and pleckstrin homology domains and suppresses Ras signalling. Cell Signal 19, 1279–1289. [DOI] [PubMed] [Google Scholar]
- Shen K, and Sabatini DM (2018). Ragulator and SLC38A9 activate the Rag GTPases through noncanonical GEF mechanisms. Proc Natl Acad Sci U S A [DOI] [PMC free article] [PubMed] [Google Scholar]
- Stephens L, Anderson K, Stokoe D, Erdjument-Bromage H, Painter GF, Holmes AB, Gaffney PR, Reese CB, McCormick F, Tempst P, Coadwell J, and Hawkins PT (1998). Protein kinase B kinases that mediate phosphatidylinositol 3,4,5-trisphosphate-dependent activation of protein kinase B. Science 279, 710–714. [DOI] [PubMed] [Google Scholar]
- Taguchi A, and White MF (2008). Insulin-like signaling, nutrient homeostasis, and life span. Annu Rev Physiol 70, 191–212. [DOI] [PubMed] [Google Scholar]
- Thoreen CC, and Sabatini DM (2009). Rapamycin inhibits mTORC1, but not completely. Autophagy 5, 725–726. [DOI] [PubMed] [Google Scholar]
- Walton ZE, Patel CH, Brooks RC, Yu Y, Ibrahim-Hashim A, Riddle M, Porcu A, Jiang T, Ecker BL, and Tameire F (2018). Acid Suspends the Circadian Clock in Hypoxia through Inhibition of mTOR. Cell [DOI] [PMC free article] [PubMed] [Google Scholar]
- Wang S, Tsun ZY, Wolfson RL, Shen K, Wyant GA, Plovanich ME, Yuan ED, Jones TD, Chantranupong L, Comb W, Wang T, Bar-Peled L, Zoncu R, Straub C, Kim C, Park J, Sabatini BL, and Sabatini DM (2015). Lysosomal amino acid transporter SLC38A9 signals arginine sufficiency to mTORC1. Science 347, 188–194. [DOI] [PMC free article] [PubMed] [Google Scholar]
- Wolfson RL, and Sabatini DM (2017). The Dawn of the Age of Amino Acid Sensors for the mTORC1 Pathway. Cell Metab 26, 301–309. [DOI] [PMC free article] [PubMed] [Google Scholar]
- Yu Y, Yoon SO, Poulogiannis G, Yang Q, Ma XM, Villén J, Kubica N, Hoffman GR, Cantley LC, Gygi SP, and Blenis J (2011). Phosphoproteomic analysis identifies Grb10 as an mTORC1 substrate that negatively regulates insulin signaling. Science 332, 1322–1326. [DOI] [PMC free article] [PubMed] [Google Scholar]
- Zinzalla V, Stracka D, Oppliger W, and Hall MN (2011). Activation of mTORC2 by association with the ribosome. Cell 144, 757–768. [DOI] [PubMed] [Google Scholar]
Associated Data
This section collects any data citations, data availability statements, or supplementary materials included in this article.
Supplementary Materials
Supplement