Nucleosome organization in the Drosophila genome (original) (raw)
. Author manuscript; available in PMC: 2009 Aug 31.
Published in final edited form as: Nature. 2008 Apr 13;453(7193):358–362. doi: 10.1038/nature06929
Abstract
Comparative genomics of nucleosome positions provides a powerful means for understanding how the organization of chromatin and the transcription machinery co-evolve. Here we produce a high resolution reference map of H2A.Z and bulk nucleosome locations across the genome of the fly D. melanogaster, and compare it to that from the yeast S. cerevisiae. Like Saccharomyces, Drosophila nucleosomes are organized around active transcription start sites in a canonical −1, NFR (nucleosome-free region), +1 arrangement. However, Drosophila does not incorporate H2A.Z into the −1 nucleosome and does not bury its transcriptional start site in the +1 nucleosome. At thousands of genes, RNA polymerase II engages the +1 nucleosome and pauses. How the transcription initiation machinery contends with the +1 nucleosome appears to be fundamentally different between lower and higher eukaryotes.
Knowledge of the precise location of nucleosomes in a genome is essential in order to understand the context in which chromosomal processes such as transcription and DNA replication operate. A common theme to emerge from recent genome-wide maps of nucleosome locations is a general deficiency of nucleosomes in promoter regions and an enrichment of certain histone modifications towards the 5′ end of genes1–7. A high resolution genomic map of nucleosome locations in the budding yeast S. cerevisiae has further revealed the nucleosomal context of cis-regulatory elements and transcriptional start sites1–7. However such context has not been established in multicellular eukaryotes, and so fundamental questions remain: 1) Is there a common theme by which genes of multicellular eukaryotes position their nucleosomes with respect to functional chromosomal elements? 2) Are such themes and their underlying rules evolutionarily conserved across eukaryotes? 3) What are the functional implications for those themes that differ across the major eukaryotic lines? To address these questions we have produced a genome-wide high resolution map of H2A.Z/H2Av and bulk nucleosome locations in the embryo of the fruit fly D. melanogaster. H2A.Z is widely distributed in Drosophila8, but some evidence points to specialized roles9,10. In Saccharomyces, H2A.Z replaces H2A at the 5′ end of active genes11–14, and thus provides a focused representation of promoter chromatin architecture.
Drosophila embryos are composed of a wide variety of cell types in which subsets of genes may elicit distinct gene expression programs15,16. Global gene expression profiles during all stages of Drosophila development from 8–12 hrs post fertilization to a young adult fly are correlated (Fig. S1), which possibly reflects the broad expression pattern of the large repertoire of house-keeping genes in most cell types during development15,16. This general spatial and temporal independence of gene expression provides impetus to use whole embryos to develop a reference nucleosome map. Indeed, our map reveals that nucleosomes are generally well organized, despite cell type heterogeneity.
Open and closed chromatin structures are linked to transcription, H2A.Z, and core promoter elements
Embryos were treated with formaldehyde, and H2A.Z nucleosome core particles were immunopurified (Figs. S2–S3). 652,738 H2A.Z-containing nucleosomes were sequenced (Fig. S4), and mapped to 207,025 consensus locations in the Drosophila r5.2 reference genome (Figs. 1a and S2b, see browser at http://atlas.bx.psu.edu/), thereby providing >3-fold depth of coverage (Fig. S5). Correction for micrococcal nuclease (MNase) digestion bias was imposed (Fig. S6). Those 112,750 nucleosomes detected three or more times were further analyzed, although patterns were identical when all nucleosomes were analyzed. The internal median error of the data was 4 bp (Fig. S7).
Figure 1. H2A.Z nucleosomal organization around the 5 ′ end of Drosophila genes.

a, Browser shot of an arbitrary locus (nbs-defl). Bar graph represents the number of “W” or “C” (top and bottom traces, respectively) strand reads mapped to each coordinate. b, Composite distribution of H2A.Z nucleosomes relative to the TSS. Nearby genes were either included (gray) or eliminated (black) from the analysis, and normalized accordingly. The equivalent Saccharomyces profile is shown in green1. c, Correlation of the number of H2A.Z nucleosomal sequencing reads (per gene) to mRNA levels in 8–12 hr embryos.
Fig. 1b displays the predominant embryonic distribution of H2A.Z nucleosomes relative to the transcription start site (TSS) of all coding genes, and is compared to the pattern previously derived from Saccharomyces1. Patterns around noncoding genes are shown in Fig. S8. 11,994 of the 14,143 Drosophila coding genes (85%) contained at least one H2A.Z nucleosome (detected three or more times) within 1 kb of the TSS. H2A.Z levels correlated with gene expression (Figs. 1c and S9), as has been seen on individual genes and in Saccharomyces12,13,17.
H2A.Z nucleosomes were predominantly distributed at 175 bp intervals from the TSS (compared to 165 bp in Saccharomyces1, Fig. 1b), demonstrating that a predominant organizational pattern exists for H2A.Z nucleosomes in Drosophila embryos that transcends a spatial and temporal context. The H2A.Z pattern was compared to the distribution of bulk nucleosomes (i.e., those containing any combination of H2A.Z and H2A), determined using high density tiling arrays (36 bp probe spacing). Within genic regions the same organizational pattern was found (Fig. S10). For both datasets, a nucleosome-depleted region was evident immediately upstream of the +1 nucleosome, which likely reflects a nucleosome-free core promoter region (NFR), as first detected in Saccharomcyces7. Like Saccharomyces, a −1 nucleosome was detected ~180 bp upstream of the TSS. However, in contrast, it lacked H2A.Z.
Surprisingly, the genic array of Drosophila nucleosomes, started ~75 bp further downstream from the equivalent position in Saccharomyces, placing the +1 nucleosome at +135 (Figs. 1b and S10). This shift has important implications in how the TSS is presented to RNA polymerase II (Pol II). In Saccharomyces, the TSS resides within the nucleosome border potentially allowing the nucleosome to regulate start site selection and efficiency1. In Drosophila, the predominant arrangement of nucleosomes might allow unimpeded access to the TSS with potential blockage occurring downstream after initiation.
Drosophila have well-defined core promoter elements such as TATA, Initiator, DPE, and MTE which bind to the general transcription machinery18–22, although these elements are not found in most genes. For genes lacking these core promoter elements or having a DPE, the canonical nucleosome organization was observed (black pattern in Fig. S11), which was more robust when only H2A.Z containing nucleosomes were examined (blue pattern). In contrast, genes containing TATA, Inr, or MTE had a diminished canonical nucleosome organization and a diminished NFR, indicating that these classes of genes may have a more compact and gene-specific chromatin architecture, including a positioned nucleosome over the TSS. Consequently, they might be more dependent upon chromatin remodelling for expression. When genes become transcriptionally competent, resident nucleosomes could adopt a more open and canonical organization, which includes replacing H2A with H2A.Z. Three observations support this hypothesis. First, H2A.Z and bulk nucleosomes at highly expressed genes were more uniformly organized than those at lowly expressed genes (Fig. S9). Second, bulk nucleosomes for genes that contained H2A.Z at their 5′ end displayed the canonical pattern, while those lacking H2A.Z did not (Fig. S10, black plot vs red trace). Third, within any class of genes except those having an Initiator, H2A.Z nucleosomes adopted a more canonical organization than the bulk set of nucleosomes (Fig. S11). These results suggest that transcription and the presence of H2A.Z are linked to an open and uniform chromatin architecture at promoter regions.
Conserved DNA motifs and H2A.Z nucleosomes are organized around each other
Recent genome sequencing of 12 Drosophila species of differing evolutionary distance has provided an unprecedented opportunity to identify conserved DNA sequence motifs23. In comparing the distribution of motifs around the TSS23, we found four recurring patterns: 27 motifs were classified as “nucleosomal”, 57 as “anti-nucleosomal”, 12 as “fixed”, and 98 as “random” (left panels in Fig. 2a and Fig. S12). “Nucleosomal” and “anti-nucleosomal” patterns matched the general distribution of where nucleosomes were relatively enriched or depleted, respectively, relative to the TSS (see Fig. 1b). “Fixed” elements were at a defined distance from the TSS, and “random” elements lacked patterning. The “nucleosomal” and “anti-nucleosomal” patterns suggest that certain motifs are organized to be downstream of the TSS in the midst of nucleosomal arrays, while others are organized to be upstream of the TSS, where nucleosomes are relatively depleted.
Figure 2. Organization of conserved DNA motifs around TSSs (left) and nucleosomes (right).

a, Distribution of representative conserved DNA motifs from four distribution classes. b, Distribution of all motifs plotted with Treeview46. Bin counts from all motifs in Fig. S12 were converted to fold deviations from the regional average (−/+ 1 kb), converted to a log2 scale, and plotted. Red/black/green denotes above, near, or below average deviations, respectively.
We examined the organizational relationship of these DNA motifs to individual H2A.Z nucleosomes genome-wide (right panels of Fig. 2a and Fig. S12, and all motifs in Fig. 2b). Strikingly, “nucleosomal” motifs were consistently enriched on the H2A.Z nucleosome surface, whereas “anti-nucleosomal” motifs were consistently depleted. Individual “fixed” motifs were mostly depleted of H2A.Z nucleosomes. These findings along with several controls (Fig. S13) suggest that motifs and nucleosomes adopt a preferred organization around each other, regardless of their genomic location. This organization could be linked to co-evolution of base sequence composition bias in and around nucleosomes. The functional importance of such context remains to be determined.
Drosophila use a CC/GG patterning rather than AA/TT for demarcating nucleosome positions
We examined whether the positions of Drosophila H2A.Z nucleosomes are at least partly defined by the underlying DNA sequence pattern, and whether such pattern might be evolutionarily conserved. We determined the frequency of dinucleotides across Drosophila H2A.Z nucleosomal DNA since 10 bp periodic patterns of certain dinucleotides enhance the wrapping and positioning of DNA around the histone core (Figs. 3a and S14). As seen in Saccharomyces, 10 bp periodic patterns of A/T dinucleotides running counter-phase to G/C dinucleotide was observed. The modest amplitudes of the pattern suggest that such periodicities are infrequent, and thus used selectively (i.e., most nucleosomes lack underlying positioning signals).
Figure 3. Positioning properties of Drosophila nucleosomes and DNA.

a, Composite distribution of WW and SS dinucleotides (as indicated) along the 147 bp axis of nucleosomal DNA (p-value = 0). The equivalent yeast profile1 is shown in light shading in the background. b, Average correlation of all Drosophila promoter regions to nucleosome positioning sequence (NPS) patterns, comparing an AA/TT and a CC/GG pattern. The distribution of H2A.Z nucleosomes from Fig. 1b is shown as a gray backdrop. The span of the +1 nucleosome is indicated by the horizontal bar.
We further investigated the rules of nucleosome positioning by scanning promoter regions for correlations to nucleosome positioning sequences previously identified for a relatively small number of yeast or human nucleosomes24, in which AA/TT (yeast25 and worms26) or CC/GG (human)27 dinucleotides occur in a biased and/or periodic arrangement across nucleosomal DNA. Unlike in yeast, the AA/TT positioning pattern failed to identify nucleosome locations (Fig. 3b, black trace). However, the CC/GG pattern (Fig. S15) reproduced the exact position of the +1 nucleosomes (Fig. 3b, red trace), indicating that the Drosophila +1 nucleosome may be positioned in part by CC/GG-based positioning sequences that are utilized preferentially in metazoans. Consistent with this, +1 nucleosomes are highly positioned around the 5′ end of genes (Fig. S16).
Nucleosome-free regions reside at the end of active genes
Despite H2A.Z being enriched at the 5′ end of genes, substantial levels were detected throughout the genome, which allowed us to examine nucleosome organization at the 3′ end of genes (Figs. 4a and S17a). Strikingly, H2A.Z nucleosome levels spiked near the ORF end points then dropped precipitously further downstream into the intergenic regions, where transcripts terminate. The spike occurred ~30 bp upstream from the stop codon and ~160 bp upstream of the transcript polyA site. A similar nucleosome drop-off was seen when bulk nucleosomes were examined (Fig. S17b), but was not evident at genes that lacked H2A.Z. Thus, like the 5′ end, the presence of H2A.Z may be linked to a more open chromatin architecture at the 3′ end of genes. The change in nucleosome density coincided with alterations in nucleosome positioning sequences (Fig. 4b). Thus, such “3′-NFRs” might be defined in part by the underlying DNA sequence. Conceivably, 3′ NFRs might function in transcription termination.
Figure 4. H2A.Z nucleosomal organization around the 3′ end of Drosophila genes.

a, Composite distribution of nucleosomes relative to ORF end points. Also shown is the distribution of transcript termination sites (polyA sites) in red. Nearby genes were either included (gray) or eliminated (black) from the analysis. b, Average correlation of all Drosophila gene terminal regions to AA/TT or CC/GG NPS patterns. The nucleosome profile from panel a is shown as a gray backdrop.
RNA polymerase II contacts the +1 nucleosome and pauses
The location of the +1 nucleosome at the 5′ end of genes is striking because its upstream border resides at approximately +62 (relative to the TSS), which is near where Pol II pauses during the transcription cycle3,28–32. To examine the potential linkage between Pol II pausing and nucleosome positions, we first determined the genome-wide location of Pol II in embryos at 1,956 putatively paused genes (Fig. 5a). Pol II was concentrated in a ~300 bp region that peaked around +90, which overlaps the region bound by the +1 nucleosome, and is consistent with other recent placements30–32. Indeed, the distribution of paused Pol II, as directly measured by permanganate reactivity of thymines on a statistically robust subset of ~50 genes (yellow trace in Figs. 5a and S18a), indicates that pausing occurs between +20 and +50 with the center at +3530. This high resolution permanganate footprinting data, which represents the most definitive means of assessing Pol II pausing, places the front edge of Pol II (~16 bp downstream of the bubble33) within ~10 bp of the +1 nucleosome border.
Figure 5. Distribution of Pol II and Pol II-engaged nucleosomes around the 5′ end of genes.
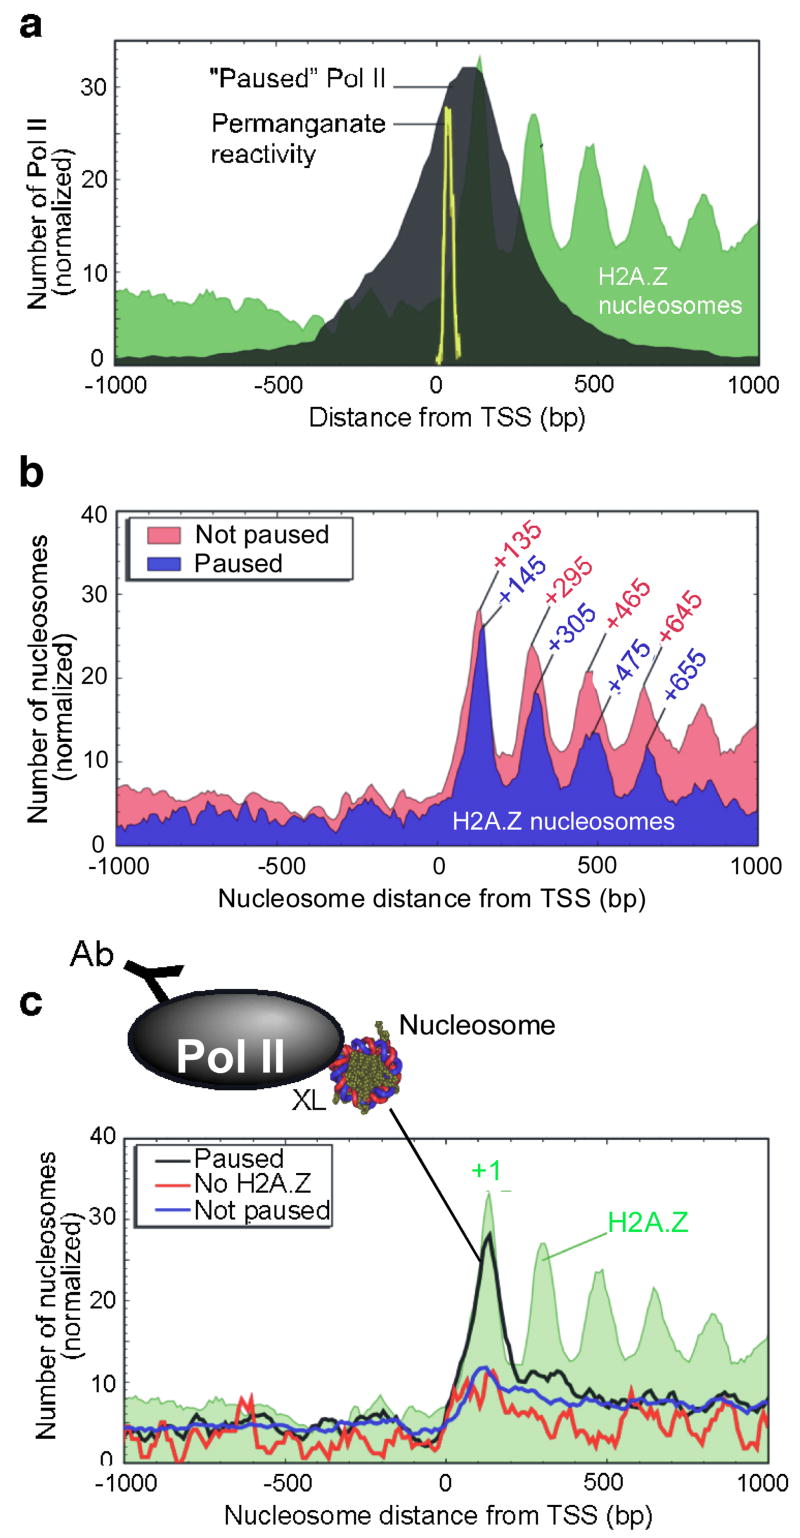
a, Genome-wide location of “Paused” Pol II relative to the TSS. ChIP-chip genomic profiling of Pol II was conducted on Drosophila embryos. The black filled plot shows the distribution of Pol II at 1,956 “Paused” Pol II genes (see Methods). The yellow trace shows the distribution of permanganate-reactive thymines (an indicator of pausing) in 50 genes that undergo pausing30. The distribution of Pol II at these 50 genes is similar to the bulk profile (Fig. S18a). b, H2A.Z nucleosomal distribution at 1,956 genes that contained “Paused” Pol II. The “Not paused” class represents those where Pol II is either absent or not paused. c, Distribution of Pol II-bound nucleosomes. Pol II ChIP was performed on bulk MNase-digested mono-nucleosomal DNA and hybridized to genome-wide tiling arrays. The three traces include distributions at 1,956 Pol II “Paused” genes, and control distributions either at 788 genes that have “No H2A.Z” within 1 kb of the TSS, or at 8,736 genes of the “Not paused” class.
The location of the +1 H2A.Z nucleosome was similar (but not identical) whether or not paused Pol II was present (Fig. 5b), indicating that Pol II was not likely to be the cause of the nucleosome shift compared to Saccharomyces. Rather, the positioned +1 nucleosome might be contributing to pol II pausing, which is consistent with other studies34–37. Other factors including NELF are likely to make significant contributions to pausing as well30,38,39.
Intriguingly, genes that contained a paused Pol II showed a ~10 bp downstream shift of H2A.Z nucleosomes (P-value = 10−9; Fig. 5b). The same shift was observed if H2A.Z sequencing reads (rather than nucleosomes) or bulk nucleosomes are plotted (Fig. S19a,b). The shift suggests that as part of the pausing process, Pol II collides with the +1 nucleosome, possibly displacing it downstream by one turn of the DNA helix. If the downstream nucleosomes are positioned in large part by the principles of statistical positioning40,41, rather than the underlying DNA sequence, then a shift of the +1 nucleosome is expected to have a ripple effect on downstream nucleosomes.
To test the prediction that Pol II is engaging the +1 nucleosome, bulk mononucleosomes were prepared from formaldehyde crosslinked embryos and immunoprecipitated with antibodies directed against Pol II. DNA corresponding to mononucleosomes (~150 bp) was gel-purified and mapped to the entire Drosophila genome with high resolution tiling arrays. Fig. 5c (black trace) shows that the distribution of nucleosome-Pol II crosslinking at Pol II-paused genes peaked at the +1 nucleosome. This was not seen at genes lacking a paused Pol II or H2A.Z. The selective enrichment at +1 demonstrates that Pol II is predominantly engaged with the +1 nucleosome, and thus the +1 nucleosome may be instrumental in establishing the paused state.
Conclusions
The high resolution map of Drosophila nucleosomes reveals evolutionarily conserved and divergent principles of nucleosome organization. Genes that possess H2A.Z nucleosomes are likely to have experienced a transcription event. They tend to have nucleosome-free promoter and termination regions and intervening arrays of uniformly positioned nucleosomes that become less uniform towards the 3′ end of the gene. H2A.Z nucleosomes in general might not block assembly of the transcription machinery at transcriptionally “experienced” promoters. However, repressed promoters or those containing Initiator elements do appear to have an H2A nucleosome over the TSS.
Conserved DNA sequence motifs (and thus any proteins that bind to them) tend to have an organizational relationship with nucleosomes. “Anti-nucleosomal” motifs including those for proteins such as engrailed, even skipped, fushi tarzu, giant, hunchback, and knirps tend to be located upstream of the TSS and might contribute to the exclusion of nucleosomes over the core promoter. Indeed some have anti-nucleosomal activity42,43. “Nucleosomal” motifs include sites for achaete, antennapedia, dorsal, tramtrack, and others. Their preference for locations downstream of the TSS where nucleosomes are well organized raises the possibility that they contribute to nucleosome organization.
In Saccharomyces, the location of the TSS just inside the +1 nucleosome border, allows the nucleosome to potentially exert control over initiation, whereas in Drosophila, the general case may be to position the +1 nucleosome to interact with a transcriptionally engaged paused polymerase. Whether the +1 nucleosome is causative or just participatory in the pausing is not known. It is now becoming clear that metazoans regulate transcription in large part through Pol II pausing rather than solely through transcription complex assembly3,31,32,44. The nucleosome map and its context to DNA regulatory elements, presented here, provides a framework for designing experiments and analyzing existing data to understand how metazoans regulate transcription.
METHODS SUMMARY
D. melanogaster embryos (0–12 hr) were collected and crosslinked with formaldehyde. H2A.Z was immunoprecipitated from chromatin digested with MNase. Mononucleosomal DNA was gel-purified and sequenced using Roche GS20/FLX pyrosequencing technology1,45. Chromatin from crosslinked embryos was also solubilized by sonication and/or MNase digestion, where indicated, and Pol II immunoprecipitated. Bulk nucleosomes were not immunoprecipitated. MNase-treated samples were gel-purified in the 75–200 bp range. DNA samples were then hybridized to Affymetrix Drosophila tiling microarrays (36 bp average probe spacing).
Supplementary Material
MethodsFigsTab
Full Methods and any associated references are available in the online version of the paper at www.nature.com/nature.
Supplementary Information is linked to the online version of the paper at www.nature.com/nature.
Acknowledgments
This work was supported by grants HG004160 (BFP), and GM47477 (DSG). We thank M. Biggin for early access to the Pol II ChIP-chip data, Ruopeng Fan for supplying the rpb3 antibody, and Chanhyo Lee for help in identifying paused Pol II.
Footnotes
Author Information Sequence data deposition is through NCBI Trace Archives TI SRA000283, Sequencing Center = “CCGB”, and microarray deposition through ArrayExpress, Accession numbers E-MEXP-1515 and -1519. Reprints and permissions information is available at www.nature.com/reprints. The authors declare no competing financial interest.
Author Contributions T.M. prepared and purified the nucleosomes including Pol II-bound nucleosomes; C.J. analyzed the nucleosome mapping data and its relationship to other genomic features; I.P.I. performed computational analyses related to nucleosome positioning sequences; X.L. conducted ChIP-chip on Pol II; B.J.V. conducted ChIP-chip on nucleosome-Pol II interactions; S.J.Z. provided bioinformatics support; L.T. constructed libraries and sequenced nucleosomal DNA; J.Q. mapped sequencing reads to the yeast genome; RG provided H2A.Z antibodies; SCS directed the DNA sequencing phase; DSG directed embryo preparations and helped interpret the data; I.A. developed computational approaches to derive nucleosome maps from the read locations and developed the associated browser; B.F.P. directed the project, interpreted the data, and wrote the paper.
References
- 1.Albert I, et al. Translational and rotational settings of H2A.Z nucleosomes across the Saccharomyces cerevisiae genome. Nature. 2007;446:572–576. doi: 10.1038/nature05632. [DOI] [PubMed] [Google Scholar]
- 2.Barski A, et al. High-resolution profiling of histone methylations in the human genome. Cell. 2007;129:823–837. doi: 10.1016/j.cell.2007.05.009. [DOI] [PubMed] [Google Scholar]
- 3.Guenther MG, Levine SS, Boyer LA, Jaenisch R, Young RA. A chromatin landmark and transcription initiation at most promoters in human cells. Cell. 2007;130:77–88. doi: 10.1016/j.cell.2007.05.042. [DOI] [PMC free article] [PubMed] [Google Scholar]
- 4.Lee W, et al. A high-resolution atlas of nucleosome occupancy in yeast. Nat Genet. 2007;39:1235–1244. doi: 10.1038/ng2117. [DOI] [PubMed] [Google Scholar]
- 5.Mito Y, Henikoff JG, Henikoff S. Genome-scale profiling of histone H3.3 replacement patterns. Nat Genet. 2005;37:1090–1097. doi: 10.1038/ng1637. [DOI] [PubMed] [Google Scholar]
- 6.Pokholok DK, et al. Genome-wide map of nucleosome acetylation and methylation in yeast. Cell. 2005;122:517–527. doi: 10.1016/j.cell.2005.06.026. [DOI] [PubMed] [Google Scholar]
- 7.Yuan GC, et al. Genome-scale identification of nucleosome positions in S. cerevisiae Science. 2005;309:626–630. doi: 10.1126/science.1112178. [DOI] [PubMed] [Google Scholar]
- 8.Leach TJ, et al. Histone H2A.Z is widely but nonrandomly distributed in chromosomes of Drosophila melanogaster. J Biol Chem. 2000;275:23267–23272. doi: 10.1074/jbc.M910206199. [DOI] [PubMed] [Google Scholar]
- 9.Updike DL, Mango SE. Temporal regulation of foregut development by HTZ-1/H2A.Z and PHA-4/FoxA. PLoS Genet. 2006;2:e161. doi: 10.1371/journal.pgen.0020161. [DOI] [PMC free article] [PubMed] [Google Scholar]
- 10.Swaminathan J, Baxter EM, Corces VG. The role of histone H2Av variant replacement and histone H4 acetylation in the establishment of Drosophila heterochromatin. Genes Dev. 2005;19:65–76. doi: 10.1101/gad.1259105. [DOI] [PMC free article] [PubMed] [Google Scholar]
- 11.Lieb JD, Clarke ND. Control of Transcription through Intragenic Patterns of Nucleosome Composition. Cell. 2005;123:1187–1190. doi: 10.1016/j.cell.2005.12.010. [DOI] [PubMed] [Google Scholar]
- 12.Raisner RM, et al. Histone variant H2A.Z marks the 5′ ends of both active and inactive genes in euchromatin. Cell. 2005;123:233–248. doi: 10.1016/j.cell.2005.10.002. [DOI] [PMC free article] [PubMed] [Google Scholar]
- 13.Zhang H, Roberts DN, Cairns BR. Genome-wide dynamics of Htz1, a histone H2A variant that poises repressed/basal promoters for activation through histone loss. Cell. 2005;123:219–231. doi: 10.1016/j.cell.2005.08.036. [DOI] [PMC free article] [PubMed] [Google Scholar]
- 14.Li B, et al. Preferential occupancy of histone variant H2AZ at inactive promoters influences local histone modifications and chromatin remodeling. Proc Natl Acad Sci USA. 2005;102:18385–18390. doi: 10.1073/pnas.0507975102. [DOI] [PMC free article] [PubMed] [Google Scholar]
- 15.Hild M, et al. An integrated gene annotation and transcriptional profiling approach towards the full gene content of the Drosophila genome. Genome Biol. 2003;5:R3. doi: 10.1186/gb-2003-5-1-r3. [DOI] [PMC free article] [PubMed] [Google Scholar]
- 16.Tomancak P, et al. Global analysis of patterns of gene expression during Drosophila embryogenesis. Genome Biol. 2007;8:R145. doi: 10.1186/gb-2007-8-7-r145. [DOI] [PMC free article] [PubMed] [Google Scholar]
- 17.Bruce K, et al. The replacement histone H2A.Z in a hyperacetylated form is a feature of active genes in the chicken. Nucl Acids Res. 2005;33:5633–5639. doi: 10.1093/nar/gki874. [DOI] [PMC free article] [PubMed] [Google Scholar]
- 18.Purnell BA, Emanuel PA, Gilmour DS. TFIID sequence recognition of the initiator and sequences farther downstream in Drosophila class II genes. Genes Dev. 1994;8:830–842. doi: 10.1101/gad.8.7.830. [DOI] [PubMed] [Google Scholar]
- 19.Kutach AK, Kadonaga JT. The downstream promoter element DPE appears to be as widely used as the TATA box in Drosophila core promoters. Mol Cell Biol. 2000;20:4754–4764. doi: 10.1128/mcb.20.13.4754-4764.2000. [DOI] [PMC free article] [PubMed] [Google Scholar]
- 20.Lim CY, et al. The MTE, a new core promoter element for transcription by RNA polymerase II. Genes Dev. 2004;18:1606–1617. doi: 10.1101/gad.1193404. [DOI] [PMC free article] [PubMed] [Google Scholar]
- 21.Biggin MD, Tjian R. Transcription factors that activate the Ultrabithorax promoter in developmentally staged extracts. Cell. 1988;53:699–711. doi: 10.1016/0092-8674(88)90088-8. [DOI] [PubMed] [Google Scholar]
- 22.Soeller WC, Oh CE, Kornberg TB. Isolation of cDNAs encoding the Drosophila GAGA transcription factor. Mol Cell Biol. 1993;13:7961–7970. doi: 10.1128/mcb.13.12.7961. [DOI] [PMC free article] [PubMed] [Google Scholar]
- 23.Stark A, et al. Discovery of functional elements in 12 Drosophila genomes using evolutionary signatures. Nature. 2007;450:219–232. doi: 10.1038/nature06340. [DOI] [PMC free article] [PubMed] [Google Scholar]
- 24.Ioshikhes I, Bolshoy A, Derenshteyn K, Borodovsky M, Trifonov EN. Nucleosome DNA sequence pattern revealed by multiple alignment of experimentally mapped sequences. J Mol Biol. 1996;262:129–139. doi: 10.1006/jmbi.1996.0503. [DOI] [PubMed] [Google Scholar]
- 25.Ioshikhes IP, Albert I, Zanton SJ, Pugh BF. Nucleosome positions predicted through comparative genomics. Nat Genet. 2006;38:1210–1215. doi: 10.1038/ng1878. [DOI] [PubMed] [Google Scholar]
- 26.Johnson SM, Tan FJ, McCullough HL, Riordan DP, Fire AZ. Flexibility and constraint in the nucleosome core landscape of Caenorhabditis elegans chromatin. Genome Res. 2006;16:1505–1516. doi: 10.1101/gr.5560806. [DOI] [PMC free article] [PubMed] [Google Scholar]
- 27.Kogan SB, Kato M, Kiyama R, Trifonov EN. Sequence structure of human nucleosome DNA. J Biomol Struct Dyn. 2006;24:43–48. doi: 10.1080/07391102.2006.10507097. [DOI] [PubMed] [Google Scholar]
- 28.Gilmour DS, Lis JT. RNA polymerase II interacts with the promoter region of the noninduced hsp70 gene in Drosophila melanogaster cells. Mol Cell Biol. 1986;6:3984–3989. doi: 10.1128/mcb.6.11.3984. [DOI] [PMC free article] [PubMed] [Google Scholar]
- 29.Law A, Hirayoshi K, O’Brien T, Lis JT. Direct cloning of DNA that interacts in vivo with a specific protein: application to RNA polymerase II and sites of pausing in Drosophila. Nucl Acids Res. 1998;26:919–924. doi: 10.1093/nar/26.4.919. [DOI] [PMC free article] [PubMed] [Google Scholar]
- 30.Lee C, et al. NELF and GAGA factor are linked to promoter proximal pausing at many genes in Drosophila. Mol Cell Biol. 2008;28:xxx–xxx. doi: 10.1128/MCB.02224-07. [DOI] [PMC free article] [PubMed] [Google Scholar]
- 31.Muse GW, et al. RNA polymerase is poised for activation across the genome. Nat Genet. 2007;39:1507–1511. doi: 10.1038/ng.2007.21. [DOI] [PMC free article] [PubMed] [Google Scholar]
- 32.Zeitlinger J, et al. RNA polymerase stalling at developmental control genes in the Drosophila melanogaster embryo. Nat Genet. 2007;39:1512–1516. doi: 10.1038/ng.2007.26. [DOI] [PMC free article] [PubMed] [Google Scholar]
- 33.Gnatt AL, Cramer P, Fu J, Bushnell DA, Kornberg RD. Structural basis of transcription: an RNA polymerase II elongation complex at 3.3 A resolution. Science. 2001;292:1876–1882. doi: 10.1126/science.1059495. [DOI] [PubMed] [Google Scholar]
- 34.Brown SA, Imbalzano AN, Kingston RE. Activator-dependent regulation of transcriptional pausing on nucleosomal templates. Genes Dev. 1996;10:1479–1490. doi: 10.1101/gad.10.12.1479. [DOI] [PubMed] [Google Scholar]
- 35.Brown SA, Kingston RE. Disruption of downstream chromatin directed by a transcriptional activator. Genes Dev. 1997;11:3116–3121. doi: 10.1101/gad.11.23.3116. [DOI] [PMC free article] [PubMed] [Google Scholar]
- 36.Carey M, Li B, Workman JL. RSC exploits histone acetylation to abrogate the nucleosomal block to RNA polymerase II elongation. Mol Cell. 2006;24:481–487. doi: 10.1016/j.molcel.2006.09.012. [DOI] [PMC free article] [PubMed] [Google Scholar]
- 37.Bondarenko VA, et al. Nucleosomes can form a polar barrier to transcript elongation by RNA polymerase II. Mol Cell. 2006;24:469–479. doi: 10.1016/j.molcel.2006.09.009. [DOI] [PubMed] [Google Scholar]
- 38.Renner DB, Yamaguchi Y, Wada T, Handa H, Price DH. A highly purified RNA polymerase II elongation control system. J Biol Chem. 2001;276:42601–42609. doi: 10.1074/jbc.M104967200. [DOI] [PubMed] [Google Scholar]
- 39.Wu CH, et al. NELF and DSIF cause promoter proximal pausing on the hsp70 promoter in Drosophila. Genes Dev. 2003;17:1402–1414. doi: 10.1101/gad.1091403. [DOI] [PMC free article] [PubMed] [Google Scholar]
- 40.Kornberg R. The location of nucleosomes in chromatin: specific or statistical. Nature. 1981;292:579–580. doi: 10.1038/292579a0. [DOI] [PubMed] [Google Scholar]
- 41.Kornberg RD, Stryer L. Statistical distributions of nucleosomes: nonrandom locations by a stochastic mechanism. Nucl Acids Res. 1988;16:6677–6690. doi: 10.1093/nar/16.14.6677. [DOI] [PMC free article] [PubMed] [Google Scholar]
- 42.Lehmann M. Anything else but GAGA: a nonhistone protein complex reshapes chromatin structure. Trends Genet. 2004;20:15–22. doi: 10.1016/j.tig.2003.11.005. [DOI] [PubMed] [Google Scholar]
- 43.Mito Y, Henikoff JG, Henikoff S. Histone replacement marks the boundaries of cis-regulatory domains. Science. 2007;315:1408–1411. doi: 10.1126/science.1134004. [DOI] [PubMed] [Google Scholar]
- 44.Lis JT. Imaging Drosophila gene activation and polymerase pausing in vivo. Nature. 2007;450:198–202. doi: 10.1038/nature06324. [DOI] [PubMed] [Google Scholar]
- 45.Margulies M, et al. Genome sequencing in microfabricated high-density picolitre reactors. Nature. 2005;437:376–380. doi: 10.1038/nature03959. [DOI] [PMC free article] [PubMed] [Google Scholar]
- 46.Eisen MB, Spellman PT, Brown PO, Botstein D. Cluster analysis and display of genome-wide expression patterns. Proc Natl Acad Sci U S A. 1998;95:14863–14868. doi: 10.1073/pnas.95.25.14863. [DOI] [PMC free article] [PubMed] [Google Scholar]
Associated Data
This section collects any data citations, data availability statements, or supplementary materials included in this article.
Supplementary Materials
MethodsFigsTab
Full Methods and any associated references are available in the online version of the paper at www.nature.com/nature.
Supplementary Information is linked to the online version of the paper at www.nature.com/nature.