The first five years of single-cell cancer genomics and beyond (original) (raw)
Abstract
Single-cell sequencing (SCS) is a powerful new tool for investigating evolution and diversity in cancer and understanding the role of rare cells in tumor progression. These methods have begun to unravel key questions in cancer biology that have been difficult to address with bulk tumor measurements. Over the past five years, there has been extraordinary progress in technological developments and research applications, but these efforts represent only the tip of the iceberg. In the coming years, SCS will greatly improve our understanding of invasion, metastasis, and therapy resistance during cancer progression. These tools will also have direct translational applications in the clinic, in areas such as early detection, noninvasive monitoring, and guiding targeted therapy. In this perspective, I discuss the progress that has been made and the myriad of unexplored applications that still lie ahead in cancer research and medicine.
A single cell is the ultimate denomination of a multicellular organism. The human body is composed of approximately 37.2 trillion cells that live harmoniously among their neighbors (Bianconi et al. 2013). However, in cancer, a single cell can lead to the downfall of an entire organism. As a single cell begins its journey to evolve into a malignant mass of tumor cells, the lineages diverge and form distinct subpopulations resulting in intratumor heterogeneity. Clonal diversity is a salient feature of many human tumors (Navin et al. 2010; Gerlinger et al. 2012; Shah et al. 2012) and provides fuel for evolution to select upon. A tumor is analogous to an ecosystem, and many principles from ecology and population genetics can help us understand how tumor cell populations respond to selective pressures (Merlo et al. 2006; Greaves and Maley 2012). Clonal diversity is likely to play an important role in invasion, metastasis, and the evolution of resistance to therapy (Navin 2014a). However, to date, our understanding of intratumor heterogeneity in the context of tumorigenesis has been poor—at best. The central problem inhibiting these studies is technical: Most genomic methods require micrograms of input material and thus are limited to reporting an average signal from a complex population of cells. To address this problem, single-cell sequencing (SCS) methods were developed and have revolutionized our understanding of cancer evolution and diversity. Additionally, these methods can provide insight into the role of rare cells to understand their role in tumor progression. Over the past five years, there has been extraordinary progress in the development and application of single-cell DNA and RNA sequencing methods for cancer research (Fig. 1). However, many technical challenges and unexplored applications still lie ahead and serve as the basis of this perspective article (cf. Fig. 2).
Figure 1.
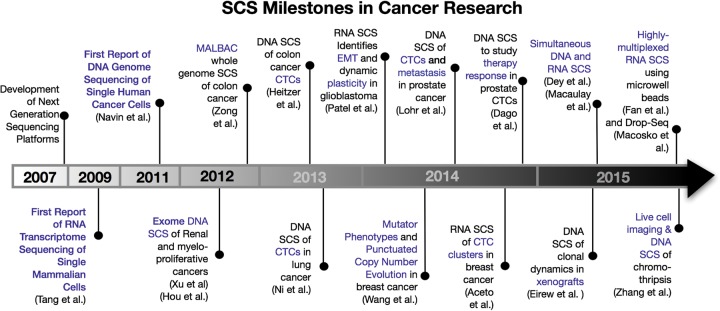
Timeline of single-cell sequencing milestones in cancer research. This timeline depicts the major discoveries that have occurred in the cancer field of single-cell sequencing and related technology developments.
Figure 2.
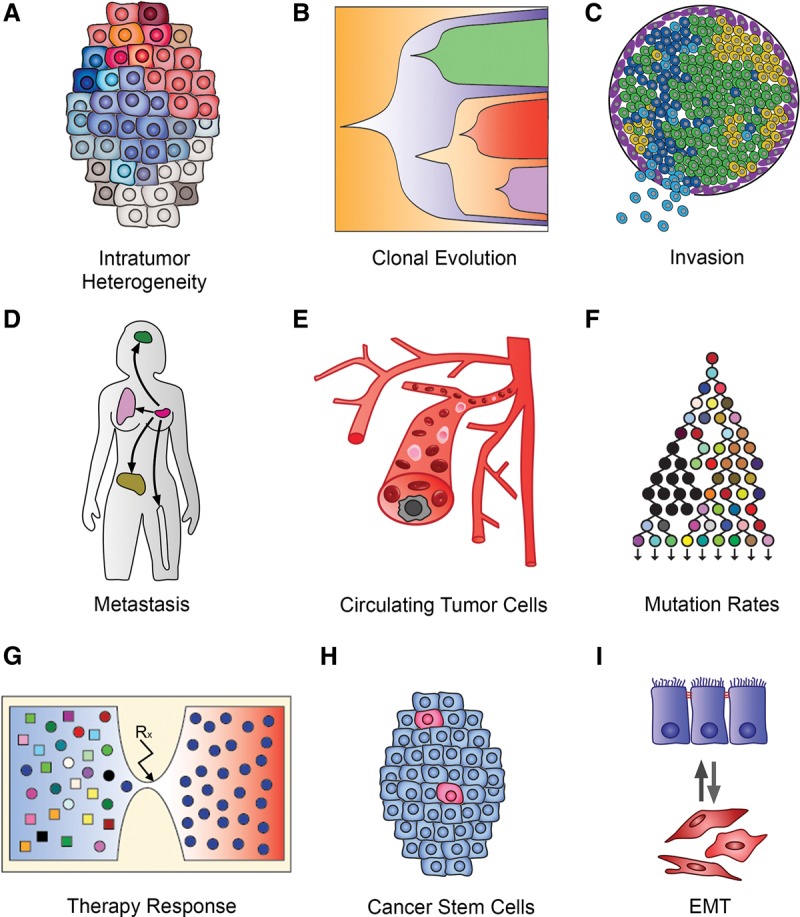
Applications of single-cell sequencing in cancer research. This figure displays the myriad of applications that single-cell sequencing methods have in cancer research: (A) resolving intratumor heterogeneity; (B) investigating clonal evolution in primary tumors; (C) studying invasion in early stage cancers; (D) tracing metastatic dissemination; (E) genomic profiling of circulating tumor cells; (F) investigating mutation rates and mutator phenotypes; (G) understanding resistance evolution to therapy; (H) understanding cancer stem cells and cell hierarchies; and (I) studying cell plasticity and epithelial-to-mesenchymal transition.
The development of single-cell sequencing methods
A typical cancer cell contains ∼6–12 pg of DNA and 10–50 pg of total RNA (1%–5% mRNA), depending on the ploidy and the cell type (Livesey 2003). Therefore, the first step in any SCS experiment involves whole-genome amplification (WGA) or whole-transcriptome amplification (WTA) to obtain sufficient input material for constructing next-generation sequencing (NGS) libraries. During the amplification process, a number of technical errors may arise: allelic dropout events (one allele is not amplified), amplification distortion (transcripts are over/under amplified), false-positive (FP) errors (infidelity of the polymerase), and coverage nonuniformity (uneven amplification) (Navin 2014a; Zhang et al. 2015a). The first DNA SCS method developed, single-nucleus sequencing (SNS), combined flow-sorting by DNA ploidy, degenerative-oligonucleotide-PCR (DOP-PCR), and next-generation sequencing to measure genome-wide copy number profiles of single cells using sequence read depth (Navin et al. 2011; Baslan et al. 2012). This method achieved ∼10% physical coverage of a single-cell genome, which was sufficient for measuring copy number aberrations, but inadequate for detecting mutations at base-pair resolution. To improve physical coverage, several single-cell DNA sequencing methods were subsequently developed (BGI, nuc-seq, SNES) that utilize the Phi29 enzyme to perform multiple-displacement amplification (MDA) (Hou et al. 2012; Xu et al. 2012; Lohr et al. 2014; Wang et al. 2014; Leung et al. 2015). These methods can now achieve >90% coverage of a single-cell genome, allowing mutations to be detected at base-pair resolution. nuc-seq and SNES take advantage of G2/M single cells that have duplicated their genome prior to WGA, providing four copies of the genome as input material and thereby reducing technical error rates (Wang et al. 2014; Leung et al. 2015). An alternative method uses a combination of MDA and adapter-ligation PCR called multiple annealing looping-based amplification cycles (MALBAC) which improves physical coverage, but at the cost of higher FP error rates due to the Bst polymerase, which does not have proofreading activity (Zong et al. 2012).
To profile RNA transcriptomes in single cells, initial methods used oligo-dT primers followed by ligation adapter PCR (Tang et al. 2009) or linear transcription with T7 (Hashimshony et al. 2012). These methods were challenged by strong 3′ bias due to the inefficiency of first-strand cDNA synthesis by reverse transcriptase. To address this problem, a method that has template switching activity was developed, called Smart-seq, using an MMLV reverse transcriptase (Ramsköld et al. 2012; Picelli et al. 2014). Further developments incorporated unique molecular identifiers (UMIs) to label each RNA molecule with unique barcodes prior to WTA amplification, thereby reducing amplification bias (Islam et al. 2014). Although progress in the development of single-cell DNA and RNA sequencing methods has been rapid, the development of single-cell epigenomic profiling methods has proven to be more challenging. Nevertheless, a few studies have forged ahead and made some initial progress despite many technical errors (Guo et al. 2013; Nagano et al. 2013). Detailed technical discussion of single-cell DNA and RNA sequencing methods is provided in other works (for review, see de Bourcy et al. 2014; Navin 2014a; Van Loo and Voet 2014; Wu et al. 2014; Wang and Navin 2015).
Clonal diversity and evolution in primary tumors
Most SCS research studies to date have focused on investigating intratumor heterogeneity and clonal evolution in primary tumors (Table 1). SCS provides a powerful approach for resolving clonal substructure and reconstructing phylogenetic lineages to understand the genetic relationship between individual tumor cells. Although intratumor heterogeneity presents a major challenge for clinical diagnostic sampling and targeted therapy, it also provides a unique opportunity to reconstruct tumor evolution by assuming that mutational complexity increases with time.
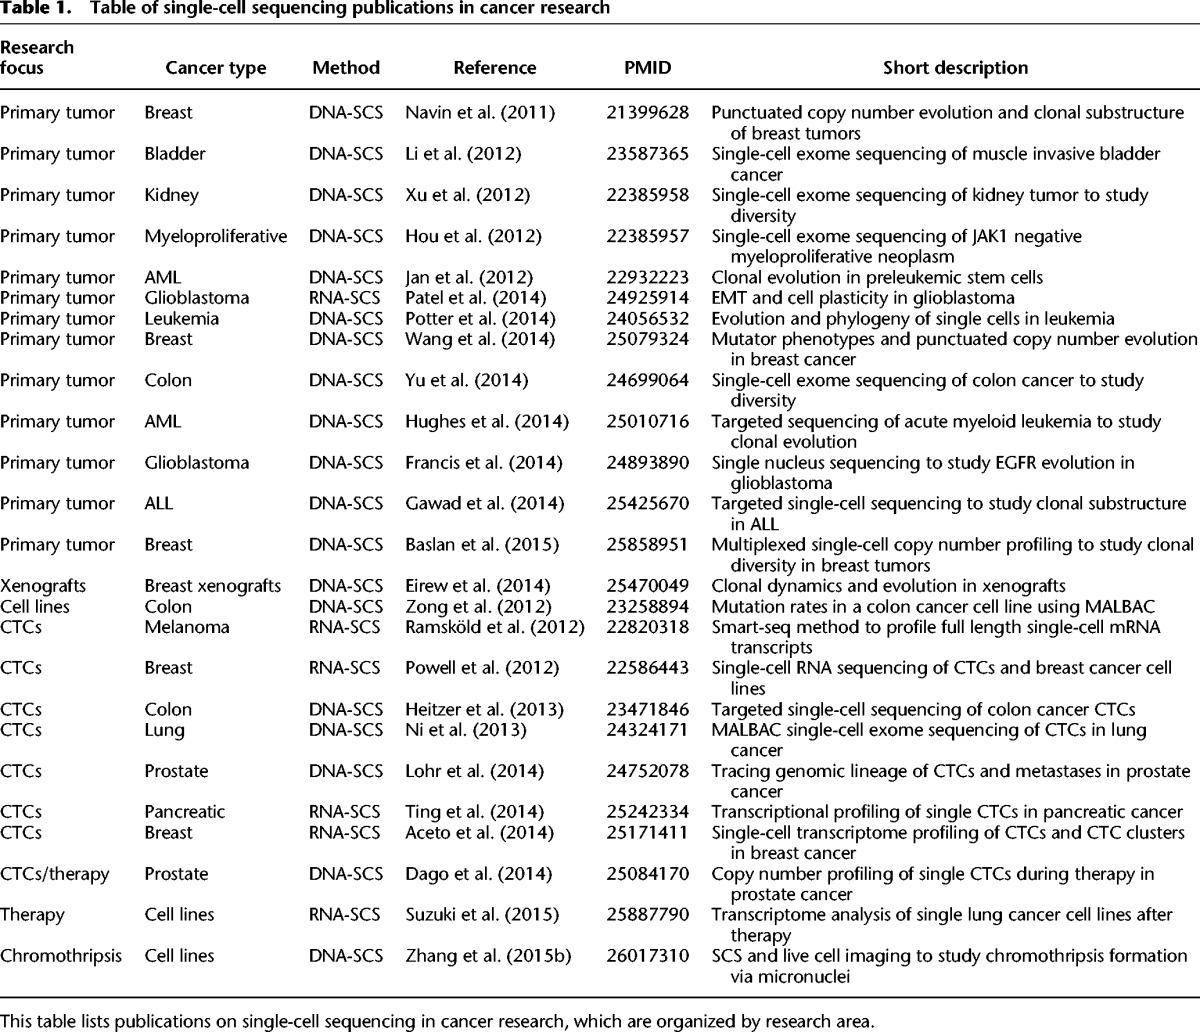
Table 1.
Table of single-cell sequencing publications in cancer research
In the first SCS study of clonal evolution in a human tumor, SNS was used to profile genomic copy number in hundreds of single tumor cells from two breast cancer patients, which revealed a punctuated model of copy number evolution (Navin et al. 2011). In a subsequent study, single-cell copy number profiles were compared directly to single-cell exome data in two breast cancer patients, which showed that copy number evolution occurred early, in punctuated bursts, whereas point mutations evolved gradually over time, leading to extensive clonal diversity in the tumor mass (Wang et al. 2014). In this study, SCS also identified a large number of rare subclonal (<1%) mutations that may play an important role in tumor evolution and therapy resistance.
Another group applied single-cell exome sequencing to study clonal diversity in a JAK2 myeloproliferative disease (Hou et al. 2012) and a kidney tumor (Xu et al. 2012). These data showed that single cells share common founder mutations, suggesting evolution from a common origin, but had difficulty in resolving clonal substructure and genetic lineages due to high error rates. However, in subsequent studies, the same group applied single-cell exome sequencing to study clonal substructure in a muscle-invasive bladder cancer (Li et al. 2012) and a colon cancer (Yu et al. 2014), which revealed two major subpopulations in each tumor that diverged but shared a common genetic lineage. Another group applied DNA SCS to delineate clonal diversity in glioblastoma, which revealed convergent evolution of EGFR mutations and rearrangements in different subclones from the same primary tumors (Francis et al. 2014).
DNA-SCS has also been applied to study hematological malignancies. In AML, DNA-SCS was used to reconstruct the order of mutations in three patients diagnosed with MDS-derived secondary AML to reconstruct mutational chronology (Hughes et al. 2014). In another study, an innovative approach was developed to study childhood acute lymphoblastic leukemia (ALL), in which the authors first performed deep-exome sequencing to identify mutations in the bulk DNA and then designed custom PCR primers for multiplexed targeted sequencing of 1479 single cells from six patients (Gawad et al. 2014). These studies identified early ETV6-RUNX1 translocations followed by multiclonal evolution in childhood AML patients.
Collectively, these initial studies provide strong evidence for clonal evolution (Campbell and Polyak 2007; Navin and Hicks 2010; Greaves and Maley 2012) in many primary tumors and hematological malignancies. These data challenge the strict cancer stem cell model (Clarke and Becker 2006; Shipitsin and Polyak 2008; Tomasson 2009) by showing that the majority of tumor cells have continued lineages and are capable of continued proliferation and clonal expansion. Furthermore, the phylogenetic trees from these studies show strong evidence of a common set of founder mutations in every cancer patient, suggesting that most solid tumors evolve from a single somatic cell in the normal tissue. These data argue strongly against mutagenic field effects and multicell origins, which would have resulted in independent genetic lineages that do not share any common founder mutations.
Circulating tumor cells and metastatic dissemination
Several models of metastasis have been proposed (late dissemination, early seeding, and self-seeding) but remain difficult to resolve in most human cancers. The challenges lie both in the technical hurdle of resolving intratumor heterogeneity and in the difficulty in measuring genomic information in the key intermediates: circulating tumor cells (CTCs). The problem is that CTCs are extremely rare in the blood (1 in 106), and generally only 1–50 cells can be isolated from a typical 7.5-mL blood draw, providing limited input material for genomic studies.
Initial CTC studies focused mainly on measuring DNA mutations in CTCs and comparing them to matched primary and metastatic tumors. In one study, DNA-SCS was used to analyze CTCs from six patients with metastatic colon cancer, which showed that a large proportion of the point mutations in the primary tumor could be detected in the CTCs by targeted gene sequencing (Heitzer et al. 2013). In another study, MALBAC was used to perform exome sequencing and copy number profiling of single CTCs from seven metastatic lung adenocarcinoma cancer patients, which showed that a substantial number of point mutations (59%) in the primary and metastatic tumors were detected in the CTCs (Ni et al. 2013). This study also showed that although the copy number profiles of single CTCs were highly stable in the blood and similar to the primary and metastatic tumors, point mutations displayed extensive variability. Another study in metastatic melanoma patients applied SNS to profile copy number in single CTCs, which also reported highly similar copy number profiles (Ruiz et al. 2015). Morphometric imaging was also combined with SNS to investigate copy number evolution in metastatic prostate cancer in response to abiraterone therapy (Dago et al. 2014), which identified convergent evolution of the androgen receptor (AR) amplification in different single tumor cells. Another group applied single-cell exome sequencing to profile CTCs and matched exome sequencing of primary and metastatic prostate tumors from the same patients (Lohr et al. 2014). This study revealed a direct genetic lineage of the CTCs to a minor clonal subpopulation in a distinct spatial region of the primary prostate tumor and showed that 51% of the mutations in the primary and metastatic tumors could be detected in the CTC populations.
RNA-SCS has also been applied to study the transcriptional programs of CTCs. In melanoma patients, RNA-SCS identified three distinct gene signatures in CTCs associated with metastasis (Ramsköld et al. 2012). In another study, RNA-SCS was used to study the dissemination of single CTCs and CTC clusters in metastatic breast cancer patients and mouse models (Aceto et al. 2014). These data identified plakoglobin as a key regulator of CTC clusters and showed that CTC clusters have increased metastatic potential relative to individual CTCs. In another study, RNA-SCS was applied to study metastasis in pancreatic cancer and reported that CTCs express their own extracellular matrix proteins in the blood (Ting et al. 2014). Collectively, these studies have greatly improved our fundamental understanding of CTCs, their transcriptional programs and their genetic relationship to the primary and metastatic tumors.
Delineating complex chromosome rearrangements in single cells
During tumor evolution, chromosomes acquire complex numerical and structural rearrangements leading to gene dosage effects in oncogenes and tumor suppressors. Although aneuploid rearrangements are a hallmark of many human cancers (Hanahan and Weinberg 2011), most genomic studies represent endpoint analyses; and thus, there is little known about the dynamics and mechanics (how and when) of chromosome evolution during tumor progression. DNA-SCS provides a novel approach to measure copy number aberrations (CNAs) during tumor progression by comparing multiple single cells that represent different time points in evolution. Two studies in breast cancer investigated the evolutionary dynamics of CNAs in single cells using SNS (Navin et al. 2011; Wang et al. 2014). In both studies, the data show that complex aneuploid copy number changes were acquired early in tumor evolution, in punctuated bursts, followed by stable clonal expansions to form the tumor mass. This punctuated model of copy number evolution challenges the paradigm that CNAs are acquired gradually and sequentially over time (Fearon and Vogelstein 1990; Höglund et al. 2002), leading to successively more malignant stages of cancer. However, more work will be needed to determine if punctuated copy number evolution is common in many solid cancer types, or alternatively a phenomenon that is restricted to breast cancer patients. Other studies have identified another punctuated model of chromosome evolution called “chromothripsis” that refers to complex oscillating copy number aberrations that are restricted to single chromosomes or chromosome arms (Stephens et al. 2011). Until recently, the evidence for a punctuated model of chromothripsis has been indirect; however, a recent study combined live cell imaging of single cancer cells in vitro with DNA-SCS to show direct evidence of chromothripsis via micronuclei formation (Zhang et al. 2015b). Future work along these lines can provide insight into how other complex aneuploid rearrangements are acquired over time, including “firestorms,” “sawtooth” patterns (Hicks et al. 2006), and “chromoplexy” (Baca et al. 2013).
Evolution of therapy resistance
Although many cancers show initial response to chemotherapy or targeted agents, most tumors eventually evolve resistance, often resulting in no further treatment options. The process by which tumors evolve chemoresistance remains poorly understood in most human cancers. Key questions remain on whether resistant clones are rare subpopulations that are preexisting in the tumor mass and selected after therapy (adaptive resistance), or alternatively, whether the therapeutic agents induce the generation of new mutations that confer a resistant phenotype (acquired resistance). Another question is whether intratumor heterogeneity itself plays an important role in resistance evolution (Navin 2014b). Likewise, the role of epithelial-to-mesenchymal transition (EMT) and cell plasticity in conferring a resistance phenotype is just beginning to be understood, as recent studies show evidence that tumor cells may switch to a mesenchymal phenotype in response to chemotherapy (Almendro et al. 2014). SCS methods hold great potential for improving our understanding of resistance evolution in response to therapy.
One of the first SCS-DNA studies to investigate genome evolution in response to therapy applied SNS to study copy number diversity in CTCs over four time points from metastatic prostate cancer patients treated with chemotherapy and Aberaterone (Dago et al. 2014). These data identified the emergence and selection of a preexisting minor subclonal population that was present in the first blood sample and showed androgen receptor amplification, supporting the adaptive model of therapy resistance evolution. In another study, RNA-SCS was used to study the transcriptomes of 336 single cells in lung adenocarcinoma cell lines in response to multi-tyrosine kinase inhibitors, which identified several signaling pathways associated with resistance (Suzuki et al. 2015).
Plasticity and cancer stem cells
Cancer stem cells (CSC) are hypothesized to be rare (<1%) stem cell-like progenitor cells that have unlimited replicative potential and give rise to the major tumor cell populations (Shipitsin and Polyak 2008). CSCs are posited to be resistant to therapeutic agents and may reconstitute the tumor mass after therapy (Polyak and Weinberg 2009). Although the evidence for CSCs in blood cancers is overwhelming (due to the hierarchical nature of blood cell lineages), the evidence for CSC in most solid tumors remains controversial (Polyak 2007; Adams and Strasser 2008; Tomasson 2009). The problem is that CSCs are very rare (<1%) subpopulations in most tumors and therefore difficult to study with genomic methods. To date, there are no SCS studies that have directly compared CSC to differentiated populations in the same tumors. However, a recent study performed unbiased RNA-SCS to profile the transcriptomes in hundreds of single tumor cells from five glioblastoma patients (Patel et al. 2014). Unexpectedly, this data showed that individual cancer cells displayed a large range of intermediate phenotypes that do not fall into distinct classes of epithelial or mesenchymal subpopulations as proposed by the classical EMT models (Kalluri and Weinberg 2009). Furthermore, although four distinct gene expression classes were previously reported in glioblastoma (Verhaak et al. 2010), these studies showed that single cells in the same glioblastoma tumor can exhibit multiple expression subtypes.
Mutator phenotypes
The “mutator phenotype” posits that human cancers are driven by increased _mutation rates_—an elevated number of mutations per cell division, relative to normal cells (Loeb et al. 1974; Bielas and Loeb 2005; Loeb 2011). However, measuring mutation rates in human tumors is challenging due to the fact that it is difficult to know the precise number of cell divisions that occurred during tumor growth. Although large-scale sequencing studies (Alexandrov et al. 2013; Kandoth et al. 2013) often report increased mutation frequencies (total number of mutations), it remains unclear whether these mutations accumulated at a low mutation rate over many cell divisions or, alternatively, at a very high mutation rate in a few cell divisions. Previous studies using bulk sequencing methods have estimated that the mutation rate across many human cancers is on average 210-fold higher than normal cells (Bielas and Loeb 2005; Bielas et al. 2006). However, SCS methods can potentially provide more accurate measures of mutation rates by comparing mutation frequencies between single tumor cells. In one study, MALBAC was applied to investigate the mutation rate of a human colon cancer cell line (Zong et al. 2012), which reported a mutation rate of 2.5 nucleotide errors per cell division, which is only marginally higher than the normal error rate of cell division. In another study, nuc-seq was applied to investigate mutation rates in human breast tumors (Wang et al. 2014), which estimated the mutation rate in triple-negative breast cancer to be 13.3× (eight mutations per cell division), whereas an ER+ tumor showed mutation rate that was similar to normal cells. The mutation rates estimated from SCS data are substantially lower than previous estimates reported in bulk tissue samples (Bielas and Loeb 2005; Bielas et al. 2006) but do show evidence for a modest increase in the mutation rate in human tumors. However, these initial studies were limited to only a few patients, and future work will be needed in which SCS is applied to a larger number of patients to understand the range of mutation rates across many human cancers.
SCS in animal models
Animal models for cancer research, including genetically engineered mice (GEM) and xenografts, provide an unlimited source of genetic material and allow serial collection of samples over time, which are difficult to obtain from human patients. Xenografts are ideal systems for studying intratumor heterogeneity because they preserve the clonal diversity that was present in the original patient's tumors. In a recent study, DNA-SCS was performed in mouse xenografts from triple-negative breast cancer (TNBC) patients to study clonal dynamics and selection during the first few passages of the tumors to other recipient mice (Eirew et al. 2014). In these studies, targeted DNA-SCS was used to resolve the clonal architecture of the tumor after each successive passage, which showed strong selection of tumor clones and mutations in the first few passages in response to the new mouse stromal environment. In another study, RNA-SCS was applied to study CTCs and metastasis in mouse xenografts established from pancreatic cancer patients (Ting et al. 2014) and breast cancer patients (Aceto et al. 2014). Although CTCs are difficult to isolate from human blood, mouse xenografts have the advantage of providing a much larger number of CTCs and are easy to isolate using fluorescent markers. In summary, combining SCS methods with GEMs and xenografts provides a powerful experimental system for studying clonal dynamics, metastasis, and potentially also therapeutic response.
Translational applications of SCS in the clinic
Single-cell DNA and RNA sequencing methods have a myriad of translational applications, including diagnostics, prognostics, targeted therapy, early detection, and noninvasive monitoring. In diagnostics, intratumor heterogeneity presents a formidable challenge for clinical sampling, because single samples may not accurately represent the tumor as a whole. SCS methods can resolve intratumor heterogeneity and provide accurate measures of genomic diversity, which can be used to calculate a “diversity index.” These indexes are likely to have prognostic utility in predicting which cancer patients will be more likely to show poor response to therapy, higher probability of metastasis, or have poor overall survival (Burrell et al. 2013; Murugaesu et al. 2013; Almendro et al. 2014).
Another important clinical application of SCS methods is to guide targeted therapy. By sequencing and comparing multiple single cells, it is possible to construct a phylogenetic tree and heatmap that reveals the clonal substructure of a tumor. These genetic trees will allow oncologists to identify founder mutations in the “trunk” of the tree, which are ideal therapeutic targets, since they occurred early in tumor evolution and were inherited by all cells in the tumor. Alternatively, these trees can be used to devise combination therapies to target multiple tumor subpopulations independently.
Early detection is another clinical application of SCS, which can provide genomic information on rare tumor cells. In samples collected from bodily fluids (blood, urine, feces, and phlegm), it may be possible to isolate single cancer cells at the earliest stages of cancer progression. If driver mutations can be identified in multiple single cancer cells, then they may represent a clonal expansion, which could be followed by imaging techniques and surgical resection of microlesions. Another important clinical application of SCS is for obtaining genomic data sets from scarce clinical samples, which often contain only hundreds of tumor cells and are frequently unable to undergo genetic tests due to Quantity Not Sufficient (QNS).
Perhaps the most immediate application of SCS in the clinic will be in noninvasive monitoring. By isolating and sequencing single CTCs in the blood, it may be possible to measure somatic mutations that are present at the primary or metastatic tumor sites without the inherent risks that are associated with performing an invasive core biopsy directly at the organ site. Additionally, this noninvasive approach can allow the oncologist to collect serial samples over time during the course of therapy to monitor response and the emergence of resistant clones. Indeed, several initial studies have been encouraging by showing that >50% of the mutations in the primary and metastatic tumors can be detected in CTCs from lung cancer (Ni et al. 2013), prostate cancer (Lohr et al. 2014), and colon cancer patients (Heitzer et al. 2013). In summary, SCS technologies are ready to make big strides into the clinic over the next five years.
Alternative methods to SCS
SCS is not always the best experimental approach to address every question in cancer biology. A notable limitation of SCS is that only a small number of cells can be sampled and analyzed at a reasonable cost (see Box 1: “How many single cells to sequence?”). This may lead to sampling bias and makes it difficult to detect rare cells in a population without first isolating and enriching the cells of interest. In many studies, the sampling of even 10 or 100 cells can greatly reduce technical errors and sampling bias when single-cell information is not needed. Alternatively, methods such as multiregion sequencing (Gerlinger et al. 2012; Zhang et al. 2014) and ultra-deep sequencing methods (Nik-Zainal et al. 2012; Shah et al. 2012) can also provide information on intratumor heterogeneity and clonal evolution.
Multiregion sequencing is a straightforward approach that can be used to sample multiple spatial regions within a tumor to resolve intratumor heterogeneity. However, an important limitation is that it requires that clones are spatially segregated in the tumor mass and thus cannot resolve intermixed subpopulations. Deep sequencing is another alternative approach, in which tumor genomes are sequenced at very high coverage depths, and mutation frequencies are clustered to identify subpopulations. Although straightforward, these methods are often confounded by copy number aberrations, which if not normalized accurately can lead to the overestimation of false subpopulations. In short, these approaches are more cost efficient and can mitigate sampling bias, but cannot resolve the combination of mutations in any given tumor cell.
Another alternative approach involves subcloning single cells to establish isogenic cell lines or organoid cultures. Isogenic cell lines or organoids can serve as proxies for single cells (Sachs and Clevers 2014; Boj et al. 2015) and provide an unlimited source of genetic material. Furthermore, they allow functional studies to be performed and cell phenotypes to be measured, enabling connections to be drawn between genotypes and phenotypes. However, a notable limitation is that to establish isogenic cell lines, live cells are required, and many cells are unable to expand in culture, which may superficially select for cells that are good at surviving in culture.
Furthermore, the 2D or 3D microenvironment of cultures may not accurately reflect the tumor microenvironment, which can alter the transcriptional programs. Therefore, it is important to orthogonally validate findings that are derived from these systems in the original tumor samples to establish physiological relevance.
Future applications in cancer research
Over the past five years, most SCS studies have focused mainly on delineating clonal evolution and diversity in primary tumors (Navin et al. 2011; Hou et al. 2012; Li et al. 2012; Xu et al. 2012; Francis et al. 2014; Wang et al. 2014; Yu et al. 2014). However, the field has begun to shift toward studies on CTCs and understanding their role in metastatic dissemination (Heitzer et al. 2013; Ni et al. 2013; Lohr et al. 2014). These experiments are likely to provide new insight into the general models of metastasis in different human cancers. A few studies have also begun to investigate clonal evolution in the context of therapy (Dago et al. 2014; Suzuki et al. 2015), which will undoubtedly become a major area of SCS cancer research in the coming years. These studies will begin to address fundamental questions regarding adaptive versus acquired resistance when tumors are challenged by different therapeutic agents. SCS methods will also have important future applications for understanding genome evolution in early stage cancers, such as ductal carcinoma in situ (DCIS) and prostatic intraepithelial neoplasia (PIN), to identify the rare clones that escape their ducts and invade the surrounding tissues. Future SCS studies are also expected to provide insight into our understanding of cell plasticity and CSCs, by revealing their genetic and transcriptomic relationship to the differentiated tumor cell populations (Stingl and Caldas 2007; Shipitsin and Polyak 2008; Tomasson 2009). SCS methods will also have important applications for understanding intratumor heterogeneity in the context of immunotherapy to understand if tumors with increased genomic diversity will also be more immunogenic and therefore more susceptible to the new arsenal of immunotherapy agents and checkpoint inhibitors (Pardoll 2012).
Technical challenges and emerging technologies
Although much progress has been made, a number of technical challenges still lie ahead before SCS methods can be widely adopted by the cancer research and clinical communities. Achieving high physical coverage (>90%) in a single cell has largely been achieved (Hou et al. 2012; Zong et al. 2012; Wang et al. 2014), but current methods need to improve coverage uniformity and mitigate the technical error rates. Cost and throughput of SCS experiments are also major barriers in the field. To address these issues, several studies have begun to develop multiplexing strategies for SCS experiments. A recent method, called C-DOP-P, uses 96 barcodes to improve multiplexing of SNS and increase the throughput for single-cell copy number profiling (Baslan et al. 2015). Commercial microfluidic approaches such as the Fluidigm C1 system have also been developed for analyzing 96 single-cell RNA profiles in parallel using nanoliter reaction volumes. Another innovative method uses tens of thousands of microwells and beads with cell-specific barcodes that can potentially perform single-cell RNA sequencing on 10,000 or more cells (Fan et al. 2015). Perhaps the most promising new method for multiplexing is Drop-seq, which uses nanoliter droplets and barcoded beads to capture single cells and perform WTA, enabling RNA-SCS on 10,000–100,000 cells in a single run (Macosko et al. 2015). Similar approaches will need to be developed for single-cell DNA sequencing; however, this will be more of a challenge due to the absence of a polyA tail for hybridization to oligonucleotides on beads with cell identifiers. With these new technologies and the falling cost of next-generation sequencing methods, I expect that sequencing thousands of single cells in parallel will become routine in the near future. This will necessitate the development of new computational tools for analyzing large-scale SCS data sets, which are currently severely lacking. The problem is that single-cell DNA and RNA sequencing data sets have unique characteristics and technical errors that violate the assumptions of standard variant detection and expression analysis algorithms that were designed for bulk NGS data (Stegle et al. 2015; Wang and Navin 2015).
In the future, it will be important to begin connecting genotypic information with phenotypic information in single cells. This can be accomplished by connecting live-cell imaging techniques (Sabouri-Ghomi et al. 2008) or intravital imaging in mice (Alexander et al. 2013) with SCS methods to measure phenotypic properties in single cancer cells prior to isolation and genomic analysis. Another important direction involves connecting in situ spatial information of single cancer cells in tissue sections to their genomic and transcriptomic profiles (Crosetto et al. 2015). This can be accomplished by isolating single cells from tissue sections using LCM, or alternatively by sequencing single cells directly in tissue sections using novel single-cell RNA sequencing methods (Lee et al. 2014; Lovatt et al. 2014). Another important area of technology development is to develop methods that can measure multiple layers of molecular information from the same single cells (e.g., DNA and RNA). Two recent studies demonstrated this technical feat by measuring both DNA copy number information and RNA expression from the same single cells (Dey et al. 2015; Macaulay et al. 2015), but further work will be needed to measure DNA mutations at base-pair resolution in parallel with RNA transcripts. Furthermore, the development of single-cell epigenomic methods has lagged far behind, but it is urgently needed for understanding cell plasticity and epigenomic reprogramming in tumors.
Another technical challenge that needs to be addressed is sample preparation for single-cell sequencing experiments. Generally, tumors are embedded in FFPE or flash frozen directly after surgery or biopsies are taken. This presents a technical challenge for analysis, since most single-cell sequencing methods require suspensions of cells for isolation, which must be prepared directly from fresh tissue samples. Unfortunately few, if any, samples have been prepared this way and stored in freezing media. To circumvent this problem, several studies have shown that nuclear suspensions can be prepared from archival frozen tissue samples (Navin et al. 2011; Baslan et al. 2012) and used for DNA-SCS experiments. This is possible because the cytoplasmic membrane becomes ruptured during freezing, but the nuclear membrane remains intact through many freeze–thaw cycles. Sample preparation is particularly critical for single-cell RNA sequencing experiments, in which transcriptional programs can be skewed if the cells are not isolated and lysed quickly after the tissue is dissociated (Islam et al. 2014). In summary, new sample collection protocols will need to be put into place in hospitals in order to prepare single-cell suspensions directly after fresh tissue is collected by surgery.
Conclusions and future directions
In the first five years since its inception, SCS has already revolutionized our understanding of cancer evolution and diversity. Although initial studies focused mainly on technology development and intratumor heterogeneity in primary tumors, the field has now shifted toward understanding more complex biological processes in cancer, including invasion, metastasis, and the evolution of therapy resistance. These tools have also begun to provide new insight into the role of rare cells in tumor progression, particularly in the context of metastatic dissemination. Future studies will begin to unravel the spatial organization of tumor clones in tissues and will connect phenotypic behaviors of cancer cells with their genotypes. This will require combining SCS with multiple experimental systems, including xenografts, GEMs, cell cultures, and organoid systems. As DNA- and RNA-SCS methods continue to mature, their translation into the clinic is inevitable and will have a major impact on patient lives.
Box 1.
How many single cells to sequence?
Most SCS studies to date have analyzed an arbitrary number of cells, ranging from about 50–100 cells from each patient, a number that is mainly dictated by cost. The difficulty in estimating sample sizes (N) for SCS experiments is that these calculations rely on several important factors that are often difficult to measure, including (1) the diversity of the underlying population; (2) the sensitivity required for detecting rare clones (e.g., 1%); and (3) the technical variability of the SCS method. The statistical methods for estimating sample numbers from SCS experiments can be broadly classified into two categories: (1) retrospective estimations; and (2) prospective estimations. Retrospective methods involve back-calculations, in which an arbitrary number of single cells are sequenced (DNA or RNA) in a series of tumors, and a cumulative number of new mutations or transcripts are plotted as a function of the cumulative number of single cells, resulting in a saturation curve. This calculation is analogous to rarefaction calculations in ecology, which are derived from species capture–recapture experiments. In these plots, the cumulative number of species versus the cumulative number of samples are plotted in random order to determine the point at which the number of species detected reaches a plateau in the curve (Gotelli and Colwell 2001). Statistical methods for prospective calculations are more challenging to estimate; however, they do not require empirical data sets. A simple power calculation can be formalized as
where s is equivalent to the subclonal frequency, and n is equal to the number of single cells that need to be sequenced. Based on this equation, the detection of a 10% subclone would require sequencing at least n = 25 single cells to achieve a 0.9 detection power, whereas a 1.0 detection power would require n = 50 single cells. Similarly, n = 250 single cells are require to detect a 1% subclone with 0.9 detection power, and n = 500 single cells are required for 1.0 power. However, this calculation does not incorporate the number of replicate cells needed to mitigate false positive (FP) and false negative (FN) error rates and eliminate random errors, which may range from r = 2–5 replicate cells depending on the SCS technology (N * r). More sophisticated sample number estimations can be calculated using probabilistic methods from population genetics that were originally developed for discovering rare disease variants based on expected minor allele frequencies (MAFs) in the human population (Wendl and Wilson 2009). In summary, a number of statistical methods from ecology and population genetics are useful for estimating the sample sizes required for SCS experiments and should be considered before starting any single-cell sequencing study.
Acknowledgments
N.E.N. is a Nadia's Gift Foundation Damon Runyon-Rachleff Innovator (DRR-25-13) and is supported by the Lefkofsky Family Foundation. N.E.N. is a T.C. Hsu Faculty Scholar. This work was supported by grants to N.E.N. from NCI (NIH) (1RO1CA169244-01). This work was also supported by the Moonshot Knowledge Gap Award, Center for Genetics & Genomics, and Center for Epigenetics at the MD Anderson Cancer Center, and an Agilent University Relations Grant. I thank Anna Unruh for help in preparing the figure images, Yong Wang for preparing the table, and Alex Davis for useful discussions.
Footnotes
Freely available online through the Genome Research Open Access option.
References
- Aceto N, Bardia A, Miyamoto DT, Donaldson MC, Wittner BS, Spencer JA, Yu M, Pely A, Engstrom A, Zhu H, et al. 2014. Circulating tumor cell clusters are oligoclonal precursors of breast cancer metastasis. Cell 158: 1110–1122. [DOI] [PMC free article] [PubMed] [Google Scholar]
- Adams JM, Strasser A. 2008. Is tumor growth sustained by rare cancer stem cells or dominant clones? Cancer Res 68: 4018–4021. [DOI] [PubMed] [Google Scholar]
- Alexander S, Weigelin B, Winkler F, Friedl P. 2013. Preclinical intravital microscopy of the tumour-stroma interface: invasion, metastasis, and therapy response. Curr Opin Cell Biol 25: 659–671. [DOI] [PubMed] [Google Scholar]
- Alexandrov LB, Nik-Zainal S, Wedge DC, Aparicio SA, Behjati S, Biankin AV, Bignell GR, Bolli N, Borg A, Børresen-Dale AL, et al. 2013. Signatures of mutational processes in human cancer. Nature 500: 415–421. [DOI] [PMC free article] [PubMed] [Google Scholar]
- Almendro V, Cheng YK, Randles A, Itzkovitz S, Marusyk A, Ametller E, Gonzalez-Farre X, Muñoz M, Russnes HG, Helland A, et al. 2014. Inference of tumor evolution during chemotherapy by computational modeling and in situ analysis of genetic and phenotypic cellular diversity. Cell Rep 6: 514–527. [DOI] [PMC free article] [PubMed] [Google Scholar]
- Baca SC, Prandi D, Lawrence MS, Mosquera JM, Romanel A, Drier Y, Park K, Kitabayashi N, MacDonald TY, Ghandi M, et al. 2013. Punctuated evolution of prostate cancer genomes. Cell 153: 666–677. [DOI] [PMC free article] [PubMed] [Google Scholar]
- Baslan T, Kendall J, Rodgers L, Cox H, Riggs M, Stepansky A, Troge J, Ravi K, Esposito D, Lakshmi B, et al. 2012. Genome-wide copy number analysis of single cells. Nat Protoc 7: 1024–1041. [DOI] [PMC free article] [PubMed] [Google Scholar]
- Baslan T, Kendall J, Ward B, Cox H, Leotta A, Rodgers L, Riggs M, D'Italia S, Sun G, Yong M, et al. 2015. Optimizing sparse sequencing of single cells for highly multiplex copy number profiling. Genome Res 25: 714–724. [DOI] [PMC free article] [PubMed] [Google Scholar]
- Bianconi E, Piovesan A, Facchin F, Beraudi A, Casadei R, Frabetti F, Vitale L, Pelleri MC, Tassani S, Piva F, et al. 2013. An estimation of the number of cells in the human body. Ann Human Biol 40: 463–471. [DOI] [PubMed] [Google Scholar]
- Bielas JH, Loeb LA. 2005. Mutator phenotype in cancer: timing and perspectives. Environ Mol Mutagen 45: 206–213. [DOI] [PubMed] [Google Scholar]
- Bielas JH, Loeb KR, Rubin BP, True LD, Loeb LA. 2006. Human cancers express a mutator phenotype. Proc Natl Acad Sci 103: 18238–18242. [DOI] [PMC free article] [PubMed] [Google Scholar]
- Boj SF, Hwang CI, Baker LA, Chio II, Engle DD, Corbo V, Jager M, Ponz-Sarvise M, Tiriac H, Spector MS, et al. 2015. Organoid models of human and mouse ductal pancreatic cancer. Cell 160: 324–338. [DOI] [PMC free article] [PubMed] [Google Scholar]
- Burrell RA, McGranahan N, Bartek J, Swanton C. 2013. The causes and consequences of genetic heterogeneity in cancer evolution. Nature 501: 338–345. [DOI] [PubMed] [Google Scholar]
- Campbell LL, Polyak K. 2007. Breast tumor heterogeneity: cancer stem cells or clonal evolution? Cell Cycle 6: 2332–2338. [DOI] [PubMed] [Google Scholar]
- Clarke MF, Becker MW. 2006. Stem cells: the real culprits in cancer? Sci Am 295: 52–59. [DOI] [PubMed] [Google Scholar]
- Crosetto N, Bienko M, van Oudenaarden A. 2015. Spatially resolved transcriptomics and beyond. Nat Rev Genet 16: 57–66. [DOI] [PubMed] [Google Scholar]
- Dago AE, Stepansky A, Carlsson A, Luttgen M, Kendall J, Baslan T, Kolatkar A, Wigler M, Bethel K, Gross ME, et al. 2014. Rapid phenotypic and genomic change in response to therapeutic pressure in prostate cancer inferred by high content analysis of single circulating tumor cells. PLoS One 9: e101777. [DOI] [PMC free article] [PubMed] [Google Scholar]
- de Bourcy CF, De Vlaminck I, Kanbar JN, Wang J, Gawad C, Quake SR. 2014. A quantitative comparison of single-cell whole genome amplification methods. PLoS One 9: e105585. [DOI] [PMC free article] [PubMed] [Google Scholar]
- Dey SS, Kester L, Spanjaard B, Bienko M, van Oudenaarden A. 2015. Integrated genome and transcriptome sequencing of the same cell. Nat Biotechnol 33: 285–289. [DOI] [PMC free article] [PubMed] [Google Scholar]
- Eirew P, Steif A, Khattra J, Ha G, Yap D, Farahani H, Gelmon K, Chia S, Mar C, Wan A, et al. 2014. Dynamics of genomic clones in breast cancer patient xenografts at single-cell resolution. Nature 518: 422–426. [DOI] [PMC free article] [PubMed] [Google Scholar]
- Fan HC, Fu GK, Fodor SP. 2015. Expression profiling. Combinatorial labeling of single cells for gene expression cytometry. Science 347: 1258367. [DOI] [PubMed] [Google Scholar]
- Fearon ER, Vogelstein B. 1990. A genetic model for colorectal tumorigenesis. Cell 61: 759–767. [DOI] [PubMed] [Google Scholar]
- Francis JM, Zhang CZ, Maire CL, Jung J, Manzo VE, Adalsteinsson VA, Homer H, Haidar S, Blumenstiel B, Pedamallu CS, et al. 2014. EGFR variant heterogeneity in glioblastoma resolved through single-nucleus sequencing. Cancer Discov 4: 956–971. [DOI] [PMC free article] [PubMed] [Google Scholar]
- Gawad C, Koh W, Quake SR. 2014. Dissecting the clonal origins of childhood acute lymphoblastic leukemia by single-cell genomics. Proc Natl Acad Sci 111: 17947–17952. [DOI] [PMC free article] [PubMed] [Google Scholar]
- Gerlinger M, Rowan AJ, Horswell S, Larkin J, Endesfelder D, Gronroos E, Martinez P, Matthews N, Stewart A, Tarpey P, et al. 2012. Intratumor heterogeneity and branched evolution revealed by multiregion sequencing. N Engl J Med 366: 883–892. [DOI] [PMC free article] [PubMed] [Google Scholar]
- Gotelli N, Colwell R. 2001. Quantifying biodiversity: procedures and pitfalls in the measurement and comparison of species richness. Ecol Lett 4: 379–391. [Google Scholar]
- Greaves M, Maley CC. 2012. Clonal evolution in cancer. Nature 481: 306–313. [DOI] [PMC free article] [PubMed] [Google Scholar]
- Guo H, Zhu P, Wu X, Li X, Wen L, Tang F. 2013. Single-cell methylome landscapes of mouse embryonic stem cells and early embryos analyzed using reduced representation bisulfite sequencing. Genome Res 23: 2126–2135. [DOI] [PMC free article] [PubMed] [Google Scholar]
- Hanahan D, Weinberg RA. 2011. Hallmarks of cancer: the next generation. Cell 144: 646–674. [DOI] [PubMed] [Google Scholar]
- Hashimshony T, Wagner F, Sher N, Yanai I. 2012. CEL-Seq: single-cell RNA-seq by multiplexed linear amplification. Cell Rep 2: 666–673. [DOI] [PubMed] [Google Scholar]
- Heitzer E, Auer M, Gasch C, Pichler M, Ulz P, Hoffmann EM, Lax S, Waldispuehl-Geigl J, Mauermann O, Lackner C, et al. 2013. Complex tumor genomes inferred from single circulating tumor cells by array-CGH and next-generation sequencing. Cancer Res 73: 2965–2975. [DOI] [PubMed] [Google Scholar]
- Hicks J, Krasnitz A, Lakshmi B, Navin NE, Riggs M, Leibu E, Esposito D, Alexander J, Troge J, Grubor V, et al. 2006. Novel patterns of genome rearrangement and their association with survival in breast cancer. Genome Res 16: 1465–1479. [DOI] [PMC free article] [PubMed] [Google Scholar]
- Höglund M, Gisselsson D, Hansen GB, Säll T, Mitelman F. 2002. Multivariate analysis of chromosomal imbalances in breast cancer delineates cytogenetic pathways and reveals complex relationships among imbalances. Cancer Res 62: 2675–2680. [PubMed] [Google Scholar]
- Hou Y, Song L, Zhu P, Zhang B, Tao Y, Xu X, Li F, Wu K, Liang J, Shao D, et al. 2012. Single-cell exome sequencing and monoclonal evolution of a _JAK2_-negative myeloproliferative neoplasm. Cell 148: 873–885. [DOI] [PubMed] [Google Scholar]
- Hughes AE, Magrini V, Demeter R, Miller CA, Fulton R, Fulton LL, Eades WC, Elliott K, Heath S, Westervelt P, et al. 2014. Clonal architecture of secondary acute myeloid leukemia defined by single-cell sequencing. PLoS Genet 10: e1004462. [DOI] [PMC free article] [PubMed] [Google Scholar]
- Islam S, Zeisel A, Joost S, La Manno G, Zajac P, Kasper M, Lonnerberg P, Linnarsson S. 2014. Quantitative single-cell RNA-seq with unique molecular identifiers. Nat Methods 11: 163–166. [DOI] [PubMed] [Google Scholar]
- Jan M, Snyder TM, Corces-Zimmerman MR, Vyas P, Weissman IL, Quake SR, Majeti R. 2012. Clonal evolution of preleukemic hematopoietic stem cells precedes human acute myeloid leukemia. Sci Transl Med 4: 149ra118. [DOI] [PMC free article] [PubMed] [Google Scholar]
- Kalluri R, Weinberg RA. 2009. The basics of epithelial-mesenchymal transition. J Clin Invest 119: 1420–1428. [DOI] [PMC free article] [PubMed] [Google Scholar]
- Kandoth C, McLellan MD, Vandin F, Ye K, Niu B, Lu C, Xie M, Zhang Q, McMichael JF, Wyczalkowski MA, et al. 2013. Mutational landscape and significance across 12 major cancer types. Nature 502: 333–339. [DOI] [PMC free article] [PubMed] [Google Scholar]
- Lee JH, Daugharthy ER, Scheiman J, Kalhor R, Yang JL, Ferrante TC, Terry R, Jeanty SS, Li C, Amamoto R, et al. 2014. Highly multiplexed subcellular RNA sequencing in situ. Science 343: 1360–1363. [DOI] [PMC free article] [PubMed] [Google Scholar]
- Leung ML, Wang Y, Waters J, Navin NE. 2015. SNES: single nucleus exome sequencing. Genome Biol 16: 55. [DOI] [PMC free article] [PubMed] [Google Scholar]
- Li Y, Xu X, Song L, Hou Y, Li Z, Tsang S, Li F, Im KM, Wu K, Wu H, et al. 2012. Single-cell sequencing analysis characterizes common and cell-lineage-specific mutations in a muscle-invasive bladder cancer. Gigascience 1: 12. [DOI] [PMC free article] [PubMed] [Google Scholar]
- Livesey FJ. 2003. Strategies for microarray analysis of limiting amounts of RNA. Brief Funct Genomic Proteomic 2: 31–36. [DOI] [PubMed] [Google Scholar]
- Loeb LA. 2011. Human cancers express mutator phenotypes: origin, consequences and targeting. Nat Rev Cancer 11: 450–457. [DOI] [PMC free article] [PubMed] [Google Scholar]
- Loeb LA, Springgate CF, Battula N. 1974. Errors in DNA replication as a basis of malignant changes. Cancer Res 34: 2311–2321. [PubMed] [Google Scholar]
- Lohr JG, Adalsteinsson VA, Cibulskis K, Choudhury AD, Rosenberg M, Cruz-Gordillo P, Francis JM, Zhang CZ, Shalek AK, Satija R, et al. 2014. Whole-exome sequencing of circulating tumor cells provides a window into metastatic prostate cancer. Nat Biotechnol 32: 479–484. [DOI] [PMC free article] [PubMed] [Google Scholar]
- Lovatt D, Ruble BK, Lee J, Dueck H, Kim TK, Fisher S, Francis C, Spaethling JM, Wolf JA, Grady MS, et al. 2014. Transcriptome in vivo analysis (TIVA) of spatially defined single cells in live tissue. Nat Methods 11: 190–196. [DOI] [PMC free article] [PubMed] [Google Scholar]
- Macaulay IC, Haerty W, Kumar P, Li YI, Hu TX, Teng MJ, Goolam M, Saurat N, Coupland P, Shirley LM, et al. 2015. G&T-seq: parallel sequencing of single-cell genomes and transcriptomes. Nat Methods 12: 519–522. [DOI] [PubMed] [Google Scholar]
- Macosko EZ, Basu A, Satija R, Nemesh J, Shekhar K, Goldman M, Tirosh I, Bialas AR, Kamitaki N, Martersteck EM, et al. 2015. Highly parallel genome-wide expression profiling of individual cells using nanoliter droplets. Cell 161: 1202–1214. [DOI] [PMC free article] [PubMed] [Google Scholar]
- Merlo LMF, Pepper JW, Reid BJ, Maley CC. 2006. Cancer as an evolutionary and ecological process. Nat Rev Cancer 6: 924–935. [DOI] [PubMed] [Google Scholar]
- Murugaesu N, Chew SK, Swanton C. 2013. Adapting clinical paradigms to the challenges of cancer clonal evolution. Am J Pathol 182: 1962–1971. [DOI] [PubMed] [Google Scholar]
- Nagano T, Lubling Y, Stevens TJ, Schoenfelder S, Yaffe E, Dean W, Laue ED, Tanay A, Fraser P. 2013. Single-cell Hi-C reveals cell-to-cell variability in chromosome structure. Nature 502: 59–64. [DOI] [PMC free article] [PubMed] [Google Scholar]
- Navin NE. 2014a. Cancer genomics: one cell at a time. Genome Biol 15: 452. [DOI] [PMC free article] [PubMed] [Google Scholar]
- Navin NE. 2014b. Tumor evolution in response to chemotherapy: phenotype versus genotype. Cell Rep 6: 417–419. [DOI] [PMC free article] [PubMed] [Google Scholar]
- Navin NE, Hicks J. 2010. Tracing the tumor lineage. Mol Oncol 4: 267–283. [DOI] [PMC free article] [PubMed] [Google Scholar]
- Navin N, Krasnitz A, Rodgers L, Cook K, Meth J, Kendall J, Riggs M, Eberling Y, Troge J, Grubor V, et al. 2010. Inferring tumor progression from genomic heterogeneity. Genome Res 20: 68–80. [DOI] [PMC free article] [PubMed] [Google Scholar]
- Navin N, Kendall J, Troge J, Andrews P, Rodgers L, McIndoo J, Cook K, Stepansky A, Levy D, Esposito D, et al. 2011. Tumour evolution inferred by single-cell sequencing. Nature 472: 90–94. [DOI] [PMC free article] [PubMed] [Google Scholar]
- Ni X, Zhuo M, Su Z, Duan J, Gao Y, Wang Z, Zong C, Bai H, Chapman AR, Zhao J, et al. 2013. Reproducible copy number variation patterns among single circulating tumor cells of lung cancer patients. Proc Natl Acad Sci 110: 21083–21088. [DOI] [PMC free article] [PubMed] [Google Scholar]
- Nik-Zainal S, Van Loo P, Wedge DC, Alexandrov LB, Greenman CD, Lau KW, Raine K, Jones D, Marshall J, Ramakrishna M, et al. 2012. The life history of 21 breast cancers. Cell 149: 994–1007. [DOI] [PMC free article] [PubMed] [Google Scholar]
- Pardoll DM. 2012. The blockade of immune checkpoints in cancer immunotherapy. Nat Rev Cancer 12: 252–264. [DOI] [PMC free article] [PubMed] [Google Scholar]
- Patel AP, Tirosh I, Trombetta JJ, Shalek AK, Gillespie SM, Wakimoto H, Cahill DP, Nahed BV, Curry WT, Martuza RL, et al. 2014. Single-cell RNA-seq highlights intratumoral heterogeneity in primary glioblastoma. Science 344: 1396–1401. [DOI] [PMC free article] [PubMed] [Google Scholar]
- Picelli S, Faridani OR, Björklund AK, Winberg G, Sagasser S, Sandberg R. 2014. Full-length RNA-seq from single cells using Smart-seq2. Nat Protoc 9: 171–181. [DOI] [PubMed] [Google Scholar]
- Polyak K. 2007. Breast cancer stem cells: a case of mistaken identity? Stem Cell Rev 3: 107–109. [DOI] [PubMed] [Google Scholar]
- Polyak K, Weinberg RA. 2009. Transitions between epithelial and mesenchymal states: acquisition of malignant and stem cell traits. Nat Rev Cancer 9: 265–273. [DOI] [PubMed] [Google Scholar]
- Potter NE, Ermini L, Papaemmanuil E, Cazzaniga G, Vijayaraghavan G, Titley I, Ford A, Campbell P, Kearney L, Greaves M. 2013. Single-cell mutational profiling and clonal phylogeny in cancer. Genome Res 23: 2115–2125. [DOI] [PMC free article] [PubMed] [Google Scholar]
- Powell AA, Talasaz AH, Zhang H, Coram MA, Reddy A, Deng G, Telli ML, Advani RH, Carlson RW, Mollick JA, et al. 2012. Single cell profiling of circulating tumor cells: transcriptional heterogeneity and diversity from breast cancer cell lines. PLoS One 7: e33788. [DOI] [PMC free article] [PubMed] [Google Scholar]
- Ramsköld D, Luo S, Wang YC, Li R, Deng Q, Faridani OR, Daniels GA, Khrebtukova I, Loring JF, Laurent LC, et al. 2012. Full-length mRNA-Seq from single-cell levels of RNA and individual circulating tumor cells. Nat Biotechnol 30: 777–782. [DOI] [PMC free article] [PubMed] [Google Scholar]
- Ruiz C, Li J, Luttgen MS, Kolatkar A, Kendall JT, Flores E, Topp Z, Samlowski WE, McClay E, Bethel K, et al. 2015. Limited genomic heterogeneity of circulating melanoma cells in advanced stage patients. Phys Biol 12: 016008. [DOI] [PMC free article] [PubMed] [Google Scholar]
- Sabouri-Ghomi M, Wu Y, Hahn K, Danuser G. 2008. Visualizing and quantifying adhesive signals. Curr Opin Cell Biol 20: 541–550. [DOI] [PMC free article] [PubMed] [Google Scholar]
- Sachs N, Clevers H. 2014. Organoid cultures for the analysis of cancer phenotypes. Curr Opin Genet Dev 24: 68–73. [DOI] [PubMed] [Google Scholar]
- Shah SP, Roth A, Goya R, Oloumi A, Ha G, Zhao Y, Turashvili G, Ding J, Tse K, Haffari G, et al. 2012. The clonal and mutational evolution spectrum of primary triple-negative breast cancers. Nature 486: 395–399. [DOI] [PMC free article] [PubMed] [Google Scholar]
- Shipitsin M, Polyak K. 2008. The cancer stem cell hypothesis: in search of definitions, markers, and relevance. Lab Invest 88: 459–463. [DOI] [PMC free article] [PubMed] [Google Scholar]
- Stegle O, Teichmann SA, Marioni JC. 2015. Computational and analytical challenges in single-cell transcriptomics. Nat Rev Genet 16: 133–145. [DOI] [PubMed] [Google Scholar]
- Stephens PJ, Greenman CD, Fu B, Yang F, Bignell GR, Mudie LJ, Pleasance ED, Lau KW, Beare D, Stebbings LA, et al. 2011. Massive genomic rearrangement acquired in a single catastrophic event during cancer development. Cell 144: 27–40. [DOI] [PMC free article] [PubMed] [Google Scholar]
- Stingl J, Caldas C. 2007. Molecular heterogeneity of breast carcinomas and the cancer stem cell hypothesis. Nat Rev Cancer 7: 791–799. [DOI] [PubMed] [Google Scholar]
- Suzuki A, Matsushima K, Makinoshima H, Sugano S, Kohno T, Tsuchihara K, Suzuki Y. 2015. Single-cell analysis of lung adenocarcinoma cell lines reveals diverse expression patterns of individual cells invoked by a molecular target drug treatment. Genome Biol 16: 66. [DOI] [PMC free article] [PubMed] [Google Scholar]
- Tang F, Barbacioru C, Wang Y, Nordman E, Lee C, Xu N, Wang X, Bodeau J, Tuch BB, Siddiqui A, et al. 2009. mRNA-Seq whole-transcriptome analysis of a single cell. Nat Methods 6: 377–382. [DOI] [PubMed] [Google Scholar]
- Ting DT, Wittner BS, Ligorio M, Vincent Jordan N, Shah AM, Miyamoto DT, Aceto N, Bersani F, Brannigan BW, Xega K, et al. 2014. Single-cell RNA sequencing identifies extracellular matrix gene expression by pancreatic circulating tumor cells. Cell Rep 8: 1905–1918. [DOI] [PMC free article] [PubMed] [Google Scholar]
- Tomasson MH. 2009. Cancer stem cells: a guide for skeptics. J Cell Biochem 106: 745–749. [DOI] [PubMed] [Google Scholar]
- Van Loo P, Voet T. 2014. Single cell analysis of cancer genomes. Curr Opin Genet Dev 24: 82–91. [DOI] [PubMed] [Google Scholar]
- Verhaak RG, Hoadley KA, Purdom E, Wang V, Qi Y, Wilkerson MD, Miller CR, Ding L, Golub T, Mesirov JP, et al. 2010. Integrated genomic analysis identifies clinically relevant subtypes of glioblastoma characterized by abnormalities in PDGFRA, IDH1, EGFR, and NF1. Cancer Cell 17: 98–110. [DOI] [PMC free article] [PubMed] [Google Scholar]
- Wang Y, Navin NE. 2015. Advances and applications of single-cell sequencing technologies. Mol Cell 58: 598–609. [DOI] [PMC free article] [PubMed] [Google Scholar]
- Wang Y, Waters J, Leung ML, Unruh A, Roh W, Shi X, Chen K, Scheet P, Vattathil S, Liang H, et al. 2014. Clonal evolution in breast cancer revealed by single nucleus genome sequencing. Nature 512: 155–160. [DOI] [PMC free article] [PubMed] [Google Scholar]
- Wendl MC, Wilson RK. 2009. The theory of discovering rare variants via DNA sequencing. BMC Genomics 10: 485. [DOI] [PMC free article] [PubMed] [Google Scholar]
- Wu AR, Neff NF, Kalisky T, Dalerba P, Treutlein B, Rothenberg ME, Mburu FM, Mantalas GL, Sim S, Clarke MF, et al. 2014. Quantitative assessment of single-cell RNA-sequencing methods. Nat Methods 11: 41–46. [DOI] [PMC free article] [PubMed] [Google Scholar]
- Xu X, Hou Y, Yin X, Bao L, Tang A, Song L, Li F, Tsang S, Wu K, Wu H, et al. 2012. Single-cell exome sequencing reveals single-nucleotide mutation characteristics of a kidney tumor. Cell 148: 886–895. [DOI] [PMC free article] [PubMed] [Google Scholar]
- Yu C, Yu J, Yao X, Wu WK, Lu Y, Tang S, Li X, Bao L, Li X, Hou Y, et al. 2014. Discovery of biclonal origin and a novel oncogene SLC12A5 in colon cancer by single-cell sequencing. Cell Res 24: 701–712. [DOI] [PMC free article] [PubMed] [Google Scholar]
- Zhang J, Fujimoto J, Zhang J, Wedge DC, Song X, Zhang J, Seth S, Chow CW, Cao Y, Gumbs C, et al. 2014. Intratumor heterogeneity in localized lung adenocarcinomas delineated by multiregion sequencing. Science 346: 256–259. [DOI] [PMC free article] [PubMed] [Google Scholar]
- Zhang CZ, Adalsteinsson VA, Francis J, Cornils H, Jung J, Maire C, Ligon KL, Meyerson M, Love JC. 2015a. Calibrating genomic and allelic coverage bias in single-cell sequencing. Nat Commun 6: 6822. [DOI] [PMC free article] [PubMed] [Google Scholar]
- Zhang CZ, Spektor A, Cornils H, Francis JM, Jackson EK, Liu S, Meyerson M, Pellman D. 2015b. Chromothripsis from DNA damage in micronuclei. Nature 522: 179–184. [DOI] [PMC free article] [PubMed] [Google Scholar]
- Zong C, Lu S, Chapman AR, Xie XS. 2012. Genome-wide detection of single-nucleotide and copy-number variations of a single human cell. Science 338: 1622–1626. [DOI] [PMC free article] [PubMed] [Google Scholar]