Discovery of potential biomarkers in human melanoma cells with different metastatic potential by metabolic and lipidomic profiling - PubMed (original) (raw)
Discovery of potential biomarkers in human melanoma cells with different metastatic potential by metabolic and lipidomic profiling
Hye-Youn Kim et al. Sci Rep. 2017.
Abstract
Malignant melanoma, characterized by its ability to metastasize to other organs, is responsible for 90% of skin cancer mortality. To investigate alterations in the cellular metabolome and lipidome related to melanoma metastasis, gas chromatography-mass spectrometry (GC-MS) and direct infusion-mass spectrometry (DI-MS)-based metabolic and lipidomic profiling were performed on extracts of normal human melanocyte (HEMn-LP), low metastatic melanoma (A375, G361), and highly metastatic melanoma (A2058, SK-MEL-28) cell lines. In this study, metabolomic analysis identified aminomalonic acid as a novel potential biomarker to discriminate between different stages of melanoma metastasis. Uptake and release of major metabolites as hallmarks of cancer were also measured between high and low metastatic melanoma cells. Lipid analysis showed a progressive increase in phosphatidylinositol (PI) species with saturated and monounsaturated fatty acyl chains, including 16:0/18:0, 16:0/18:1, 18:0/18:0, and 18:0/18:1, with increasing metastatic potential of melanoma cells, defining these lipids as possible biomarkers. In addition, a partial-least-squares projection to latent structure regression (PLSR) model for the prediction of metastatic properties of melanoma was established, and central metabolic and lipidomic pathways involved in the increased motility and metastatic potential of melanoma cells were identified as therapeutic targets. These results could be used to diagnose and control of melanoma metastasis.
Conflict of interest statement
The authors declare that they have no competing interests.
Figures
Figure 1
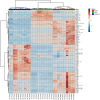
Heatmap representing the relative levels of metabolites and lipids in the three different cell types (HEMn-LP, A375, A2058).
Figure 2
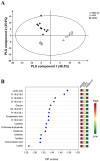
PLS-DA analysis based on metabolic and lipidomic data. (A) PLS-DA-derived score plot from melanocytes and two melanoma cell lines (n = 10 for each group) and (B) important metabolites and lipids selected based on VIP scores.
Figure 3
Establishment and validation of the PLSR model for prediction of the metastatic stage of melanocyte and metastatic melanoma cells (calibration dataset, n = 10, black and white; validation dataset, n = 2, red).
Figure 4
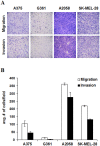
The migratory and invasive potential of the melanoma cell lines (A375, G361, A2058, and SK-MEL-28). (A) Represented images of migrated and invaded cells and (B) quantified data (mean ± SEM) from three independent experiments.
Figure 5
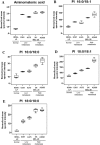
Box plots depicting the relative levels of potential biomarkers, (A) aminomalonic acid, (B) PI 16:0/18:1, (C) PI 16:0/18:0, (D) PI 18:0/18:1 and (E) PI 18:0/18:0 of normal human melanocytes and melanoma cells with different metastatic potential. Normal human melanocyte (HEMn-Lp), low metastatic melanoma cell lines (A375, G361), and highly metastatic melanoma cell lines (A2058, SK-MEL-28).
Figure 6
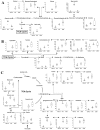
Metabolic changes and associated pathways in melanocytes and melanoma cells with different metastatic potential (HEMn-LP, A375, A2058), as determined by gas chromatography-mass spectrometry. Major pathways associated with melanoma metastasis, (A) glycolysis, (B) glycine, serine and threonine metabolism, and cysteine and methionine metabolism, (C) alanine, aspartate and glutamate metabolism, arginine and proline metabolism, and β-alanine metabolism were identified. Metabolic pathways were proposed based on a comparison with data in the KEGG database (
). ANOVA, followed by Tukey’s post-hoc test (p < 0.05), was conducted, and different letters indicate statistically significant differences between samples.
Figure 7
Schematic representation of the glycerophospholipid and sphingolipid pathways in human melanoma cells. Box plots show relative changes in lipid species with VIP > 1.0 in melanocytes and melanoma cells with different metastatic potential (HEMn-LP, A375, A2058) as determined by direct infusion-mass spectrometry. ANOVA, followed by Tukey’s post-hoc test (p < 0.05), was conducted, and different letters indicate statistically significant differences between samples. Proposed pathways were based on data in the KEGG database (
). PC, phosphatidylcholine; PE, phosphatidylethanolamine; PG, phosphatidylglycerol; PI, phosphatidylinositol; PS, phosphatidylserine; LPA, lysophosphatidic acid; PA, phosphatidic acid; DAG, diacylglycerol; CDP-DAG, cytidine diphosphate-diacylglycerol; Pm-CoA, palmitoyl coenzyme A; S1P, sphingosine-1-phosphate .
Similar articles
- Comparative metabolic and lipidomic profiling of human breast cancer cells with different metastatic potentials.
Kim HY, Lee KM, Kim SH, Kwon YJ, Chun YJ, Choi HK. Kim HY, et al. Oncotarget. 2016 Oct 11;7(41):67111-67128. doi: 10.18632/oncotarget.11560. Oncotarget. 2016. PMID: 27564096 Free PMC article. - A UHPLC-Mass Spectrometry View of Human Melanocytic Cells Uncovers Potential Lipid Biomarkers of Melanoma.
Perez-Valle A, Abad-García B, Fresnedo O, Barreda-Gómez G, Aspichueta P, Asumendi A, Astigarraga E, Fernández JA, Boyano MD, Ochoa B. Perez-Valle A, et al. Int J Mol Sci. 2021 Nov 8;22(21):12061. doi: 10.3390/ijms222112061. Int J Mol Sci. 2021. PMID: 34769491 Free PMC article. - Human Melanoma-Cell Metabolic Profiling: Identification of Novel Biomarkers Indicating Metastasis.
Kosmopoulou M, Giannopoulou AF, Iliou A, Benaki D, Panagiotakis A, Velentzas AD, Konstantakou EG, Papassideri IS, Mikros E, Stravopodis DJ, Gikas E. Kosmopoulou M, et al. Int J Mol Sci. 2020 Mar 31;21(7):2436. doi: 10.3390/ijms21072436. Int J Mol Sci. 2020. PMID: 32244549 Free PMC article. - Translational Metabolomics of Head Injury: Exploring Dysfunctional Cerebral Metabolism with Ex Vivo NMR Spectroscopy-Based Metabolite Quantification.
Wolahan SM, Hirt D, Glenn TC. Wolahan SM, et al. In: Kobeissy FH, editor. Brain Neurotrauma: Molecular, Neuropsychological, and Rehabilitation Aspects. Boca Raton (FL): CRC Press/Taylor & Francis; 2015. Chapter 25. In: Kobeissy FH, editor. Brain Neurotrauma: Molecular, Neuropsychological, and Rehabilitation Aspects. Boca Raton (FL): CRC Press/Taylor & Francis; 2015. Chapter 25. PMID: 26269925 Free Books & Documents. Review. - Mass spectrometric based approaches in urine metabolomics and biomarker discovery.
Khamis MM, Adamko DJ, El-Aneed A. Khamis MM, et al. Mass Spectrom Rev. 2017 Mar;36(2):115-134. doi: 10.1002/mas.21455. Epub 2015 Apr 16. Mass Spectrom Rev. 2017. PMID: 25881008 Review.
Cited by
- Genetically predicted metabolites mediate the association between lipidome and malignant melanoma of skin.
Wu Y, Ma H, Liu Z. Wu Y, et al. Front Oncol. 2024 Sep 10;14:1430533. doi: 10.3389/fonc.2024.1430533. eCollection 2024. Front Oncol. 2024. PMID: 39319051 Free PMC article. - From Lipid Signatures to Cellular Responses: Unraveling the Complexity of Melanoma and Furthering Its Diagnosis and Treatment.
Díaz-Grijuela E, Hernández A, Caballero C, Fernandez R, Urtasun R, Gulak M, Astigarraga E, Barajas M, Barreda-Gómez G. Díaz-Grijuela E, et al. Medicina (Kaunas). 2024 Jul 25;60(8):1204. doi: 10.3390/medicina60081204. Medicina (Kaunas). 2024. PMID: 39202486 Free PMC article. Review. - Identification of Plasma Lipid Alterations Associated with Melanoma Metastasis.
Szász I, Koroknai V, Várvölgyi T, Pál L, Szűcs S, Pikó P, Emri G, Janka E, Szabó IL, Ádány R, Balázs M. Szász I, et al. Int J Mol Sci. 2024 Apr 11;25(8):4251. doi: 10.3390/ijms25084251. Int J Mol Sci. 2024. PMID: 38673837 Free PMC article. - Alterations in Plasma Lipid Profiles Associated with Melanoma and Therapy Resistance.
Dei Cas M, Ciniselli CM, Vergani E, Ciusani E, Aloisi M, Duroni V, Verderio P, Ghidoni R, Paroni R, Perego P, Beretta GL, Gatti L, Rodolfo M. Dei Cas M, et al. Int J Mol Sci. 2024 Jan 26;25(3):1558. doi: 10.3390/ijms25031558. Int J Mol Sci. 2024. PMID: 38338838 Free PMC article. - Differences in the phospholipid profile of melanocytes and melanoma cells irradiated with UVA and treated with cannabigerol and cannabidiol.
Łuczaj W, Dobrzyńska I, Skrzydlewska E. Łuczaj W, et al. Sci Rep. 2023 Sep 26;13(1):16121. doi: 10.1038/s41598-023-43363-9. Sci Rep. 2023. PMID: 37752196 Free PMC article.
References
- Howlader, N. et al. SEER cancer statistics review, 1975–2012. Bethesda, MD: National Cancer Institute, http://seer.cancer.gov/csr/1975_2012/ (2015).
Publication types
MeSH terms
Substances
LinkOut - more resources
Full Text Sources
Other Literature Sources
Medical
Research Materials
Miscellaneous
