LinearModel - Linear regression model - MATLAB (original) (raw)
Description
LinearModel is a fitted linear regression model object. A regression model describes the relationship between a response and predictors. The linearity in a linear regression model refers to the linearity of the predictor coefficients.
Use the properties of a LinearModel object to investigate a fitted linear regression model. The object properties include information about coefficient estimates, summary statistics, fitting method, and input data. Use the object functions to predict responses and to modify, evaluate, and visualize the linear regression model.
Creation
Create a LinearModel object by using fitlm or stepwiselm.
fitlm fits a linear regression model to data using a fixed model specification. Use addTerms, removeTerms, or step to add or remove terms from the model. Alternatively, use stepwiselm to fit a model using stepwise linear regression.
Properties
Coefficient Estimates
This property is read-only.
Data Types: single | double
This property is read-only.
Coefficient names, represented as a cell array of character vectors, each containing the name of the corresponding term.
Data Types: cell
This property is read-only.
Data Types: table
This property is read-only.
Number of model coefficients, represented as a positive integer.NumCoefficients includes coefficients that are set to zero when the model terms are rank deficient.
Data Types: double
This property is read-only.
Number of estimated coefficients in the model, specified as a positive integer.NumEstimatedCoefficients does not include coefficients that are set to zero when the model terms are rank deficient.NumEstimatedCoefficients is the degrees of freedom for regression.
Data Types: double
Summary Statistics
This property is read-only.
Degrees of freedom for the error (residuals), equal to the number of observations minus the number of estimated coefficients, represented as a positive integer.
Data Types: double
This property is read-only.
Data Types: table
This property is read-only.
Fitted (predicted) response values based on the input data, represented as an_n_-by-1 numeric vector. n is the number of observations in the input data. Use predict to calculate predictions for other predictor values, or to compute confidence bounds on Fitted.
Data Types: single | double
This property is read-only.
Loglikelihood of response values, specified as a numeric value, based on the assumption that each response value follows a normal distribution. The mean of the normal distribution is the fitted (predicted) response value, and the variance is theMSE.
Data Types: single | double
This property is read-only.
Data Types: struct
This property is read-only.
F-statistic of the regression model, specified as a structure. TheModelFitVsNullModel structure contains these fields:
Fstats— F-statistic of the fitted model versus the null modelPvalue— _p_-value for the F-statisticNullModel— null model type
Data Types: struct
This property is read-only.
Data Types: single | double
This property is read-only.
Data Types: table
This property is read-only.
Data Types: single | double
This property is read-only.
Data Types: struct
This property is read-only.
Data Types: single | double
This property is read-only.
Data Types: single | double
This property is read-only.
Data Types: single | double
Fitting Method
This property is read-only.
Data Types: struct
This property is read-only.
Data Types: struct
Input Data
This property is read-only.
Number of observations the fitting function used in fitting, specified as a positive integer. NumObservations is the number of observations supplied in the original table, dataset, or matrix, minus any excluded rows (set with the'Exclude' name-value pair argument) or rows with missing values.
Data Types: double
This property is read-only.
Data Types: table
Object Functions
| compact | Compact linear regression model |
|---|
| addTerms | Add terms to linear regression model |
|---|---|
| removeTerms | Remove terms from linear regression model |
| step | Improve linear regression model by adding or removing terms |
| feval | Predict responses of linear regression model using one input for each predictor |
|---|---|
| predict | Predict responses of linear regression model |
| random | Simulate responses with random noise for linear regression model |
| anova | Analysis of variance for linear regression model |
|---|---|
| coefCI | Confidence intervals of coefficient estimates of linear regression model |
| coefTest | Linear hypothesis test on linear regression model coefficients |
| dwtest | Durbin-Watson test with linear regression model object |
| partialDependence | Compute partial dependence |
| plot | Scatter plot or added variable plot of linear regression model |
|---|---|
| plotAdded | Added variable plot of linear regression model |
| plotAdjustedResponse | Adjusted response plot of linear regression model |
| plotDiagnostics | Plot observation diagnostics of linear regression model |
| plotEffects | Plot main effects of predictors in linear regression model |
| plotInteraction | Plot interaction effects of two predictors in linear regression model |
| plotPartialDependence | Create partial dependence plot (PDP) and individual conditional expectation (ICE) plots |
| plotResiduals | Plot residuals of linear regression model |
| plotSlice | Plot of slices through fitted linear regression surface |
| gather | Gather properties of Statistics and Machine Learning Toolbox object from GPU |
|---|
Examples
Fit a linear regression model using a matrix input data set.
Load the carsmall data set, a matrix input data set.
load carsmall X = [Weight,Horsepower,Acceleration];
Fit a linear regression model by using fitlm.
mdl = Linear regression model: y ~ 1 + x1 + x2 + x3
Estimated Coefficients:
Estimate SE tStat pValue
__________ _________ _________ __________
(Intercept)        47.977       3.8785        12.37    4.8957e-21
x1             -0.0065416    0.0011274      -5.8023    9.8742e-08
x2              -0.042943     0.024313      -1.7663       0.08078
x3              -0.011583      0.19333    -0.059913       0.95236
Number of observations: 93, Error degrees of freedom: 89 Root Mean Squared Error: 4.09 R-squared: 0.752, Adjusted R-Squared: 0.744 F-statistic vs. constant model: 90, p-value = 7.38e-27
The model display includes the model formula, estimated coefficients, and model summary statistics.
The model formula in the display, y ~ 1 + x1 + x2 + x3, corresponds to y=β0+β1X1+β2X2+β3X3+ϵ.
The model display also shows the estimated coefficient information, which is stored in the Coefficients property. Display the Coefficients property.
ans=4×4 table
Estimate SE tStat pValue
__________ _________ _________ __________
(Intercept)        47.977       3.8785        12.37    4.8957e-21
x1             -0.0065416    0.0011274      -5.8023    9.8742e-08
x2              -0.042943     0.024313      -1.7663       0.08078
x3              -0.011583      0.19333    -0.059913       0.95236
The Coefficient property includes these columns:
Estimate— Coefficient estimates for each corresponding term in the model. For example, the estimate for the constant term (intercept) is 47.977.SE— Standard error of the coefficients.tStat— _t_-statistic for each coefficient to test the null hypothesis that the corresponding coefficient is zero against the alternative that it is different from zero, given the other predictors in the model. Note thattStat = Estimate/SE. For example, the _t_-statistic for the intercept is 47.977/3.8785 = 12.37.pValue— _p_-value for the _t_-statistic of the two-sided hypothesis test. For example, the _p_-value of the _t_-statistic forx2is greater than 0.05, so this term is not significant at the 5% significance level given the other terms in the model.
The summary statistics of the model are:
Number of observations— Number of rows without anyNaNvalues. For example,Number of observationsis 93 because theMPGdata vector has sixNaNvalues and theHorsepowerdata vector has oneNaNvalue for a different observation, where the number of rows inXandMPGis 100.Error degrees of freedom— n – p, where n is the number of observations, and p is the number of coefficients in the model, including the intercept. For example, the model has four predictors, so theError degrees of freedomis 93 – 4 = 89.Root mean squared error— Square root of the mean squared error, which estimates the standard deviation of the error distribution.R-squaredandAdjusted R-squared— Coefficient of determination and adjusted coefficient of determination, respectively. For example, theR-squaredvalue suggests that the model explains approximately 75% of the variability in the response variableMPG.F-statistic vs. constant model— Test statistic for the _F_-test on the regression model, which tests whether the model fits significantly better than a degenerate model consisting of only a constant term.p-value— _p_-value for the _F_-test on the model. For example, the model is significant with a _p_-value of 7.3816e-27.
You can find these statistics in the model properties (NumObservations, DFE, RMSE, and Rsquared) and by using the anova function.
ans=3×5 table
SumSq DF MeanSq F pValue
______ __ ______ ______ __________
Total 6004.8 92 65.269
Model 4516 3 1505.3 89.987 7.3816e-27
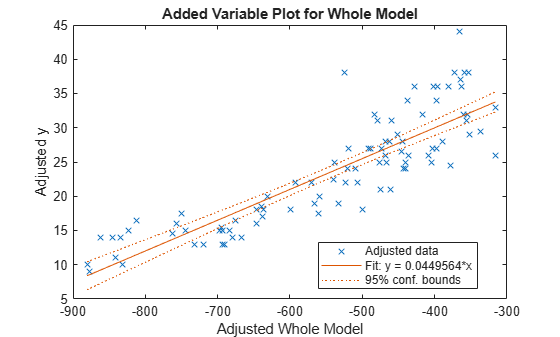
Residual 1488.8 89 16.728 Use plot to create an added variable plot (partial regression leverage plot) for the whole model except the constant (intercept) term.
Fit a linear regression model that contains a categorical predictor. Reorder the categories of the categorical predictor to control the reference level in the model. Then, use anova to test the significance of the categorical variable.
Model with Categorical Predictor
Load the carsmall data set and create a linear regression model of MPG as a function of Model_Year. To treat the numeric vector Model_Year as a categorical variable, identify the predictor using the 'CategoricalVars' name-value pair argument.
load carsmall mdl = fitlm(Model_Year,MPG,'CategoricalVars',1,'VarNames',{'Model_Year','MPG'})
mdl = Linear regression model: MPG ~ 1 + Model_Year
Estimated Coefficients:
Estimate SE tStat pValue
________ ______ ______ __________
(Intercept)        17.69     1.0328    17.127    3.2371e-30
Model_Year_76     3.8839     1.4059    2.7625     0.0069402
Model_Year_82      14.02     1.4369    9.7571    8.2164e-16
Number of observations: 94, Error degrees of freedom: 91 Root Mean Squared Error: 5.56 R-squared: 0.531, Adjusted R-Squared: 0.521 F-statistic vs. constant model: 51.6, p-value = 1.07e-15
The model formula in the display, MPG ~ 1 + Model_Year, corresponds to
MPG=β0+β1ΙYear=76+β2ΙYear=82+ϵ,
where ΙYear=76 and ΙYear=82 are indicator variables whose value is one if the value of Model_Year is 76 and 82, respectively. The Model_Year variable includes three distinct values, which you can check by using the unique function.
fitlm chooses the smallest value in Model_Year as a reference level ('70') and creates two indicator variables ΙYear=76 and ΙYear=82. The model includes only two indicator variables because the design matrix becomes rank deficient if the model includes three indicator variables (one for each level) and an intercept term.
Model with Full Indicator Variables
You can interpret the model formula of mdl as a model that has three indicator variables without an intercept term:
y=β0Ιx1=70+(β0+β1)Ιx1=76+(β0+β2)Ιx2=82+ϵ.
Alternatively, you can create a model that has three indicator variables without an intercept term by manually creating indicator variables and specifying the model formula.
temp_Year = dummyvar(categorical(Model_Year)); Model_Year_70 = temp_Year(:,1); Model_Year_76 = temp_Year(:,2); Model_Year_82 = temp_Year(:,3); tbl = table(Model_Year_70,Model_Year_76,Model_Year_82,MPG); mdl = fitlm(tbl,'MPG ~ Model_Year_70 + Model_Year_76 + Model_Year_82 - 1')
mdl = Linear regression model: MPG ~ Model_Year_70 + Model_Year_76 + Model_Year_82
Estimated Coefficients:
Estimate SE tStat pValue
________ _______ ______ __________
Model_Year_70      17.69      1.0328    17.127    3.2371e-30
Model_Year_76     21.574     0.95387    22.617    4.0156e-39
Model_Year_82      31.71     0.99896    31.743    5.2234e-51
Number of observations: 94, Error degrees of freedom: 91 Root Mean Squared Error: 5.56
Choose Reference Level in Model
You can choose a reference level by modifying the order of categories in a categorical variable. First, create a categorical variable Year.
Year = categorical(Model_Year);
Check the order of categories by using the categories function.
ans = 3×1 cell {'70'} {'76'} {'82'}
If you use Year as a predictor variable, then fitlm chooses the first category '70' as a reference level. Reorder Year by using the reordercats function.
Year_reordered = reordercats(Year,{'76','70','82'}); categories(Year_reordered)
ans = 3×1 cell {'76'} {'70'} {'82'}
The first category of Year_reordered is '76'. Create a linear regression model of MPG as a function of Year_reordered.
mdl2 = fitlm(Year_reordered,MPG,'VarNames',{'Model_Year','MPG'})
mdl2 = Linear regression model: MPG ~ 1 + Model_Year
Estimated Coefficients:
Estimate SE tStat pValue
________ _______ _______ __________
(Intercept)       21.574     0.95387     22.617    4.0156e-39
Model_Year_70    -3.8839      1.4059    -2.7625     0.0069402
Model_Year_82     10.136      1.3812     7.3385    8.7634e-11
Number of observations: 94, Error degrees of freedom: 91 Root Mean Squared Error: 5.56 R-squared: 0.531, Adjusted R-Squared: 0.521 F-statistic vs. constant model: 51.6, p-value = 1.07e-15
mdl2 uses '76' as a reference level and includes two indicator variables ΙYear=70 and ΙYear=82.
Evaluate Categorical Predictor
The model display of mdl2 includes a _p_-value of each term to test whether or not the corresponding coefficient is equal to zero. Each _p_-value examines each indicator variable. To examine the categorical variable Model_Year as a group of indicator variables, use anova. Use the 'components'(default) option to return a component ANOVA table that includes ANOVA statistics for each variable in the model except the constant term.
ans=2×5 table
SumSq DF MeanSq F pValue
______ __ ______ _____ __________
Model_Year    3190.1     2    1595.1    51.56    1.0694e-15
Error         2815.2    91    30.936
The component ANOVA table includes the _p_-value of the Model_Year variable, which is smaller than the _p_-values of the indicator variables.
Load the hald data set, which measures the effect of cement composition on its hardening heat.
This data set includes the variables ingredients and heat. The matrix ingredients contains the percent composition of four chemicals present in the cement. The vector heat contains the values for the heat hardening after 180 days for each cement sample.
Fit a robust linear regression model to the data.
mdl = fitlm(ingredients,heat,'RobustOpts','on')
mdl = Linear regression model (robust fit): y ~ 1 + x1 + x2 + x3 + x4
Estimated Coefficients: Estimate SE tStat pValue ________ _______ ________ ________
(Intercept)       60.09     75.818     0.79256      0.4509
x1               1.5753    0.80585      1.9548    0.086346
x2               0.5322    0.78315     0.67957     0.51596
x3              0.13346     0.8166     0.16343     0.87424
x4             -0.12052     0.7672    -0.15709     0.87906
Number of observations: 13, Error degrees of freedom: 8 Root Mean Squared Error: 2.65 R-squared: 0.979, Adjusted R-Squared: 0.969 F-statistic vs. constant model: 94.6, p-value = 9.03e-07
For more details, see the topic Reduce Outlier Effects Using Robust Regression, which compares the results of a robust fit to a standard least-squares fit.
Load the hald data set, which measures the effect of cement composition on its hardening heat.
This data set includes the variables ingredients and heat. The matrix ingredients contains the percent composition of four chemicals present in the cement. The vector heat contains the values for the heat hardening after 180 days for each cement sample.
Fit a stepwise linear regression model to the data. Specify 0.06 as the threshold for the criterion to add a term to the model.
mdl = stepwiselm(ingredients,heat,'PEnter',0.06)
- Adding x4, FStat = 22.7985, pValue = 0.000576232
- Adding x1, FStat = 108.2239, pValue = 1.105281e-06
- Adding x2, FStat = 5.0259, pValue = 0.051687
- Removing x4, FStat = 1.8633, pValue = 0.2054
mdl = Linear regression model: y ~ 1 + x1 + x2
Estimated Coefficients:
Estimate SE tStat pValue
________ ________ ______ __________
(Intercept)     52.577       2.2862    22.998    5.4566e-10
x1              1.4683       0.1213    12.105    2.6922e-07
x2             0.66225     0.045855    14.442     5.029e-08
Number of observations: 13, Error degrees of freedom: 10 Root Mean Squared Error: 2.41 R-squared: 0.979, Adjusted R-Squared: 0.974 F-statistic vs. constant model: 230, p-value = 4.41e-09
By default, the starting model is a constant model. stepwiselm performs forward selection and adds the x4, x1, and x2 terms (in that order), because the corresponding _p_-values are less than the PEnter value of 0.06. stepwiselm then uses backward elimination and removes x4 from the model because, once x2 is in the model, the _p_-value of x4 is greater than the default value of PRemove, 0.1.
More About
A terms matrix T is a _t_-by-(p + 1) matrix that specifies the terms in a model, where t is the number of terms,p is the number of predictor variables, and +1 accounts for the response variable. The value of T(i,j) is the exponent of variablej in term i.
For example, suppose that an input includes three predictor variables, x1,x2, and x3, and the response variabley in the order x1, x2,x3, and y. Each row of T represents one term:
[0 0 0 0]— Constant term (intercept)[0 1 0 0]—x2; equivalently,x1^0 * x2^1 * x3^0[1 0 1 0]—x1*x3[2 0 0 0]—x1^2[0 1 2 0]—x2*(x3^2)
The 0 at the end of each term represents the response variable. In general, a column vector of zeros in a terms matrix represents the position of the response variable. If the predictor and response variables are in a matrix and column vector, respectively, then you must include 0 for the response variable in the last column of each row.
Alternative Functionality
- For reduced computation time on high-dimensional data sets, fit a linear regression model using the fitrlinear function.
- To regularize a regression, use fitrlinear, lasso, ridge, or plsregress.
- fitrlinear regularizes a regression for high-dimensional data sets using lasso or ridge regression.
- lasso removes redundant predictors in linear regression using lasso or elastic net.
- ridge regularizes a regression with correlated terms using ridge regression.
- plsregress regularizes a regression with correlated terms using partial least squares.
Extended Capabilities
Usage notes and limitations:
- The object functions of a
LinearModelmodel fully support GPU arrays.
For more information, see Run MATLAB Functions on a GPU (Parallel Computing Toolbox).
Version History
Introduced in R2012a