Ultrashort Pulse Propagation in Passive Fibers With the Software RP Fiber Power (original) (raw)
![]()
RP Fiber Power — Simulation and Design Software for Fiber Optics, Amplifiers and Fiber Lasers
Power Form: Passive Fiber for Ultrashort Pulses
This Power Form allows one to conveniently simulate the propagation of ultrashort pulses in a passive fiber, or in a sequence of such fibers.
In principle, this could also be done with the Power Form for ultrafast amplifiers by setting the doping concentration of active ions to zero, but it is more convenient to use this simpler form.
Demo Video
One of our case studies has been produced using the Power Form described here:
Your browser does not support the video tag. However, you can download the video file.
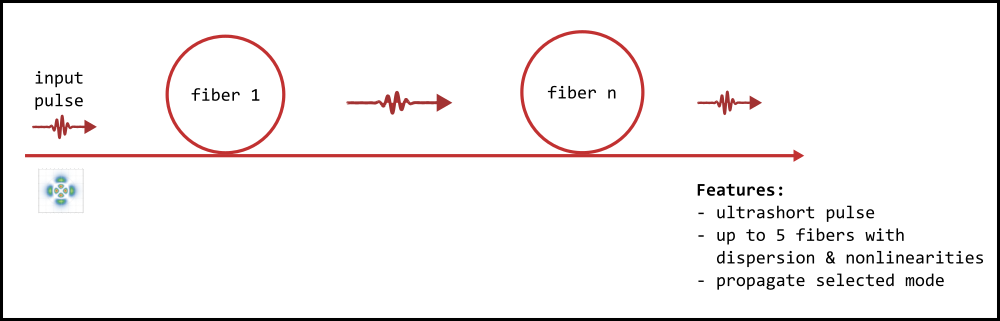
Basic Features of the Model
- Passive Fibers: We simulate a chain of up to five passive fibers. Each fiber may be activated or deactivated; in the latter case, the light is not passed through it.
- Input pulse: we define an ultrashort pulse, which may be specified in different ways, e.g. with some energy, duration, temporal shape and chirp. One can also load a pulse profile from a file.
- Fiber parameters: for each fiber, we define a number of basic properties, such as the length and the core diameter. The transverse intensity profile can be either manually input (e.g., as a Gaussian profile), or a mode calculation can be done and a specific mode selected.
- Dispersion and nonlinearities: wavelength-dependent dispersion can be manually added to the pulse before, after and within the fiber. The fiber dispersion can also be automatically calculated if a doping profile is specified. A nonlinear index and self-steepening factor can be specified, along with a delayed nonlinear response function.
- Coupling losses: after each fiber, and after the input pulse source, we can introduce coupling losses, which can be time- and wavelength-dependent.
- Automatic dispersive pulse compression at the end is also possible.
Input Pulse Details
In this section of the Power Form, you can define the input pulse which will be sent into the first passive fiber. Further, you set the details for the temporal grid used to represent pulses in the time or frequency domain.

One will often use Gaussian, sech2 or Lorentzian-shaped pulses, possibly with some chirp, but one may also freely define amplitude functions in the time or frequency domain:

Fibers
One can define a chain of up to 5 passive fibers, each potentially with its own unique properties:

The fiber mode details can be defined in three different ways:
Manual input: enter the mode radius (for a Gaussian or rectangular transverse shape) and specify chromatic dispersion either directly (as GVD) or indirectly via the effective refractive index vs. wavelength.Refractive index profile: define such a profile in one or several ways for the center wavelength. The transverse mode profiles of all modes will be calculated, and one of those modes is selected for pulse propagation. In addition, you can specify the dispersion as in the previous case.Doping profile of a germanosilicate fiber: Here, the doping profile determines the wavelength-dependent refractive index profile, and the modes are calculated from that. The chromatic dispersion is calculated automatically.
Diagrams
In addition to various numerical outputs in the form and in the output area on the right side, the form offers a choice of diagrams for displaying various kinds of results:

Just select those which you need, and configure certain options. For example, most diagrams offer the option of using a dBm scale instead of a linear vertical scale.
In the form, the diagrams are grouped into
Input diagrams: used mainly for sanity checking your settings for the input pulsesMode diagrams: display various calculated mode propertiesOutput diagrams: display various outputs based on the form settingsVariation diagrams: produce diagrams where one of the system parameters is varied in a certain range. For example, you may vary a pump wavelength to see what effect that has on the amplifier performance.
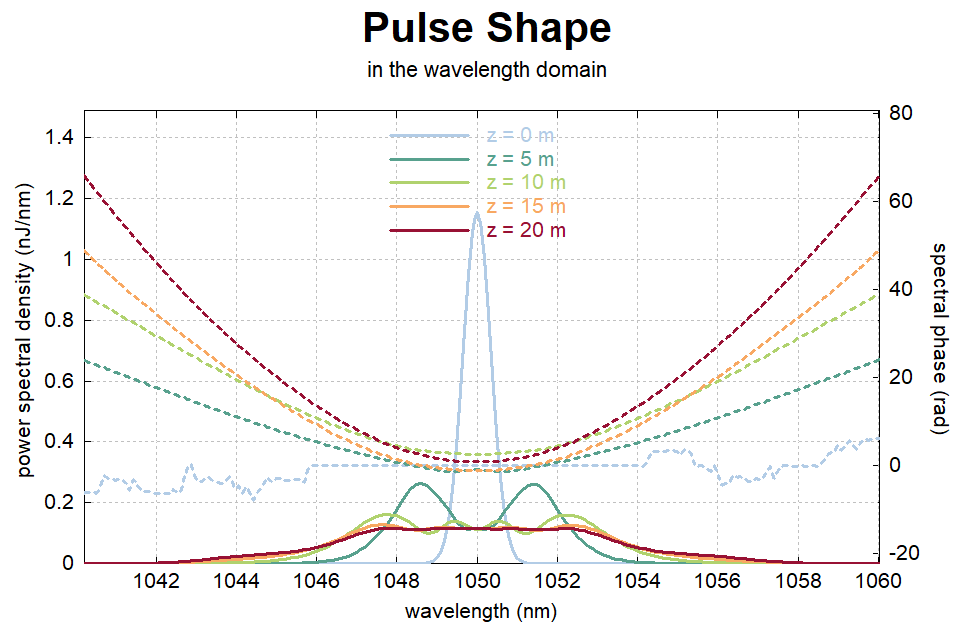
As an example, some diagrams show the pulse in the time or frequency domain at multiple locations inside the fiber:

We can also display spectrograms:

Another possibility is a color diagram for the evolution of the temporal or spectral shape along the fiber:

One can also show how various pulse parameters evolve along the fiber:

Case Studies
The following case studies are available, where we used this Power Form:

Nonlinear Pulse Compression in a Fiber
We explore how we can spectrally broaden light pulses by self-phase modulation in a fiber and subsequently compress the pulses using a dispersive element. A substantial reduction in pulse duration by more than an order of magnitude is easily achieved, while the pulse quality is often not ideal.
#pulses#nonlinearities
See also: overview of Power Forms