RNA-seq analysis of prostate cancer in the Chinese population identifies recurrent gene fusions, cancer-associated long noncoding RNAs and aberrant alternative splicings (original) (raw)
Introduction
Prostate cancer remains the most frequently diagnosed cancer and the third leading cause of cancer-related death in men in developed countries1. The incidence of prostate cancer is increasing worldwide but varies remarkably among races and countries1,2,3. The highest incidence is found in the Western countries such as the United States, whereas the lowest incidence is found in the East Asian countries such as China, which may partly be due to genetic differences among the different races. A recent Genome-Wide Association Study (GWAS) identified five new susceptibility loci for prostate cancer in the Japanese population, which highlights the genetic heterogeneity of prostate cancer susceptibility among different ethnic populations4. However, the vast majority of studies of genome-wide alterations in prostate cancer have been performed using patients from Western countries, and few studies have been performed among Asian populations. Moreover, prostate cancer is a heterogeneous disease. Individual tumors vary widely in evolution and behavior (i.e., tumor dormancy, local growth, distant dissemination, treatment response, and relapse). Thus, individuals who share the same histopathological stages, grades and Gleason scores, and receive the same treatments could have tumors with completely different evolutionary histories and clinical outcomes. Furthermore, some patients with an indolent and non-aggressive tumor confined to the prostate can live over 10 years, whereas others die from metastatic disease within 2-3 years after diagnosis. Many lines of evidence have suggested that the heterogeneous clinical behavior of prostate cancer is the result of different underlying molecular mechanisms during tumor progression5,6,7.
Over the past decade, DNA and RNA microarrays have been invaluable tools for the deconvolution of complex biological mechanisms, resulting in a new understanding of prostate cancer pathogenesis and providing a foundation for the generation of new biomarkers for diagnosis, prognosis and the prediction of therapeutic responses8,9,10,11,12,13. Although microarray-based studies have contributed significantly to our understanding of the development and progression of human cancer, these technologies have several major limitations, including their inability to detect structural genomic aberrations and base mutations. The rapid development of next-generation sequencing (NGS) technologies has overcome many of these problems14,15,16,17. NGS permits the investigation of an entire cancer genome and transcriptome with unprecedented resolution and throughput7,18,19,20. In 2008, the first whole cancer genome sequence was reported, which compared the DNA sequence from an acute myeloid leukemia with that from normal skin from the same patient21. Since then, whole-genome sequencing has been used to identify a wide range of genomic alterations, including nucleotide substitutions, structural rearrangements and copy number alterations in lung, breast, prostate and pancreatic cancers, ovarian clear cell carcinoma, leukemia and melanoma22,23,24,25,26,27,28,29. Second-generation sequencing of the transcriptome (RNA-seq) is a sensitive and efficient method for detecting gene fusions, somatic mutations and alternatively spliced forms17. A comparison of fluorouracil-resistant and -nonresistant human colorectal cancer cell lines revealed a global disruption of splicing in the fluorouracil-resistant cells, which was characterized by the expression of new mRNA isoforms resulting from exon skipping, alternative splice site usage and intron retention30. Novel somatic mutations were discovered by RNA-seq in granulose cell tumors of the ovary and endometriosis-associated ovarian carcinomas31,32. Researchers have used paired-end RNA-seq to comprehensively elucidate gene fusion products in cancer transcriptomes33,34,35. These preliminary studies have led to the comprehensive discovery of novel alterations in the cancer genome and new insights into the pathogenesis of cancer.
Although previous studies have comprehensively evaluated prostate cancer gene fusions by RNA-seq, none of these studies were performed with an Asian population. While RNA-seq permits the simultaneous analysis of gene expression, noncoding RNA (ncRNA) expression, alternative splicing (AS), somatic mutations and gene fusions, no systematic analyses of prostate cancer transcriptomic data have been reported. In this study, we analyzed the transcriptomes of 14 pairs of prostate cancer and adjacent normal tissues in the Chinese population by RNA-seq. RNA-seq simultaneously reveals multiple aspects of the transcriptome, including gene fusions, AS, the expression of long ncRNAs and genes, and somatic mutations. We found that two novel gene fusions, CTAGE5-KHDRBS3 (20/54=37%) and USP9Y-TTTY15 (19/54=35.2%), occur quite frequently in Chinese patients, while surprisingly, the well-known TMPRSS2-ERG fusion appeared at a much lower frequency (21.4%) than in Caucasian patients. Furthermore, we characterized the global transcriptional changes of long ncRNAs and ASs in prostate cancer samples by comparing them with their adjacent normal tissues, and we identified numerous long ncRNAs and ASs whose expressions are associated with this disease. Our study unraveled a complex landscape of genomic alterations in prostate cancer, which confirmed the concept of prostate cancer heterogeneity and advanced our understanding of this disease in the Chinese population.
Results
RNA-seq human prostate cancer transcript catalog
To gain insight into the molecular pathogenesis of prostate cancer in the Chinese population, we searched for genetic alterations using RNA-seq in 14 prostate cancer samples and their matched adjacent normal tissues (Supplementary information, Table S1). We generated an average of 66 432 064 (range: 60 055 552-73 055 726) reads and 5.98 (range: 5.40–6.58) gigabases of sequenced nucleotides per sample (Supplementary information, Table S2). Using the short oligonucleotide analysis package (SOAP) aligner (SOAP2)36, we mapped an average of 84.40% (range: 79.70–88.52%) of the reads to the human genome (UCSC version hg18). By comparing the transcriptome sequences of the cancer tissues with those of their matched normal tissues (Supplementary information, Figure S1), we identified a range of gene fusions (from 1 to 6), differentially expressed long ncRNAs (from 200 to 617), AS events (from 2 826 to 12 651), and differentially expressed genes (from 2 207 to 5 503) that occurred in each prostate cancer (Table 1). In addition, we also found an average of 1 725 (range: 664-2 544) point mutations per cancer sample (Table 1). These results revealed a variety of genetic changes among prostate cancers.
Table 1 Summary of data from RNA-seq for 14 pairs of prostate cancer and adjacent normal tissues
Gene fusion landscape in prostate cancer
Transcriptome analysis has been successfully used to identify gene fusions in prostate cancer35,37,38. To identify gene fusions in Chinese patients, we searched paired-end reads in which the two ends mapped to different genes or reads containing sequences from two different genes in the transcriptome. A total of 83 different gene fusions were identified in the prostate cancer or their adjacent normal tissues (Supplementary information, Table S3). Of these, 37 novel gene fusions and 1 previously well-known gene fusion were found only in the prostate cancer tissues. These fusions were defined as tumor-specific gene fusions. The number of gene fusions in each tumor ranged from 1 to 6 (Table 1 and Supplementary information, Table S3). The most frequent fusions were TMPRSS2-ERG and USP9Y-TTTY15. Each was separately found in 3 of the 14 prostate cancer tissues (Figure 1 and Supplementary information, Table S3). Consistent with previous reports37, the TMPRSS2-ERG fusion was located between exon 1 of TMPRSS2 and exon 4 of ERG in all three prostate cancers (Figure 1B), as confirmed by RT-PCR specific for the fusion and Sanger sequencing (Figure 1D). We used RT-PCR to further investigate this fusion in an additional panel of 54 prostate tumors that were obtained from three independent sources (Supplementary information, Table S1). The TMPRSS2-ERG fusion was present in 10 prostate tumor tissues but not in the matched normal tissues (Figure 1E). The frequency (10/54=18.5%) was similar to that found by RNA-seq (3/14=21.4%) and much lower than that reported in previous studies undertaken in Caucasian patients (about 50%)37,39,40. These results suggest racial differences in the prevalence of the TMPRSS2-ERG fusion.
Figure 1
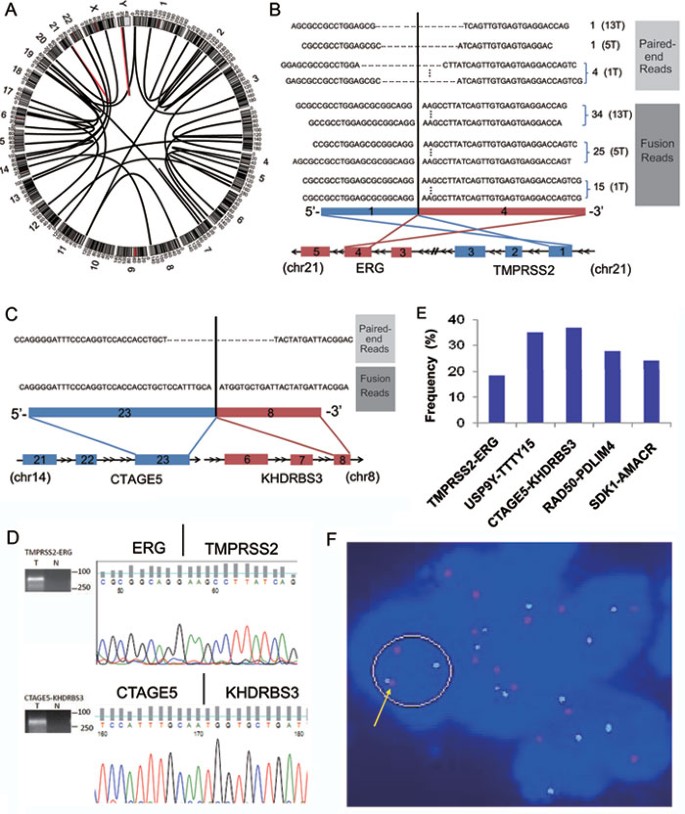
The landscape of gene fusions in prostate cancer. (A) A Circos plot of the genomic landscape of gene fusions discovered by RNA-seq in the 14 prostate cancer samples. The outer ring shows chromosome ideograms. The gene fusions are shown as arcs linking the two genomic loci, each colored according to the frequency with which the gene fusion was found in the 14 prostate cancer samples (red=3 and black=1). (B) TMPRSS2-ERG fusion in three prostate cancers. The TMPRSS2-ERG fusion was between exon 1 of TMPRSS2 (red) and exon 4 of ERG (blue). The number of reliable pair-end and fusion spanning reads in each sample is indicated to the right of each read. The sample ID is indicated in brackets. (C) The CTAGE5-KHDRBS3 fusion in one prostate cancer is revealed by one paired-end and one fusion-spanning read. The CTAGE5-KHDRBS3 fusion was between exon 23 of CTAGE5 (blue) and exon 8 of KHDRBS3 (red). (D) Representative experimental validation of the fusion gene transcript by RT-PCR and Sanger sequencing. (E) Prevalence of the TMPRSS2-ERG, USP9Y-TTTY15, CTAGE5-KHDRBS3, RAD50-PDLIM4, and SDK1-AMACR fusions in prostate cancer. (F) Interphase FISH on formalin-fixed, paraffin-embedded tissue confirming the fusion of SDK1 and AMACR. Probes for SDK1 (red) and AMACR (green) demonstrate the fusion of the genomic loci (yellow arrows) in cancerous cells.
The fusion between exon 3 of USP9Y and exon 3 of TTTY15, which produces the fusion transcript USP9Y-TTTY15 (Supplementary information, Figure S2), was present at a frequency (3/14=21.4%), which is similar to that of the TMPRSS2-ERG fusion in prostate tumors profiled by RNA-seq. Most importantly, the USP9Y-TTTY15 fusion was also found by RT-PCR in 19 of 54 (35.2%) additional prostate cancer tissues (Figure 1E). This translocation has not been previously reported, but its high prevalence in this study suggests that it may play an important role in prostate cancer development in the Chinese population, a possibility that will be explored in future studies. Interestingly, the USP9Y-TTTY15 fusion transcript did not seem to have any open reading frames (ORF) based on ORF prediction tools such as 'Six-Frame Translation', indicating that it may be a ncRNA.
Three additional novel gene fusions were validated and examined in an additional panel of 54 prostate cancers (Supplementary information, Figure S3). We found that the prevalence of the CTAGE5-KHDRBS3, SDK1-AMACR, and RAD50-PDLIM4 gene fusions is 37% (20/54), 24.1% (13/54), and 27.8% (15/54), respectively (Figure 1E), suggesting that these gene fusions may play a causal role in prostate cancer. To confirm that the SDK1-AMACR fusion exists in the genome, we used interphase FISH. Using probes 3′ to SDK1 and 5′ to AMACR, we identified the SDK1-AMACR fusion in a prostate cancer sample, which was validated by an RT-PCR specific for the fusion and Sanger sequencing (Figure 1F).
Transcriptional landscape of long ncRNAs in prostate cancer
Several studies have demonstrated that long ncRNAs, such as HOTAIR, contribute to cancer development and progression41. We analyzed the global human long ncRNA transcription profiles of the 14 prostate cancer samples and their matched normal tissues, and found that an average of 1 599 known long ncRNAs (range: 1 196-1 814) were expressed in each tissue (Table 1). Next, we compared the long ncRNA expression levels between the 14 prostate cancer samples and their matched normal tissues, and identified an average of 406 long ncRNAs (range from 200-617) that were significantly differentially expressed in prostate cancer (≥ 2-fold and FDR ≤ 0.001), including prostate cancer antigen 3 (PCA3, also known as DD3) and prostate-specific transcript 1 (PCGEM1), the overexpression of which has been recently shown to be associated with prostate cancer development42,43 (Table 1 and Supplementary information, Table S4). A total of 137 long ncRNAs were found to be consistently upregulated or downregulated in more than 50% of prostate cancers (Figure 2A).
Figure 2
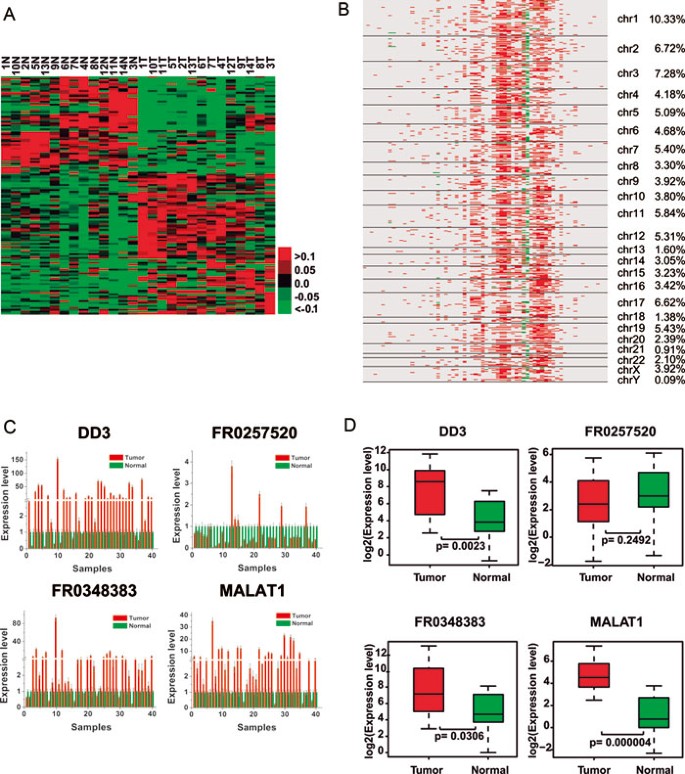
Transcriptional landscape of human long ncRNAs in prostate cancer. (A) Supervised hierarchical clustering analysis using 137 long ncRNAs that were consistently upregulated or downregulated in more than 50% of the prostate cancer samples (≥ 2-fold and FDR ≤ 0.001). Shades of red and green are used to illustrate whether the expression value is above (red) or below (green) the mean expression value across all samples (each row in the data was normalized from −1 to +1). (B) Correlation heatmap between the expression of long ncRNAs and genes. Rows represent genes aligned according to their chromosomal locations, and the columns represent differentially expressed long ncRNAs. A red color indicates a positive correlation, whereas green bars represent a negative correlation (absolute correlation coefficient |R| ≥ 0.85, FDR ≤ 0.01). (C) qRT-PCR assessed the expression levels of DD3, FR0257520, FR0348383, and MALAT1 in the additional set of 40 pairs of prostate cancer and adjacent normal tissues. (D) Comparison of the expression levels of DD3, FR0257520, FR0348383, and MALAT1 between prostate cancer and normal tissues by qRT-PCR.
Because most studies have demonstrated that long ncRNAs are involved in transcriptional regulation41,44,45,46, we explored the effect of changes in the expression of the 137 long ncRNAs on the expression of genes in prostate cancer. To do so, we analyzed the correlation between the expression of each long ncRNA and all genes. Using an absolute correlation coefficient cutoff of greater than 0.85 and an FDR less than 0.01, we found a set of highly correlated genes (Figure 2B and Supplementary information, Table S5). Interestingly, we found that while a set of 23 long ncRNAs was significantly associated with hundreds of genes across the whole genome, the rest were either correlated with few or no genes (Figure 2B and Supplementary information, Table S5). These data suggests that many long ncRNAs may have functions other than transcriptional regulation. Surprisingly, almost all of the significant correlations between long ncRNA and gene expression were positive except for two long ncRNAs, FR0168790 and FR0350918.
To investigate the association between long ncRNAs and prostate cancer, we selected four long ncRNAs (two known long ncRNAs: DD3 and MALAT1; and two novel long ncRNAs: FR0257520 and FR0348383) and examined their expression in two sets of prostate tissues using quantitative RT-PCR (qRT-PCR). The first set included 40 pairs of prostate cancers and their adjacent normal tissues, and the second set was comprised of prostate tissues from 15 normal individuals and 15 patients with prostate cancer. There was a strong correlation between the qRT-PCR and RNA-seq data (Supplementary information, Figure S4). Consistent with the RNA-seq results, PCA3, FR0348383 and MALAT1 overexpression was found in 80% (32/40), 72.5% (29/40), and 82.5% (33/40) of the prostate cancers respectively, whereas decreased FR0257520 expression was found in 82.5% (33/40) of the prostate cancers (Figure 2C and 2D).
Mutational landscape in prostate cancer
An average of 1 725 (range: 664-2 544) tumor-specific point mutations were identified in each prostate cancer sample. However, only a small proportion (average 1.5% and range: 0.35%-5.88%) of these mutations were found within the coding regions of the genes (Figure 3A and Supplementary information, Table S6). Most (91.7%) of the substitutions were T:A to C:G (Figure 3B). One plausible explanation for this finding is that this type of point mutation occurred during RNA editing because RNA editing specifically changes adenosine (A) to inosine (I), which, in turn, is read as guanosine (G)47.
Figure 3
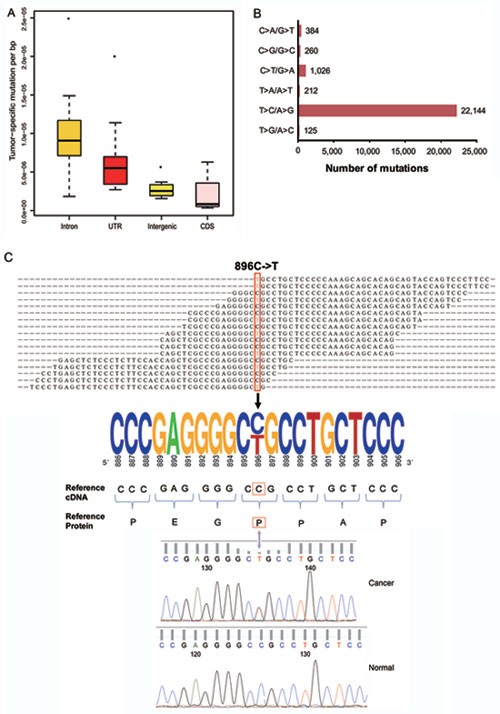
The landscape of somatic mutations in prostate cancers. (A) The distribution of somatic mutations among different locations in the genome. (B) The frequencies of different substitutions. (C) Validation of a somatic mutation in CHAF1A. The mapped reads are shown in the top panel. The mutated residue is highlighted by a red box. An electropherogram of the Sanger sequencing validation of the mutation and its surrounding nucleotides is shown in the bottom panel.
A total of 309 point mutations were identified within the coding regions of 290 genes. Of these mutations, 115 were silent, 181 were missense, and 13 were nonsense (Supplementary information, Table S7). None of the mutations was found in more than one cancer sample, indicating that there was no hotspot mutation in the subset of 14 prostate cancer samples in this study. However, we found that three samples had mutations in different locations of the UTP14C gene and four genes (i.e., CBARA1, FRG1, NAMPT, and ZNF195) were mutated in two samples (Supplementary information, Table S8). We randomly selected 30 of the 309 point mutations for validation. A total of 29 of these mutations were confirmed at the cDNA level using RT-PCR followed by Sanger sequencing. We further confirmed 27 of these by performing PCR of their corresponding genomic DNA, followed by Sanger sequencing (Figure 3C and Supplementary information, Table S8).
The landscape of AS in prostate cancer
It is becoming clear that AS plays an important role in the development of the pathophysiology of many human cancers48,49. We used SpliceMap to detect splice junctions and then applied different criteria to detect different types of AS, including exon skipping, intron retention, and alternative 5′ and 3′ splice sites. First, we identified all ASs in all 28 transcriptomes. Then, we tried to find AS events that were present only in the tumor and not in the adjacent normal sample (Supplementary information, Table S11). Of the thousands of AS events that were identified in the prostate cancers, we obtained a list of highly reliable AS events based on non-redundant reads, which are summarized in Figure 5A and Supplementary information, Table S12. Intron 4 retention in KLK3 (also known as PSA) was found in 57.1% (8/14) of prostate cancers (Figure 4A, 4B and Supplementary information, Table S9), which may result in a new protein sequence. Both the alternatively spliced transcript and protein may serve as new potential diagnostic biomarkers for this disease. Exon skipping in AMACR was found in 28.6% (4/14) of the prostate cancers (Figure 4A and 4C). Both predicted AS events were confirmed by RT-PCR of the samples in the discovery set (Figure 4D). We also examined these two ASs in an additional 40 pairs of samples by RT-PCR. We found KLK3 intron retention in 26 of 40 prostate cancers (Supplementary information, Figure S5) and AMACR exon skipping in 14 of 40 prostate cancers (Supplementary information, Figure S5).
Figure 5
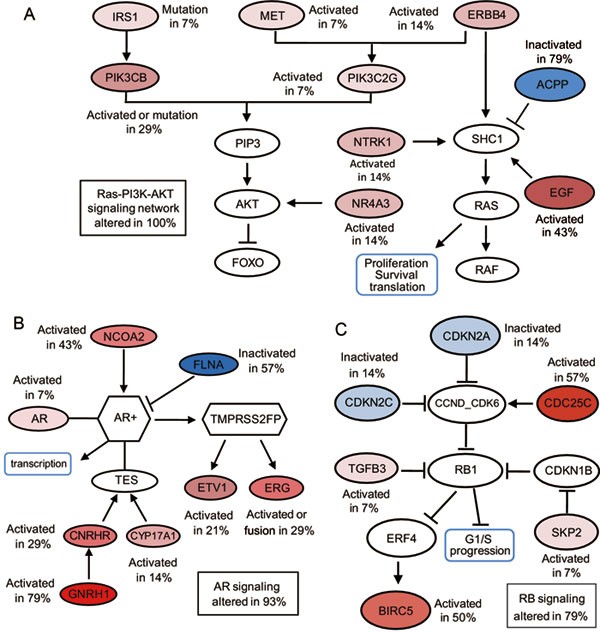
Three major signaling pathways are altered in prostate cancers. (A) Genes altered in the RAS-PI3K-AKT pathway. (B) Genes altered in the AR signaling pathway. (C) Genes altered in the RB signaling pathway. The activated genes are colored in a red gradient, and the inactivated genes are colored in a blue gradient according to the percentage of alterations in the 14 prostate cancer samples. The darker the color, the greater the percentage.
Figure 4
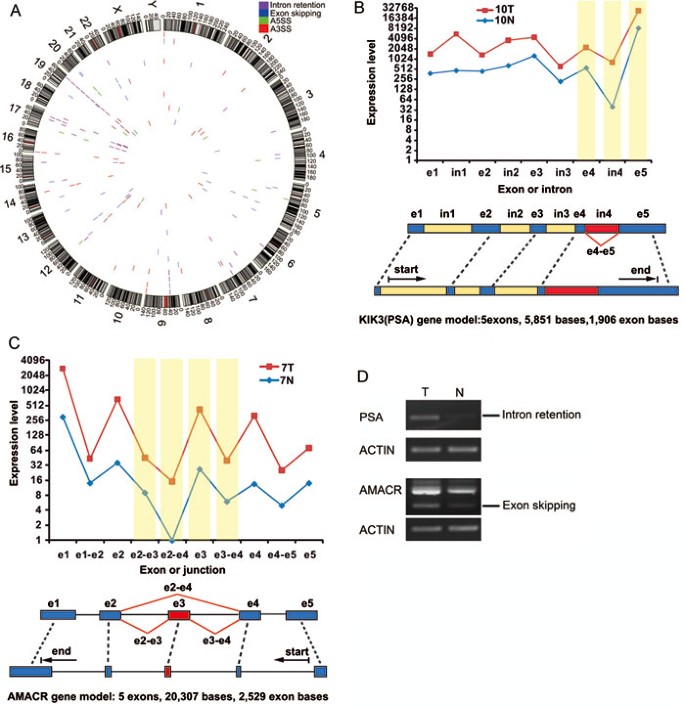
The landscape of alternative splicing in prostate cancer. (A) A Circos plot showing the genomic landscape of AS events in the 14 prostate cancer samples discovered by RNA-seq. The outer ring shows chromosome ideograms. The bars along each inner ring represent AS events in a prostate cancer sample. (B) An example of RNA-seq data indicative of intron retention in the KLK3 (PSA) gene. The line plot displays the expression of each exon (e1, e2, etc.) and intron (in1, in2, etc.), and alternative expression events are highlighted in yellow. (C) An example of RNA-seq data indicative of exon skipping in the AMACR gene. The line plot displays the expression of each exon (e1, e2, etc.) and exon junction (e1-e2 and others), and alternative expression events are highlighted in yellow. (D) Validation of KLK3 intron retention and AMACR exon skipping by RT-PCR. A pair of primers was designed to detect only KLK3 intron retention.
Defining core pathway alterations in prostate cancer in the Chinese population
To understand the impact of the above-mentioned genetic alterations in prostate cancer, we mapped the genes that were involved in gene fusions, point mutations, differential expression, or tumor-specific ASs in our study to major deregulated pathways as described by Taylor et al.7 using a website (http://cbio.mskcc.org/cancergenomics/prostate/pathways/). Novel gene pathway information was obtained from a website (http://www.pathwaycommons.org/pc/home.do). Based on the literature, we defined a gene as activated when it was overexpressed in a tumor or a well-established oncogene, or as an inactivated gene when it was downregulated in a tumor or a well-established tumor suppressor. We calculated the frequency of each activated or inactivated gene in the 14 samples. A pathway was considered altered if one or more genes in the pathway had a point mutation, fusion, differential expression, or a tumor-specific AS. Similar to findings in Caucasian populations7, the most frequently affected pathways are AR, Ras-PI3K-AKT and RB (Figure 5).
Discussion
Prostate cancer and other cancers are genetic diseases that are caused by a series of genetic alterations. Therefore, a more detailed genetic characterization will provide a better understanding of these diseases and facilitate the development of new personalized therapeutic strategies. In addition, there are remarkable disparities in the prostate cancer incidence and outcome of patients from different races, particularly between Western (Caucasian) and Eastern (Asian) populations1,50. However, even though the genetic profiles of prostate cancer in Caucasian patients have been studied intensely, few such studies have been performed in Asian patients4. In this study, we sought to address the disparities in incidence and outcome by analyzing 14 paired normal and prostate cancer tissues in the Chinese population using RNA-seq. This study also reveals, for the first time, multiple transcriptomic aspects of prostate cancer, including gene fusions, ASs, long ncRNA expression and somatic mutations. With these data, we have demonstrated significant heterogeneity among the transcriptomes of different patients with prostate cancer. The integrated analysis of these different genetic alterations demonstrated that the major pathways involved in prostate cancer development in the Chinese population are similar to those in Caucasians, although the pathway components are different7. Notably, the prevalence of gene fusions is dramatically different.
In addition to the previously well-known TMPRSS2-ERG fusion in prostate cancer, we have identified 37 new gene fusions, none of which have been reported in any previous Caucasian population study35,37,39,51. It should be noted that the frequency of the TMPRSS2-ERG fusion was about 19.1% (13/68) in Chinese patients, and this was similar for patients from three different cities. However, this frequency was significantly lower than that previously reported for patients from Western countries with prostate cancer (∼50%). This variation may be due to genetic background differences, environmental influences, or both. It would be interesting to investigate the frequency of TMPRSS2-ERG fusion in prostate cancers from the Chinese population living in the United States. The fusion between the USP9Y and TTTY15 (USP9Y-TTTY15) genes on the Y-chromosome was the other most frequent fusion discovered by RNA-seq. USP9Y encodes a protein similar to ubiquitin-specific proteases, whereas TTTY15 is a ncRNA. Deletion or mutation of USP9Y has been linked to male infertility52,53. However, none of the former studies demonstrated that either of these two genes is associated with tumorigenesis. We have also found that this fusion results in a potential loss of function of the USP9Y gene and a novel noncoding fusion transcript. The high recurrence of this fusion in both the discovery and additional prostate cancer samples indicates that it may play a significant role in prostate cancer. We have investigated whether the other novel fusion transcripts contain ORFs based on ORF prediction analysis (Supplementary information, Table S3). In addition to USP9Y-TTTY15, we found that two additional fusion transcripts (PHF17-SNHG8 and DYRK1A-CMTM4) are ncRNAs. Through bioinformatic analysis, we found that the fusion transcripts from USP9Y-TTTY15 and PHF17-SNHG8 are ncRNAs because TTTY15 and SNHG8 are ncRNAs.
The other three novel gene fusions, CTAGE5-KHDRBS3, SDK1-AMACR, and RAD50-PDLIM4, occurred at high frequencies in the patients, suggesting potential causal roles in prostate cancer. Collectively, these findings highlight the differences in the prevalence of gene fusions in prostate cancers from different ethnic populations and support the notion that genomic rearrangements may be influenced by environmental factors54,55,56.
It is intriguing to find gene fusions in normal prostatic tissue. Because the normal DNAs were obtained from histopathologically normal tissues that were adjacent to the tumor, certain genetic changes, such as gene fusions and point mutations, may have occurred. However, in comparison to the tumor tissue, these changes occurred relatively late and have not yet resulted in a fully developed pathological tumor. We also cannot exclude the possibility that some of these changes occur randomly during normal prostate development and never lead to tumor initiation or progression. Because they are only passive or silent events, these fusions will be difficult to be found in other tumors. If the above-mentioned changes have the potential for tumor development, they would be found in other tumors. To examine this possibility, we analyzed 54 additional prostate cancer tissues by PCR for the presence of some of these gene fusions. Indeed, some gene fusions did occur in other tumors (data not shown). Based on these data, additional investigation is warranted.
Recently, a number of studies have shown that long ncRNA expression can be deregulated in human cancers41,42,43,44. While our manuscript in preparation, two systematic studies characterizing long ncRNA expression patterns were published57,58. To our knowledge, our study is the first to address the deregulation of long ncRNAs in human cancers using RNA-seq in the Chinese population, and we found some differences between these two previous reports and our data. Further studies are warranted to define the reason for these differences. We have identified 200-617 long ncRNAs in each patient that were either overexpressed or underexpressed. Among them, 137 were consistently upregulated or downregulated in more than 50% of the samples, including DD3, PCGEM1 and MALAT1. The overexpression of DD3 and MALAT1 was further evaluated by qPCR in the discovery screen and two additional sample sets. The overexpression of DD3 is consistent with several previous studies showing that DD3 may be a potential and promising diagnostic biomarker for prostate cancer42; however, this is the first time that MALAT1 overexpression was identified and found to occur at a high frequency in prostate cancer. Further study will be required to validate whether MALAT-1 may be a novel biomarker and therapeutic target for prostate cancer. Based on the correlation analysis between long ncRNA and gene expression, we found that most of the long ncRNAs are positively associated with gene expression, which is consistent with recent findings that long ncRNAs can activate gene expression in an enhancer-like manner in human cells59. We have categorized the long ncRNAs into three groups. The first group of long ncRNAs was significantly correlated with hundreds of genes in the genome. However, the second group of long ncRNAs was correlated with only a few genes and the third group was not correlated with any genes. The first group may function in transcriptional regulation, whereas the second and third groups may be involved in other functions.
We also identified 183 genes that were mutated in prostate cancers; however, most of these were 'hills' mutations (or low-frequency mutations). This is consistent with the findings by Taylor et al. for 138 genes7. The validation of the mutations in 30 genes demonstrated that the accuracy of detecting mutations by RNA-seq was 96.7% and 90% at the cDNA and genomic levels, respectively, in this study. The mutation of KLK3 (PSA) was found in one sample. Surprisingly, none had a mutation in P53 or PTEN, which are the top two prostate cancer genes listed in the database of the Catalogue of Somatic Mutations in Cancer (COSMIC) (http://www.sanger.ac.uk/genetics/CGP/cosmic/). Although most of the mutated genes have not been previously reported in prostate cancer, 118 have been found in other cancers listed in the COSMIC database, suggesting that the mutation of these genes may also play a causal role in prostate cancer.
AS events have been linked to prostate cancer development and progression60. This study has cataloged numerous AS events in prostate cancer. Most encouragingly, PSA intron retention was found in most of our prostate cancer cohorts but not in their normal adjacent tissues. PSA is one of the few biomarkers routinely used for diagnosis. However, the currently available PSA-based screening methods show only modest accuracy61. The detection of the newly discovered PSA intron retention here may become an important supplementary approach for improving the sensitivity and specificity of this biomarker.
In conclusion, we have used the recently developed NGS technology to profile the transcriptomes of prostate cancers and matched normal tissues from 14 Chinese patients with prostate cancer. We also validated our major findings, including gene fusions, long ncRNAs and AS, in additional patient samples. The findings in this study have provided new insight into the pathogenesis of prostate cancer in the Chinese population, thus opening new potential avenues to conquer this deadly disease. Further evaluation of our discoveries is warranted.
Materials and Methods
Patients and samples
Prostate cancer and adjacent normal tissues from 14 patients obtained from Shanghai Changhai Hospital were selected as a discovery cohort for RNA sequencing. The set of 54 tumor samples for gene fusion validation included 23 from Shanghai Changhai Hospital, 17 from Jiangsu Provincial People's Hospital and 14 from The Third Affiliated Hospital of Zhongshan (Sun Yat Sen) University. The set of 40 pairs of prostate cancer and adjacent normal tissues for splicing and long non-coding RNA validation were collected from Shanghai Changhai Hospital. The second set of samples for long non-coding RNA validation consisted of 15 tumors and 15 BPH from Jiangsu Provincial People's Hospital and Shanghai Changhai Hospital, respectively. Detailed information for the discovery and validation sets is summarized in Supplementary information, Table S1. The protocols for RNA-sequencing and subsequent experiments were approved by the institutional review boards of the three hospitals. Written informed consent was obtained from all patients for research using these tumor samples.
Pathological review
H&E (hematoxylin and eosin stained) slides of frozen human tumor tissues with patient-matched frozen normal tissues were examined by the pathologists of this study to ensure that the tumor tissues selected had high-density cancer foci (> 80%) and that the normal tissues were without tumor contamination. All samples were independently reviewed by an additional gynecologic pathologist. Negotiations were made to settle disagreements.
cDNA library preparation and sequencing
Beads containing oligo (dT) were used to isolate poly(A) mRNA from total RNA. Purified mRNA was then fragmented in fragmentation buffer. Using these short fragments as templates, random hexamer-primers were used to synthesize the first-strand cDNA. The second-strand cDNA was synthesized using buffer, dNTPs, RNase H and DNA polymerase I. Short double-stranded cDNA fragments were purified with a QIAquick PCR extraction kit (vendor) and eluted with EB buffer for end repair and the addition of an 'A' base. Next, the short fragments were ligated to Illumina sequencing adaptors. DNA fragments of a selected size were gel-purified and amplified by PCR. The amplified library was sequenced on an Illumina HiSeq™ 2000 sequencing machine. The details of the experiment are as follows: Expected library size: 200 bp; Read length: 90 nt; and Sequencing strategy: paired-end sequencing. The library size and read-length are found in Supplementary information, Table S2.
Raw read filtering
The images generated by the sequencers were converted into nucleotide sequences by a base-calling pipeline. The raw reads were saved in the fastq format, and we removed the dirty raw reads prior to analyzing the data. Three criteria were used to filter out dirty raw reads: Remove reads with sequence adaptors; Remove reads with more than 2% 'N' bases; Remove low-quality reads, which have more than 50% QA ≤ 15 bases. All subsequent analyses were based on clean reads.
Mapping reads to the human genome and transcriptome
The reference sequences used were genome and transcriptome sequences downloaded from the UCSC website (version hg18). Clean reads were respectively aligned to the reference genome and transcriptome using SOAP236. No more than 3 mismatches were allowed in the alignment for each read.
Normalization of gene and long non-coding RNA expression levels
Reads that could be uniquely mapped to a gene were used to calculate the expression level. The gene expression level was measured by the number of uniquely mapped reads per kilobase of exon region per million mappable reads (RPKM). The formula was defined as below:

in which C was the number of reads uniquely mapped to the given gene; N was the number of reads uniquely mapped to all genes; L was the total length of exons from the given gene. For genes with more than one alternative transcript, the longest transcript was selected to calculate the RPKM. The RPKM method eliminates the influence of different gene lengths and sequencing discrepancies on the gene expression calculation. Therefore, the RPKM value can be directly used for comparing the differences in gene expression among samples. The same strategy was applied to calculate the expression levels of non-coding RNAs.
Differentially expressed gene analysis
Using “The significance of digital gene expression profiles”62, we identified differentially expressed genes between paired tumor and normal samples based on the following criteria: FDR ≤ 0.001 and fold change ≥ 2.
Detecting human gene fusions
During the short RNA read alignment to the reference genome, some reads could only be aligned when they were divided into two segments. Such an alignment is called a two-segment alignment. The alignments of the divided reads were required to meet the following criteria: a) The length of the shorter segment was at least 8 bp; b) We checked the boundary of the alignment to make sure that the intron boundary was always one of three canonical bounds, i.e., “GT-AG” “GC-AG” and “AT-AC”. Note that no matter where the intron is derived (from 5' to 3', positive or negative strand), the boundaries are always the same; however, the positive DNA strand was used as our reference. Hence, for the boundary of an intron on the negative strand that was bound with “GT-AG”, the two corresponding nucleotides on the positive strand should be “CT-AC”.
For both alignments of the two segments, we allowed at most one mismatch and ungapped alignment. Based on the information from the two segment alignments, we next used a Perl script to retrieve fusion sites. Fusion was deemed to exist if the fusion site was located in known exon boundaries from two different genes and there was at least one paired-end read to support it, as illustrated in Supplementary information, Figure S6.
Differentially expressed long non-coding RNA analysis
First, we downloaded the ncRNA database from http://www.ncrna.org/frnadb/download; removed the ncRNAs smaller than 200 nt, zRNAs and non-human RNAs; and acquired 2 981 long non-coding RNAs. We then used this database to calculate the expression level of long non-coding RNAs. The differentially expressed long non-coding RNAs between the paired normal and prostate cancer samples were identified based on the following criteria: FDR ≤ 0.001 and fold change ≥ 2. The list of long non-coding RNAs that were consistently upregulated or downregulated in more than 50% of the samples were selected to perform supervised clustering.
Supervised clustering analysis
Hierarchical clustering of the gene and long non-coding RNA expression profiles were performed using cluster 3.063. We subtracted the mean of the long non-coding RNA expression levels in the 14 paired samples, normalized each row (gene) in the data so that the sum of the squares of the values in each row is 1.0, calculated the distance using Pearson correlation, and then used a pairwise average-linkage hierarchical clustering method for clustering. The results were visualized by Java Treeview64.
Correlation analysis of long non-coding RNAs and genes
We used the list of long non-coding RNAs that were consistently upregulated or downregulated in more than 50% of the samples to analyze their correlation with all of the genes detected in prostate tumor tissues. The expression level (RPKM) of long non-coding RNAs and genes in each tumor tissue was used to calculate the correlation coefficient R. We first used the Pearson method to calculate the correlation coefficient R and FDR between each long non-coding RNA and gene, and we then used FDR ≤ 0.01 and the absolute value of R ≥ 0.85 as the threshold to judge the significance of correlation between the long non-coding RNAs and genes. We acquired 66 long non-coding RNAs and 3 185 genes and performed clustering for these long non-coding RNAs with the significant correlation value (significant correlation was set at 1 while non-significant was 0). The absolute value of the Pearson correlation was used to calculate the distance of long non-coding RNAs, and the pairwise average-linkage method was used to perform hierarchical clustering.
Detection of SNP and tumor-specific point mutations
We used SOAPsnp to detect SNPs65. This program is a resequencing utility that can assemble consensus sequences for the genome of a newly sequenced individual based on the alignment of the sequencing reads on the known reference. The SNPs can then be identified on the consensus sequence by comparison with the reference.
Several filtering steps were performed to reduce the false positives of SNP detection generated by SOAPsnp, including the removal of SNPs whose consensus quality was lower than 20, SNPs located within 5 bp of the splice donor sites, and SNPs without the support of at least two spanning reads. To find novel SNPs, we further filtered SNPs that were reported in six major SNP databases (i.e., YH, 1 000 genomes, Yoruba, Korean, Watson and NCBI dbSNP).
After SNP filtering, we used a single SNP site detected in the tumor tissue and searched for its pair in the normal sample to ensure that this site was covered (sequencing depth of at least 5) in the sequencing and that its consensus nucleotide was the same as the reference genome. SNPs that met these criteria were defined as tumor-specific point mutations.
Detection of alternative splicing
Alternative splicing (AS), which occurs as a universal phenomenon in eukaryotes, leads to the generation of different mRNA transcripts, and the resulting mRNAs may be translated into different protein isoforms66,67,68. The pipeline we used for detecting alternative splicing events includes two main steps: 1) We used SOAPsplice 1.1 to map the reads to the human reference sequence and report the splice junctions based on the alignment of junction reads (i.e., reads that map to the reference in two or more than two separated segments, which are supposed to be separated by an intron)69. For SOAPsplice, we used the default parameters as much as possible, and set 3 mismatches for intact alignment and at most 1 mismatch for splice alignment. 2) Based on alternative splicing mechanisms, we used both the splice junctions, including known splice junctions that are reported in RefSeq, and the mapping results to detect four basic AS events, including exon skipping, alternative 5' splice site (A5SS), alternative 3' splice site (A3SS), and intron retention.
After detecting the four types of AS events, we identified those detected in the tumor but not in the matched normal tissue as tumor-specific AS events (Table 1). For each tumor sample, we then also calculated the number of junction reads supporting the corresponding junctions for the three types of AS events (i.e., exon skipping, A3SS, A5SS) and the average depth of the retained intron for intron retention events. Because the number of each AS event was so large, we subsequently used 0.99 percent of the junction reads (i.e., the average depth of the top highly reliable AS events) to draw a Circos plot to reveal some consensus patterns (Figure 4A). Taking 1T as an example, there were 2 047 A3SS events. The junction reads supporting A3SS events ranged from 1 to 609, and its 0.99 percentile was 69. Thus, those A3SS events with junction reads ≥ 69 were retained. We then filtered the AS events that were also detected in the adjacent normal sample. Finally, we generated the list of highly reliable tumor-specific AS events for each sample.
Validation of gene fusions by RT-PCR and sequencing
Fusion candidates from RNA-seq were validated at the transcript level by RT-PCR. We designed gene-fusion specific PCR primers to flank the hypothesized fusion breakpoints. Following PCR and gel electrophoresis, all RT-PCR amplified bands were gel-excised (Qiagen QIAquick Gel Extraction kit) and subjected to Sanger sequencing. Five candidate gene fusions were confirmed using this approach.
Screening for recurrent gene fusions
After the candidate gene fusions were validated by RT-PCR, 54 additional prostate cancer samples were screened for the presence of each fusion. RNA was extracted from each of these samples, and cDNA was synthesized as described above. RT-PCR was performed using the primer pairs that were used to validate the fusions. cDNA prepared from the discovery cohort samples served as positive controls.
Experimental validation of alternative splicing by RT-PCR
Total RNA was extracted from frozen tumor and normal samples, and cDNA was synthesized from 5 μg of RNA (Qiagen QuantiTect Reverse Transcription kit). To validate alternative splicing, reverse transcriptase PCR (RT-PCR) was performed using alternative splicing-specific PCR primers in 40 pairs of tumors and adjacent normal tissues. The primers for gene fusion, long non-coding RNA and alternative splicing are listed in Supplementary information, Table S13.
Mutation validation by Sanger sequencing
Candidate base pair variants called by RNA-seq were interrogated using RT-PCR coupled with Sanger sequencing. A total of 30 protein-coding variants were randomly chosen and subjected to validation. Of these variants, 27 were present in the tumor (both cDNA and DNA) but not in the adjacent normal tissue (neither cDNA nor DNA), 2 were only present in the tumor cDNA but not in normal tissue cDNA, and 1 was not present in either the tumor or normal tissue.
Long non-coding RNA validation by qRT-PCR
qRT-PCR was performed using the Power SYBR Green MasterMix (Applied Biosystems) on an Applied Biosystems Step One Plus instrument. GAPDH primers were used as an internal control. All assays were performed in duplicate or triplicate, and results were plotted as the average fold change relative to GAPDH. All primer sequences for RT-PCR, qRT-PCR and Sanger sequencing are listed in Supplementary information, Table S10.
Fluorescence in situ hybridization
Formalin-fixed, paraffin-embedded tissue sections were used for interphase fluorescence in situ hybridization (FISH). All BACs were obtained from the BAC PAC Resource Center (Oakland, CA), and the probe locations were verified by hybridization to metaphase spreads of normal peripheral lymphocytes. To detect the SDK1-AMACR fusion, R11-80G17 (5′ to SDK1) was used with a BAC located 3′ to AMACR (RP11-664P14). FISH was performed with the help of a professional company (Beijing GP Medical Technologies, Inc., China). The detailed procedures were as previously described70.
References
- Jemal A, Bray F, Center MM, Ferlay J, Ward E, Forman D . Global cancer statistics. CA Cancer J Clin 2011; 61:69–90.
Article Google Scholar - Sim HG, Cheng CW . Changing demography of prostate cancer in Asia. Eur J Cancer 2005; 41:834–845.
Article Google Scholar - Jemal A, Siegel R, Xu J, Ward E . Cancer statistics. CA Cancer J Clin 2010; 60:277–300.
Article Google Scholar - Takata R, Akamatsu S, Kubo M, et al. Genome-wide association study identifies five new susceptibility loci for prostate cancer in the Japanese population. Nat Genet 2010; 42:751–754.
Article CAS Google Scholar - Andreoiu M, Cheng L . Multifocal prostate cancer: biologic, prognostic, and therapeutic implications. Hum Pathol 2010; 41:781–793.
Article Google Scholar - Shen MM, Abate-Shen C . Molecular genetics of prostate cancer: new prospects for old challenges. Genes Dev 2010; 24:1967–2000.
Article CAS Google Scholar - Taylor BS, Schultz N, Hieronymus H, et al. Integrative genomic profiling of human prostate cancer. Cancer Cell 2010; 18:11–22.
Article CAS Google Scholar - Singh D, Febbo PG, Ross K, et al. Gene expression correlates of clinical prostate cancer behavior. Cancer Cell 2002; 1:203–209.
Article CAS Google Scholar - Lapointe J, Li C, Higgins JP, et al. Gene expression profiling identifies clinically relevant subtypes of prostate cancer. Proc Natl Acad Sci USA 2004; 101:811–816.
Article CAS Google Scholar - Lapointe J, Li C, Giacomini CP, et al. Genomic profiling reveals alternative genetic pathways of prostate tumorigenesis. Cancer Res 2007; 67:8504–8510.
Article CAS Google Scholar - Kim JH, Dhanasekaran SM, Mehra R, et al. Integrative analysis of genomic aberrations associated with prostate cancer progression. Cancer Res 2007; 67:8229–8239.
Article CAS Google Scholar - Mendes A, Scott RJ, Moscato P . Microarrays--identifying molecular portraits for prostate tumors with different Gleason patterns. Methods Mol Med 2008; 141:131–151.
Article CAS Google Scholar - Taylor BS, Ladanyi M . Clinical cancer genomics: how soon is now? J Pathol 2011; 223:318–326.
Article Google Scholar - Morozova O, Marra MA . Applications of next-generation sequencing technologies in functional genomics. Genomics 2008; 92:255–264.
Article CAS Google Scholar - Voelkerding KV, Dames SA, Durtschi JD . Next-generation sequencing: from basic research to diagnostics. Clin Chem 2009; 55:641–658.
Article CAS Google Scholar - Wang Z, Gerstein M, Snyder M . RNA-Seq: a revolutionary tool for transcriptomics. Nat Rev Genet 2009; 10:57–63.
Article CAS Google Scholar - Ozsolak F, Milos PM . RNA sequencing: advances, challenges and opportunities. Nat Rev Genet 2011; 12:87–98.
Article CAS Google Scholar - Bell DW . Our changing view of the genomic landscape of cancer. J Pathol 2010; 220:231–243.
CAS PubMed PubMed Central Google Scholar - Ding L, Wendl MC, Koboldt DC, Mardis ER . Analysis of next-generation genomic data in cancer: accomplishments and challenges. Hum Mol Genet 2010; 19:R188–R196.
Article CAS Google Scholar - Meyerson M, Gabriel S, Getz G . Advances in understanding cancer genomes through second-generation sequencing. Nat Rev Genet 2010; 11:685–696.
Article CAS Google Scholar - Ley TJ, Mardis ER, Ding L, et al. DNA sequencing of a cytogenetically normal acute myeloid leukaemia genome. Nature 2008; 456:66–72.
Article CAS Google Scholar - Campbell PJ, Yachida S, Mudie LJ, et al. The patterns and dynamics of genomic instability in metastatic pancreatic cancer. Nature 2010; 467:1109–1113.
Article CAS Google Scholar - Lee W, Jiang Z, Liu J, et al. The mutation spectrum revealed by paired genome sequences from a lung cancer patient. Nature 2010; 465:473–477.
Article CAS Google Scholar - Ley TJ, Ding L, Walter MJ, et al. DNMT3A mutations in acute myeloid leukemia. N Engl J Med 2010; 363:2424–2433.
Article CAS Google Scholar - Mardis ER, Ding L, Dooling DJ, et al. Recurring mutations found by sequencing an acute myeloid leukemia genome. N Engl J Med 2009; 361:1058–1066.
Article CAS Google Scholar - Ding L, Ellis MJ, Li S, et al. Genome remodelling in a basal-like breast cancer metastasis and xenograft. Nature 2010; 464:999–1005.
Article CAS Google Scholar - Pleasance ED, Cheetham RK, Stephens PJ, et al. A comprehensive catalogue of somatic mutations from a human cancer genome. Nature 2010; 463:191–196.
Article CAS Google Scholar - Jones S, Wang TL, Shih Ie M, et al. Frequent mutations of chromatin remodeling gene ARID1A in ovarian clear cell carcinoma. Science 2010; 330:228–231.
Article CAS Google Scholar - Stephens PJ, McBride DJ, Lin ML, et al. Complex landscapes of somatic rearrangement in human breast cancer genomes. Nature 2009; 462:1005–1010.
Article CAS Google Scholar - Griffith M, Griffith OL, Mwenifumbo J, et al. Alternative expression analysis by RNA sequencing. Nat Methods 2010; 7:843–847.
Article CAS Google Scholar - Shah SP, Kobel M, Senz J, et al. Mutation of FOXL2 in granulosa-cell tumors of the ovary. N Engl J Med 2009; 360:2719–2729.
Article CAS Google Scholar - Wiegand KC, Shah SP, Al-Agha OM, et al. ARID1A mutations in endometriosis-associated ovarian carcinomas. N Engl J Med 2010; 363:1532–1543.
Article CAS Google Scholar - Maher CA, Palanisamy N, Brenner JC, et al. Chimeric transcript discovery by paired-end transcriptome sequencing. Proc Natl Acad Sci USA 2009; 106:12353–12358.
Article CAS Google Scholar - Zhao Q, Caballero OL, Levy S, et al. Transcriptome-guided characterization of genomic rearrangements in a breast cancer cell line. Proc Natl Acad Sci USA 2009; 106:1886–1891.
Article CAS Google Scholar - Maher CA, Kumar-Sinha C, Cao X, et al. Transcriptome sequencing to detect gene fusions in cancer. Nature 2009; 458:97–101.
Article CAS Google Scholar - Li R, Yu C, Li Y, et al. SOAP2: an improved ultrafast tool for short read alignment. Bioinformatics 2009; 25:1966–1967.
Article CAS Google Scholar - Tomlins SA, Rhodes DR, Perner S, et al. Recurrent fusion of TMPRSS2 and ETS transcription factor genes in prostate cancer. Science 2005; 310:644–648.
Article CAS Google Scholar - Pflueger D, Terry S, Sboner A, et al. Discovery of non-ETS gene fusions in human prostate cancer using next-generation RNA sequencing. Genome Res 2011; 21:56–67.
Article CAS Google Scholar - Berger MF, Lawrence MS, Demichelis F, et al. The genomic complexity of primary human prostate cancer. Nature. 2011; 470:214–220.
Article CAS Google Scholar - Esgueva R, Perner S, J LaFargue C, et al. Prevalence of TMPRSS2-ERG and SLC45A3-ERG gene fusions in a large prostatectomy cohort. Mod Pathol 2010; 23:539–546.
Article CAS Google Scholar - Gupta RA, Shah N, Wang KC, et al. Long non-coding RNA HOTAIR reprograms chromatin state to promote cancer metastasis. Nature 2010; 464:1071–1076.
Article CAS Google Scholar - Hessels D, Schalken JA . The use of PCA3 in the diagnosis of prostate cancer. Nat Rev Urol 2009; 6:255–261.
Article CAS Google Scholar - Ifere GO, Ananaba GA . Prostate cancer gene expression marker 1 (PCGEM1): a patented prostate-specific non-coding gene and regulator of prostate cancer progression. Recent Pat DNA Gene Seq 2009; 3:151–163.
Article CAS Google Scholar - Nagano T, Mitchell JA, Sanz LA, et al. The air noncoding RNA epigenetically silences transcription by targeting G9a to chromatin. Science 2008; 322:1717–1720.
Article CAS Google Scholar - Loewer S, Cabili MN, Guttman M, et al. Large intergenic non-coding RNA-RoR modulates reprogramming of human induced pluripotent stem cells. Nat Genet 2010; 42:1113–1117.
Article CAS Google Scholar - Tsai MC, Manor O, Wan Y, et al. Long noncoding RNA as modular scaffold of histone modification complexes. Science 2010; 329:689–693.
Article CAS Google Scholar - Bass BL . RNA editing by adenosine deaminases that act on RNA. Annu Rev Biochem 2002; 71:817–846.
Article CAS Google Scholar - David CJ, Chen M, Assanah M, Canoll P, Manley JL . HnRNP proteins controlled by c-Myc deregulate pyruvate kinase mRNA splicing in cancer. Nature 2010; 463:364–368.
Article CAS Google Scholar - David CJ, Manley JL . Alternative pre-mRNA splicing regulation in cancer: pathways and programs unhinged. Genes Dev 2010; 24:2343–2364.
Article CAS Google Scholar - McCracken M, Olsen M, Chen MS, et al. Cancer incidence, mortality, and associated risk factors among Asian Americans of Chinese, Filipino, Vietnamese, Korean, and Japanese ethnicities. CA Cancer J Clin 2007; 57:190–205.
Article Google Scholar - Palanisamy N, Ateeq B, Kalyana-Sundaram S, et al. Rearrangements of the RAF kinase pathway in prostate cancer, gastric cancer and melanoma. Nat Med 2010; 16:793–798.
Article CAS Google Scholar - Van Landuyt L, Lissens W, Stouffs K, et al. The role of USP9Y and DBY in infertile patients with severely impaired spermatogenesis. Mol Hum Reprod 2001; 7:691–693.
Article CAS Google Scholar - Lee KH, Song GJ, Kang IS, et al. Ubiquitin-specific protease activity of USP9Y, a male infertility gene on the Y chromosome. Reprod Fertil Dev 2003; 15:129–133.
Article CAS Google Scholar - Mani RS, Tomlins SA, Callahan K, et al. Induced chromosomal proximity and gene fusions in prostate cancer. Science 2009; 326:1230.
Article CAS Google Scholar - Haffner MC, Aryee MJ, Toubaji A, et al. Androgen-induced TOP2B-mediated double-strand breaks and prostate cancer gene rearrangements. Nat Genet 2010; 42:668–675.
Article CAS Google Scholar - Lin C, Yang L, Tanasa B, Hutt K, et al. Nuclear receptor-induced chromosomal proximity and DNA breaks underlie specific translocations in cancer. Cell 2009; 139:1069–83.
Article CAS Google Scholar - Prensner JR, Iyer MK, Balbin OA, et al. Transcriptome sequencing across a prostate cancer cohort identifies PCAT-1, an unannotated lincRNA implicated in disease progression. Nat Biotechnol 2011; 29:742–749.
Article CAS Google Scholar - Kannan K, Wang L, Wang J, et al. Recurrent chimeric RNAs enriched in human prostate cancer identified by deep sequencing. Proc Natl Acad Sci USA 2011; 108:9172–7.
Article CAS Google Scholar - Orom UA, Derrien T, Beringer M, et al. Long noncoding RNAs with enhancer-like function in human cells. Cell 2010; 143:46–58.
Article CAS Google Scholar - Rajan P, Elliott DJ, Robson CN, Leung HY . Alternative splicing and biological heterogeneity in prostate cancer. Nat Rev Urol 2009; 6:454–460.
Article CAS Google Scholar - Makarov DV, Loeb S, Getzenberg RH, Partin AW . Biomarkers for prostate cancer. Annu Rev Med 2009; 60:139–151.
Article CAS Google Scholar - Audic S, Claverie JM . The significance of digital gene expression profiles. Genome Res 1997; 7:986–995.
Article CAS Google Scholar - Eisen MB, Spellman PT, Brown PO, Botstein D . Cluster analysis and display of genome-wide expression patterns. Proc Natl Acad Sci USA 1998; 95:14863–14868.
Article CAS Google Scholar - Saldanha AJ . Java Treeview-extensible visualization of microarray data. Bioinformatics 2004; 20:3246–3248.
Article CAS Google Scholar - Li RQ, Li YR, Fang XD, et al. SNP detection for massively parallel whole-genome resequencing. Genome Res 2009; 19:1124–1132.
Article CAS Google Scholar - Black DL . Mechanisms of alternative pre-messenger RNA splicing. Annu Rev Biochem 2003; 72:291–336.
Article CAS Google Scholar - Lareau LF, Green RE, Bhatnagar RS, Brenner SE . The evolving roles of alternative splicing. Curr Opin Struct Biol 2004; 14:273–282.
Article CAS Google Scholar - Stamm S, Ben-Ari S, Rafalska I, et al. Function of alternative splicing. Gene 2005; 344:1–20.
Article CAS Google Scholar - Huang S, Zhang J, Li R, et al. SOAPsplice: genome-wide ab initio detection of splice junctions from RNA-Seq data. Front Gene 2011; 2:46. doi:10.3389/fgene.2011.00046
Article Google Scholar - Tomlins SA, Mehra R, Rhodes DR, et al. TMPRSS2:ETV4 gene fusions define a third molecular subtype of prostate cancer. Cancer Res 2006; 66:3396–3400.
Article CAS Google Scholar
Acknowledgements
This work was supported by the National Basic Research Program of China (2012CB518300 to YHS), the Ministry of Science & Technology of Shanghai (08410701500 to YHS), the National Natural Science Fundation of China (81101946 to SCR) and the National High Technology Research and Development Program of China (863 Program, 2006AA02A302 to HMY).
Author information
Author notes
- Shancheng Ren, Zhiyu Peng and Jian-Hua Mao: These three authors contributed equally to this work.
Authors and Affiliations
- Department of Urology, Shanghai Changhai Hospital, Second Military Medical University, 200433, Shanghai, China
Shancheng Ren, Zilian Cui, Weidong Xu, Fubo Wang, Ji Lu, Min Wei, Liang Tang, Chuanliang Xu, Linhui Wang, Xu Gao & Yinghao Sun - Beijing Genomics Institute at Shenzhen, Shenzhen, 518083, Guangdong, China
Zhiyu Peng, Jibin Zhang, Kang Yi, Chao Chen, Xinwu Guo, Jun Yang, Zhijian Tian, Wei Tian, Jian Wang, Huanming Yang & Jun Wang - Life Sciences Division, Lawrence Berkeley National Laboratory, One Cyclotron Road, Berkeley, 94720, CA, USA
Jian-Hua Mao & Yinghui Guan - Department of Pathology, Shanghai Changhai Hospital, Second Military Medical University, 200433, Shanghai, China
Yongwei Yu - Department of Urology, Jiangsu Provincial People's Hospital, Nanjing Medical University, Nanjing, 210029, Jiangsu, China
Changjun Yin - Department of Urology, the Third Affiliated Hospital of Sun Yat Sen University, Guangzhou, 510630, Guangdong, China
Xin Gao
Authors
- Shancheng Ren
You can also search for this author inPubMed Google Scholar - Zhiyu Peng
You can also search for this author inPubMed Google Scholar - Jian-Hua Mao
You can also search for this author inPubMed Google Scholar - Yongwei Yu
You can also search for this author inPubMed Google Scholar - Changjun Yin
You can also search for this author inPubMed Google Scholar - Xin Gao
You can also search for this author inPubMed Google Scholar - Zilian Cui
You can also search for this author inPubMed Google Scholar - Jibin Zhang
You can also search for this author inPubMed Google Scholar - Kang Yi
You can also search for this author inPubMed Google Scholar - Weidong Xu
You can also search for this author inPubMed Google Scholar - Chao Chen
You can also search for this author inPubMed Google Scholar - Fubo Wang
You can also search for this author inPubMed Google Scholar - Xinwu Guo
You can also search for this author inPubMed Google Scholar - Ji Lu
You can also search for this author inPubMed Google Scholar - Jun Yang
You can also search for this author inPubMed Google Scholar - Min Wei
You can also search for this author inPubMed Google Scholar - Zhijian Tian
You can also search for this author inPubMed Google Scholar - Yinghui Guan
You can also search for this author inPubMed Google Scholar - Liang Tang
You can also search for this author inPubMed Google Scholar - Chuanliang Xu
You can also search for this author inPubMed Google Scholar - Linhui Wang
You can also search for this author inPubMed Google Scholar - Xu Gao
You can also search for this author inPubMed Google Scholar - Wei Tian
You can also search for this author inPubMed Google Scholar - Jian Wang
You can also search for this author inPubMed Google Scholar - Huanming Yang
You can also search for this author inPubMed Google Scholar - Jun Wang
You can also search for this author inPubMed Google Scholar - Yinghao Sun
You can also search for this author inPubMed Google Scholar
Corresponding author
Correspondence toYinghao Sun.
Additional information
( Supplementary information is linked to the online version of the paper on the Cell Research website.)
Supplementary information
Supplementary information, Table S2
Sequencing quality control information (XLSX 13 kb)
Supplementary information, Table S3
Summary of gene fusions identified by RNA-seq in normal and prostate cancer tissues (XLS 41 kb)
Supplementary information, Table S4
List of all the expressed long ncRNAs identified by RNA-seq in normal and prostate cancer tissues (XLS 1117 kb)
Supplementary information, Table S5
List of the genes for which expression was significantly correlated with the expression level of long ncRNAs (XLS 1732 kb)
Supplementary information, Table S6
Summary of the tumor-specific point mutations in each sample (XLS 5436 kb)
Supplementary information, Table S7
Somatic mutations per bp (XLS 30 kb)
Supplementary information, Table S8
List of all the point mutations in coding regions (XLS 55 kb)
Supplementary information, Table S9
List of point mutations that cause amino acid changes in tumors (XLS 55 kb)
Supplementary information, Table S10
List of the point mutations used for validation and results (XLS 30 kb)
Supplementary information, Table S11
List of all the tumor-specific ASs found in the 14 cancer samples (XLSX 7473 kb)
Supplementary information, Table S12
List of the highly reliable tumor-specific ASs (XLSX 2740 kb)
Supplementary information, Table S13
List of all the primers for validation (XLS 26 kb)
Supplementary information, Figure S1
A framework for systematic cancer transcriptome analysis. (PDF 59 kb)
Supplementary information, Figure S2
a. USP9Y-TTTY15 fusion in three prostate cancers. (PDF 84 kb)
Supplementary information, Figure S3
Representative experimental validation of the SDK1-AMACR and RAD50-PDLIM4 gene fusion transcripts by RT-PCR and Sanger sequencing. (PDF 51 kb)
Supplementary information, Figure S4
Correlation between the qRT-PCR and RNA-seq data. (PDF 82 kb)
Supplementary information, Figure S5
KLK3 intron retention was found in 26 of 40 prostate cancers and AMACR exon skipping in 14 of 40 prostate cancers. (PDF 95 kb)
Supplementary information, Figure S6
Illustration for fusions (A fusion was called if the fusion sites were located in known exon boundaries from two different genes and there was at least one paired-end read to support it). (PDF 44 kb)
Rights and permissions
About this article
Cite this article
Ren, S., Peng, Z., Mao, JH. et al. RNA-seq analysis of prostate cancer in the Chinese population identifies recurrent gene fusions, cancer-associated long noncoding RNAs and aberrant alternative splicings.Cell Res 22, 806–821 (2012). https://doi.org/10.1038/cr.2012.30
- Received: 15 August 2011
- Revised: 27 November 2011
- Accepted: 13 December 2011
- Published: 21 February 2012
- Issue Date: May 2012
- DOI: https://doi.org/10.1038/cr.2012.30