Expression QTL analysis of top loci from GWAS meta-analysis highlights additional schizophrenia candidate genes (original) (raw)
Introduction
Schizophrenia is a severe mental disorder, affecting about 1% of the population worldwide. Heritability is estimated to be around 80%, but the underlying genes are largely unknown.1 Large-scale, genome-wide studies have identified rare genomic microdeletions as well as common variants associated with the disease.2, 3, 4, 5, 6, 7
In a recent study, Purcell et al2 demonstrated that data from genome-wide association studies (GWASs) for schizophrenia are compatible with a very large number of loci with common alleles (_N_>3000), each with a very small contribution to disease susceptibility (odds ratios <1.05). Alternative approaches may be necessary to decipher the genetic basis of schizophrenia and related disorders.8 We therefore aim to combine different layers of genomic information to uncover genetic signal from common variants that would not be identified by current GWAS approaches.
A recent meta-analysis comparing 9394 cases to 12 462 controls resulted in identification of numerous common variants9 with sub threshold association with schizophrenia (6192 single-nucleotide polymorphisms (SNPs) with P<0.001). However, as Purcell et al.2 showed, variants associated with the disease may not reach genome-wide significance. Therefore, it is likely that there are more true positives in the top 6192 SNPs than were identified by performing a standard case–control association analysis. Subtle effects of these SNPs on gene expression could be a functional mechanism by which they confer risk for development of schizophrenia.10, 11 Recently, it has been shown that true GWAS hits are enriched for expression QTLs (eQTLs).11, 12, 13, 14 Therefore, variations influencing gene expression are more likely to be contributing to the phenotype. To this end, we generated eQTLs for the top 6192 SNPs (P<0.001 in meta-analysis). Next, we tested whether the identified transcripts are differentially expressed between patients and healthy controls. These analyses have the potential to provide further support in the involvement of these SNPs in schizophrenia and may highlight additional schizophrenia candidate genes that have not been identified using genome-wide significance thresholds.
Although gene expression in whole blood is only moderately correlated with gene expression in brain tissue,15, 16, 17 several studies suggest that gene expression in blood could serve as a marker of brain-related disease states, including schizophrenia.16, 17, 18, 19, 20, 21, 22 Therefore, gene expression profiling in blood may provide additional insight into the etiology of the disease. We performed the gene expression analyses using whole-blood samples of a relatively large sample of schizophrenia patients and controls.
Materials and methods
eQTL analysis in controls
We calculated the eQTLs for the top SNPs9 in a sample of 437 healthy controls for which genotypes (Illumina 370k array) and whole-blood gene expression data (Illumina H-12 beadchip) was available as described before.11, 23 In short, this dataset consists of 244 males and 193 females with a mean age of 62 years, who where recruited as controls in a study of gene expression in amyotrophic lateral sclerosis. These control subjects were selected for being in good general health and unaffected for neurological and neurodegenerative diseases; no separate screen for psychiatric disorders was performed for these subjects.
Of the 6192 SNPs, 1336 were already available on the array. Imputation was performed by BEAGLE version 3.0.424 using the Hapmap phased founder set, release 2, phase 3 (The International HapMap Project, http://www.hapmap.org). A _R_2 cutoff of 0.90 resulted in 4073 successfully imputed SNPs yielding a total of 5409 SNPs for analysis. The gene expression data of these controls were quantile-normalized and log2-transformed using the PreprocessCore package in R.25 Expression probes were then filtered for mean detection value <0.90 as by manufacturer protocol, leaving 12 990 high-quality probes for analysis.
The 12 990 expression probes were taken as quantitative traits and tested for association with the 5409 available SNPs using a linear association of allele dosage with age and gender as covariates in PLINK.26 To adjust for significant differences in mean age of this control sample and the schizophrenia sample described below, we included age (and gender) as covariates. As _trans_-effects are difficult to identify in a study of this size due to limited power, we focused on _cis_-effects only, that is, 1 MB around the probe center position on either side. We used Bonferroni correction for multiple testing, setting the significance thresholds for _cis_-effects 0.05/5409=9.24E-6.
Differential expression schizophrenia versus controls
We examined whether the probes associated with the top SNPs are also related to schizophrenia disease status. This set consists of 106 schizophrenia cases and 96 healthy controls including 118 male and 84 female subjects, with an average age of 39 years. Diagnoses were determined by Standardized Psychiatric interviews, either The Comprehensive Assessment of Symptoms and History (CASH) or the Composite international diagnostic interview (CIDI) by trained clinicians. Schizophrenia was defined by a DSM-IV-TR diagnosis of #295.0–295.89, and #298.9. This study was approved by Medical Research Ethics Committee (METC) of the University Medical Center Utrecht, The Netherlands. The data was normalized (robust spline normalization), transformed (variance-stabilizing transformation) and filtered according to the Lumi procedure as described previously.27
We used the Limma package28 in R to generate a regression model with selected expression values as dependent and status as independent values. We included age and gender as covariates. We took FDR-corrected _P_-value of 0.05 as significance threshold.
Results
eQTL analysis in controls
We identified 40 unique transcripts from MHC and non-MHC regions regulated by the top 5409 SNPs. The distribution of eQTL results within the _cis_-region is displayed in Figure 1. As we found the signal from the MHC region in the eQTL results to be substantial, these results will be discussed separately. In total, 1664 significant _cis_-effects on 23 unique expression probes from 578 unique SNPs in the MHC region were found. Outside the MHC, 166 _cis_-effects, were identified, representing 249 unique SNPs and 17 unique expression probes. In this instance, we define unique to indicate different SNPs, without considering linkage disequilibrium (LD) between them. The eQTL effects are plotted against the rank of the SNPs in the top list in Figure 2. This shows the effects of the MHC region to be stronger (_P_-values ranging from 4.6E-145 to 9.1E-6) than the rest of the genome (_P_-values ranging from 4.3E-24 to 9.1E-6). In addition, the highest ranking genes are dominated by effects from this region. All significant eQTL effects are given in Supplementary Table 2.
Figure 1
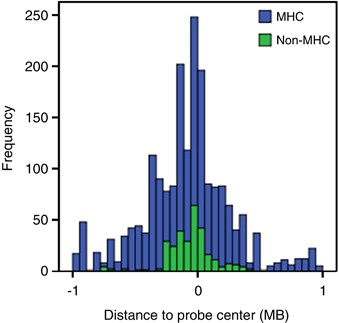
Distribution of eQTL effects. A region of 1 MB around the center of the expression probe was taken as a threshold for _cis_-effects. The plot shows a histogram of frequency of eQTL effects (SNP-probe combinations) in this region. Effects in the MHC region are displayed in blue, effects elsewhere on the genome in green.
Figure 2
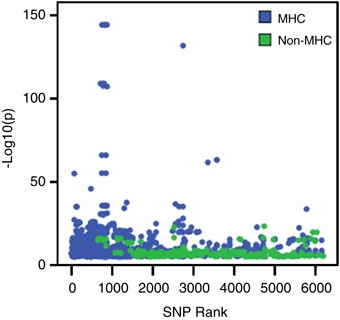
eQTL effects versus SNP rank. The −log10(p) value of eQTL effects (SNP-probe combinations) are plotted against the original rank of the SNP in the schizophrenia meta-analysis top 6192. Effects in the MHC region are displayed in blue, effects elsewhere on the genome in green.
To formally test whether the MHC is overrepresented in the eQTL results, we performed a Fishers' exact test for count data. Of the 5409 SNPs tested, 1071 are located within or are associated to a probe in the extended MHC region (chromosome 6, 26–34 MB). Even though that already represents a large part of the input, the overrepresentation in the eQTL results (unique SNPs influencing one or more expression probes) is significant when compared with SNPs located elsewhere on the genome (Fishers' P<2.2E-16). The fact that this region is known to have complicated and extended LD structures29 may in part explain the fact that more SNPs are related to the same gene expression probes.
Differential expression schizophrenia versus controls
The levels of 40 unique transcripts from MHC and non-MHC regions that we identified were tested for association with schizophrenia in an independent gene expression dataset of schizophrenia cases and controls. Seven of the transcripts were differentially expressed in cases. Table 1 presents the results together with the corresponding eQTL results. Five of the seven transcripts are from genes located in the MHC (TRIM26, RNF5, TUBB, HLA-DRB3, HIST1H2BD). Two differentially expressed probes are located elsewhere on the genome, C16ORF61 on chromosome 16 and CRELD2 on chromosome 22. All but two probes are downregulated in schizophrenia patients compared with healthy controls (C16ORF61 and HIST1H2BD). Although 18 of the 106 schizophrenia patients in this dataset are antipsychotic-free (eg, have not been treated with antipsychotic drugs during the 6-month-period before blood sampling), the effects of medication on gene expression in blood in the overall sample might have contributed to our results.
Table 1 eQTL and differential expression results for potential schizophrenia candidate genes
Next, we examined whether the direction of differential expression coincided with the original meta-analysis results. When the risk allele is associated with upregulation or downregulation of expression, this should be mirrored in the differential expression results. We therefore assume that the eQTL itself is not different between cases and controls, but the frequency of the allele associated with changes in expression levels is. This was the case for three out of the seven genes; TRIM26, RNF5 and HLA-DRB3, all of which are located within the MHC region. TRIM26 is one of the genes identified as susceptibility locus in the original meta-analysis after the replication stage.9
For our top genes (TRIM26, RNF5 and HLA-DRB3) we examined whether the same eQTLs are also present in brain, using a publically available human brain expression dataset of 144 individuals (Gibbs et al30 GEO; GSE15745). Data are available for four different brain regions: cerebellum, frontal cortex, temporal cortex and pons. eQTL analysis was performed as described in blood, with the addition of covariates post-mortem interval, batch, and source of collection. Ring finger protein 5 (RNF5) is not expressed at detectable levels in any of these four regions, HLA-DRB3 and TRIM26 are expressed in all four brain regions. The top SNP regulating HLA-DRB3 (rs9268858) was not available for the brain dataset. However, rs2395185 is in strong LD (_R_2=0.98, based on HapMap3) and shows significant eQTL results for HLA-DRB3 in frontal cortex (_P_=5.7E-7, beta=−0.27, _t_=−5.27), pons (_P_=5.6E-3, beta=−0.22, _t_=−2.82), and cerebellum (_P_=5.7E-7, beta=−0.17, _t_=−3.08). Similarly, the top SNP-regulating TRIM26 (rs2844766) in blood was not available for the brain samples but rs1264616, with moderate LD (_R_2=0.45, based on HapMap3) shows evidence of an eQTL in cerebellum (_P_=9.0E-3, beta=0.09, _t_=2.64). These eQTLs show the same directionality in both blood and brain.
Discussion
Our results are noteworthy in two respects: First, we show that by combining different layers of genetic information we can successfully identify potential candidate genes for schizophrenia. By using eQTL analysis we have identified SNPs that actually have an effect on expression of transcripts that differ between patients and controls. Second, we found that the top list that we took as a starting point harbored significantly more eQTLs in the MHC region compared with elsewhere in the genome. Strong eQTLs in this region have been observed in a previous study in lymphoblastoid cell lines, derived from peripheral blood lymphocytes.31 Specifically, cis eQTLS have been found for TUBB32 and HLA-DRB3,33, 34 whereas RNF5 has been found to be one of the most variable genes between individuals.35 The fact that eQTLs in the MHC region are overrepresented in our study could be due to the type of tissue studied. Blood has an important function in the (primary) immune response and eQTLs can be tissue-specific.36 However, it is also possible that genetic control of this region is stronger than elsewhere on the genome, perhaps related to the extended LD patterns.
The MHC harbors relatively many genes and is highly polymorphic. It regulates the immune response and has been associated to a large number of immune phenotypes and diseases.37 The association of SNPs in these MHC genes can result from mere physical closeness to the schizophrenia variant within the MHC region. However, that would not explain the difference in gene expression of MHC genes presented here, as expression transcripts are not in LD. We find that the eQTL SNPs are often related to multiple probes of different genes within the _cis_-region (up to 6 per SNP). This could point to important regulatory regions in the MHC. We therefore propose that eQTL analysis could aid in the refinement of the MHC region.
Although association of schizophrenia with this area has been consistent, the functional explanation is still ambiguous. Inflammation is suggested to be an inherent part of schizophrenia. Reports show that schizophrenia patients have either higher or lower prevalence of some autoimmune disorders than expected38 and that the efficacy of anti-inflammatory drugs differs in patients.39 The latter observations could support the viral hypothesis of schizophrenia.40 However, of the three identified candidate genes in the MHC region, only one has a known immune function. This is HLA-DRB3 (major histocompatibility complex, class II, DR beta 3). Class II molecules are expressed in antigen-presenting cells. They have a central role in the immune system by presenting peptides derived from extracellular proteins. The function of TRIM26 (tripartite motif-containing 26) in the classical class I subregion is unknown; however, it is thought to have DNA-binding activity.29 RNF5 in the classical class III subregion is involved in cell motility. It has been shown to be a regulator of breast cancer progression through its effect on actin cytoskeletal alterations.41 This suggests that the MHC signals associated with schizophrenia are not necessarily immune-related, but could also stem from genes in the region that are involved in non-immune-related pathways.
As schizophrenia is a brain-related disease, it was useful to replicate our findings in brain tissue. Publically available brain expression data indicated that eQTLs for TRIM26 and HLA-DRB3 are also present in specific brain regions. Although these results fit well with a possible involvement of these loci in schizophrenia, the lack of sufficient number of available brain tissue from patients has prevented us to examine brain-specific differential gene expression related to disease.
In summary, we have identified three genes, TRIM26, RNF5 and HLA-DRB3 that are regulated by the most significant SNPs in a recent meta-analysis and of which expression is associated with schizophrenia disease status. These effects are small but significant, indicating that the current approach allows to detect the small functional effects that may have a role in schizophrenia susceptibility.2 The results of this study indicate that signal not only stems from the SNPs with the most significant _P_-values in the top 6192 list, but can be linked to less significant SNPs as well. In addition to confirming one of the top findings in the meta-analysis, TRIM26, we also identify RNF5 and HLA-DRB3 as potential candidate genes for schizophrenia. The results of this study gives further insight into the relationship of SNPs with gene expression, highlight the importance of the MHC region for schizophrenia susceptibility and indicate that genetic causal variants for schizophrenia might act through regulation of expression. This approach can be fruitful in identifying phenotypic effects of SNPs highlighted by GWASs.
References
- Sullivan PF, Kendler KS, Neale MC : Schizophrenia as a complex trait: evidence from a meta-analysis of twin studies. Arch Gen Psychiatry 2003; 60: 1187–1192.
Article Google Scholar - Purcell SM, Wray NR, Stone JL et al: Common polygenic variation contributes to risk of schizophrenia and bipolar disorder. Nature 2009; 460: 748–752.
CAS PubMed Google Scholar - Shi J, Levinson DF, Duan J et al: Common variants on chromosome 6p22.1 are associated with schizophrenia. Nature 2009; 460: 753–757.
CAS PubMed PubMed Central Google Scholar - Stefansson H, Ophoff RA, Steinberg S et al: Common variants conferring risk of schizophrenia. Nature 2009; 460: 744–747.
CAS PubMed PubMed Central Google Scholar - Stefansson H, Rujescu D, Cichon S et al: Large recurrent microdeletions associated with schizophrenia. Nature 2008; 455: 232–236.
Article CAS Google Scholar - Buizer-Voskamp JE, Muntjewerff JW, Strengman E et al: Genome-wide analysis shows increased frequency of copy number variation deletions in Dutch schizophrenia patients. Biol Psychiatry 2011; 70: 655–662.
Article CAS Google Scholar - Vrijenhoek T, Buizer-Voskamp JE, van der Stelt I et al: Recurrent CNVs disrupt three candidate genes in schizophrenia patients. Am J Hum Genet 2008; 83: 504–510.
Article CAS Google Scholar - Manolio TA, Collins FS, Cox NJ et al: Finding the missing heritability of complex diseases. Nature 2009; 461: 747–753.
Article CAS Google Scholar - Ripke S, Sanders AR, Kendler KS et al: Genome-wide association study identifies five new schizophrenia loci. Nat Genet 2011; 43: 969–976.
Article CAS Google Scholar - Cookson W, Liang L, Abecasis G, Moffatt M, Lathrop M : Mapping complex disease traits with global gene expression. Nat Rev Genet 2009; 10: 184–194.
Article CAS Google Scholar - Dubois PC, Trynka G, Franke L et al: Multiple common variants for celiac disease influencing immune gene expression. Nat Genet 2010; 42: 295–302.
Article CAS Google Scholar - Nicolae DL, Gamazon E, Zhang W, Duan S, Dolan ME, Cox NJ : Trait-associated SNPs are more likely to be eQTLs: annotation to enhance discovery from GWAS. PLoS Genet 2010; 6: e1000888.
Article Google Scholar - Richards AL, Jones L, Moskvina V et al: Schizophrenia susceptibility alleles are enriched for alleles that affect gene expression in adult human brain. Mol Psychiatry 2011; 17: 193–201.
Article Google Scholar - Zhong H, Beaulaurier J, Lum PY et al: Liver and adipose expression associated SNPs are enriched for association to type 2 diabetes. PLoS Genet 2010; 6: e1000932.
Article Google Scholar - Cai C, Langfelder P, Fuller TF et al: Is human blood a good surrogate for brain tissue in transcriptional studies? BMC Genomics 2010; 11: 589.
Article Google Scholar - Jasinska AJ, Service S, Choi OW et al: Identification of brain transcriptional variation reproduced in peripheral blood: an approach for mapping brain expression traits. Hum Mol Genet 2009; 18: 4415–4427.
Article CAS Google Scholar - Rollins B, Martin MV, Morgan L, Vawter MP : Analysis of whole genome biomarker expression in blood and brain. Am J Med Genet B Neuropsychiatr Genet 2010; 153B: 919–936.
CAS PubMed PubMed Central Google Scholar - Iwamoto K, Kakiuchi C, Bundo M, Ikeda K, Kato T : Molecular characterization of bipolar disorder by comparing gene expression profiles of postmortem brains of major mental disorders. Mol Psychiatry 2004; 9: 406–416.
Article CAS Google Scholar - Tsuang MT, Nossova N, Yager T et al: Assessing the validity of blood-based gene expression profiles for the classification of schizophrenia and bipolar disorder: a preliminary report. Am J Med Genet B Neuropsychiatr Genet 2005; 133B: 1–5.
Article Google Scholar - Gladkevich A, Kauffman HF, Korf J : Lymphocytes as a neural probe: potential for studying psychiatric disorders. Prog Neuropsychopharmacol Biol Psychiatry 2004; 28: 559–576.
Article Google Scholar - Glatt SJ, Everall IP, Kremen WS et al: Comparative gene expression analysis of blood and brain provides concurrent validation of SELENBP1 up-regulation in schizophrenia. Proc Natl Acad Sci USA 2005; 102: 15533–15538.
Article CAS Google Scholar - Kuzman MR, Medved V, Terzic J, Krainc D : Genome-wide expression analysis of peripheral blood identifies candidate biomarkers for schizophrenia. J Psychiatr Res 2009; 43: 1073–1077.
Article Google Scholar - Saris CG, Horvath S, van Vught PW et al: Weighted gene co-expression network analysis of the peripheral blood from Amyotrophic Lateral Sclerosis patients. BMC Genomics 2009; 10: 405.
Article Google Scholar - Browning BL, Browning SR : A unified approach to genotype imputation and haplotype-phase inference for large data sets of trios and unrelated individuals. Am J Hum Genet 2009; 84: 210–223.
Article CAS Google Scholar - Bolstad BM, Irizarry RA, Astrand M, Speed TP : A comparison of normalization methods for high density oligonucleotide array data based on variance and bias. Bioinformatics 2003; 19: 185–193.
Article CAS Google Scholar - Purcell S, Neale B, Todd-Brown K et al: PLINK: a tool set for whole-genome association and population-based linkage analyses. Am J Hum Genet 2007; 81: 559–575.
Article CAS Google Scholar - Du P, Kibbe WA, Lin SM : Lumi: a pipeline for processing Illumina microarray. Bioinformatics 2008; 24: 1547–1548.
Article CAS Google Scholar - Smyth GK : Linear models and empirical bayes methods for assessing differential expression in microarray experiments. Stat Appl Genet Mol Biol 2004; 3: Article3.
Article Google Scholar - Horton R, Wilming L, Rand V et al: Gene map of the extended human MHC. Nat Rev Genet 2004; 5: 889–899.
Article CAS Google Scholar - Gibbs JR, van der Brug MP, Hernandez DG et al: Abundant quantitative trait loci exist for DNA methylation and gene expression in human brain. PLoS genetics 2010; 6: e1000952.
Article Google Scholar - Dixon AL, Liang L, Moffatt MF et al: A genome-wide association study of global gene expression. Nat Genet 2007; 39: 1202–1207.
Article CAS Google Scholar - Stranger BE, Nica AC, Forrest MS et al: Population genomics of human gene expression. Nat Genet 2007; 39: 1217–1224.
Article CAS Google Scholar - Monks SA, Leonardson A, Zhu H et al: Genetic inheritance of gene expression in human cell lines. Am J Hum Genet 2004; 75: 1094–1105.
Article CAS Google Scholar - Goring HH, Curran JE, Johnson MP et al: Discovery of expression QTLs using large-scale transcriptional profiling in human lymphocytes. Nat Genet 2007; 39: 1208–1216.
Article Google Scholar - Cheung VG, Jen KY, Weber T et al: Genetics of quantitative variation in human gene expression. Cold Spring Harb Symp Quant Biol 2003; 68: 403–407.
Article CAS Google Scholar - Heinzen EL, Ge D, Cronin KD et al: Tissue-specific genetic control of splicing: implications for the study of complex traits. PLoS Biol 2008; 6: e1.
Article Google Scholar - Vandiedonck C, Knight JC : The human major histocompatibility complex as a paradigm in genomics research. Brief Funct Genomic Proteomic 2009; 8: 379–394.
Article CAS Google Scholar - Eaton WW, Byrne M, Ewald H et al: Association of schizophrenia and autoimmune diseases: linkage of Danish national registers. Am J Psychiatry 2006; 163: 521–528.
Article Google Scholar - Laan W, Grobbee DE, Selten JP, Heijnen CJ, Kahn RS, Burger H : Adjuvant aspirin therapy reduces symptoms of schizophrenia spectrum disorders: results from a randomized, double-blind, placebo-controlled trial. J Clin Psychiatry 2010; 71: 520–527.
Article CAS Google Scholar - Doorduin J, de Vries EF, Willemsen AT, de Groot JC, Dierckx RA, Klein HC : Neuroinflammation in schizophrenia-related psychosis: a PET study. J Nucl Med 2009; 50: 1801–1807.
Article Google Scholar - Bromberg KD, Kluger HM, Delaunay A et al: Increased expression of the E3 ubiquitin ligase RNF5 is associated with decreased survival in breast cancer. Cancer Res 2007; 67: 8172–8179.
Article CAS Google Scholar
Acknowledgements
We thank the participants and their relatives and staff at the various recruitment centers. This work was supported by TI-pharma project T5-203 and funding from the US National Institutes of Health MH078075 and NS058980 (RAO) and the Amyotrophic Lateral Sclerosis Association (RAO and LHvdB). Statistical analyses were carried out on the Genetic Cluster Computer (http://www.geneticcluster.org), which is financially supported by the Netherlands Scientific Organization (NWO 480-05-003) along with a supplement from the Dutch Brain Foundation.
Author information
Author notes
- Simone de Jong
Present address: 6Current address: UCLA Center for Neurobehavioral Genetics (affiliation 3)., - The Schizophrenia Psychiatric Genome-Wide Association Study (GWAS) Consortium authors are listed in Supplementary Table S1.
Authors and Affiliations
- Department of Medical Genetics, University Medical Center Utrecht, Utrecht, The Netherlands
Simone de Jong, Kristel R van Eijk, Dave W L H Zeegers, Eric Strengman & Esther Janson - Department of Psychiatry, Rudolf Magnus Institute of Neuroscience, University Medical Center, Utrecht, The Netherlands
Simone de Jong, Wiepke Cahn, René S Kahn, Marco P M Boks & Roel A Ophoff - Center for Neurobehavioral Genetics, Semel Institute for Neuroscience and Human Behavior, University of California, Los Angeles, CA, USA
Eric Strengman & Roel A Ophoff - Department of Neurology, Rudolf Magnus Institute of Neuroscience, University Medical Center Utrecht, Utrecht, The Netherlands
Jan H Veldink & Leonard H van den Berg - Julius Centre for Health Sciences and Primary Care, University Medical Center, Utrecht, The Netherlands
Marco P M Boks
Authors
- Simone de Jong
You can also search for this author inPubMed Google Scholar - Kristel R van Eijk
You can also search for this author inPubMed Google Scholar - Dave W L H Zeegers
You can also search for this author inPubMed Google Scholar - Eric Strengman
You can also search for this author inPubMed Google Scholar - Esther Janson
You can also search for this author inPubMed Google Scholar - Jan H Veldink
You can also search for this author inPubMed Google Scholar - Leonard H van den Berg
You can also search for this author inPubMed Google Scholar - Wiepke Cahn
You can also search for this author inPubMed Google Scholar - René S Kahn
You can also search for this author inPubMed Google Scholar - Marco P M Boks
You can also search for this author inPubMed Google Scholar - Roel A Ophoff
You can also search for this author inPubMed Google Scholar
Consortia
The PGC Schizophrenia (GWAS) Consortium
Corresponding author
Correspondence toRoel A Ophoff.
Ethics declarations
Competing interests
The authors declare no conflict of interest.
Additional information
Supplementary Information accompanies the paper on European Journal of Human Genetics website
Supplementary information
Rights and permissions
About this article
Cite this article
de Jong, S., van Eijk, K., Zeegers, D. et al. Expression QTL analysis of top loci from GWAS meta-analysis highlights additional schizophrenia candidate genes.Eur J Hum Genet 20, 1004–1008 (2012). https://doi.org/10.1038/ejhg.2012.38
- Received: 04 October 2011
- Revised: 30 January 2012
- Accepted: 02 February 2012
- Published: 21 March 2012
- Issue Date: September 2012
- DOI: https://doi.org/10.1038/ejhg.2012.38