Influence of extreme weather disasters on global crop production (original) (raw)
- Letter
- Published: 06 January 2016
Nature volume 529, pages 84–87 (2016) Cite this article
- 61k Accesses
- 3488 Citations
- 846 Altmetric
- Metrics details
Subjects
Abstract
In recent years, several extreme weather disasters have partially or completely damaged regional crop production1,[2](/articles/nature16467#ref-CR2 "World Food Programme. Pakistan – Flood Impact Assessment http://documents.wfp.org/stellent/groups/public/documents/ena/wfp225987.pdf
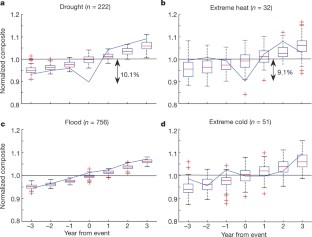
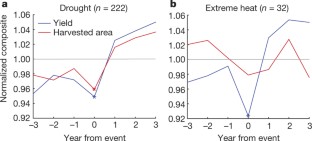
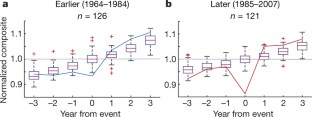
(2010)"),[3](/articles/nature16467#ref-CR3 "Gu, L. et al. The 2007 eastern US spring freeze: increased cold damage in a warming world. Bioscience 58, 253 (2008)"),[4](/articles/nature16467#ref-CR4 "Barriopedro, D., Fischer, E. M., Luterbacher, J., Trigo, R. M. & García-Herrera, R. The hot summer of 2010: redrawing the temperature record map of Europe. Science 332, 220–224 (2011)"),[5](/articles/nature16467#ref-CR5 "Coumou, D. & Rahmstorf, S. A decade of weather extremes. Nature Clim. Change 2, 491–496 (2012)"). While detailed regional accounts of the effects of extreme weather disasters exist, the global scale effects of droughts, floods and extreme temperature on crop production are yet to be quantified. Here we estimate for the first time, to our knowledge, national cereal production losses across the globe resulting from reported extreme weather disasters during 1964–2007\. We show that droughts and extreme heat significantly reduced national cereal production by 9–10%, whereas our analysis could not identify an effect from floods and extreme cold in the national data. Analysing the underlying processes, we find that production losses due to droughts were associated with a reduction in both harvested area and yields, whereas extreme heat mainly decreased cereal yields. Furthermore, the results highlight \~7% greater production damage from more recent droughts and 8–11% more damage in developed countries than in developing ones. Our findings may help to guide agricultural priorities in international disaster risk reduction and adaptation efforts.This is a preview of subscription content, access via your institution
Access options
Subscribe to this journal
Receive 52 print issues and online access
$199.00 per year
only $3.83 per issue
Buy this article
- Purchase on SpringerLink
- Instant access to the full article PDF.
USD 39.95
Prices may be subject to local taxes which are calculated during checkout
Additional access options:
Figure 1: Influence of EWDs on national cereal production.
The alternative text for this image may have been generated using AI.
Figure 2: Influence of EWDs on national cereal yields and harvested area.
The alternative text for this image may have been generated using AI.
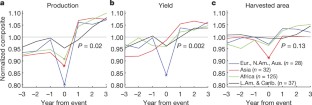
Figure 3: A regional analysis of the influence of drought.
The alternative text for this image may have been generated using AI.
Figure 4: The influence of drought and extreme heat on maize, rice and wheat.

The alternative text for this image may have been generated using AI.
Figure 5: A temporal analysis of the influence of drought.
The alternative text for this image may have been generated using AI.
References
- Battisti, D. S. & Naylor, R. L. Historical warnings of future food insecurity with unprecedented seasonal heat. Science 323, 240–244 (2009)
Article CAS Google Scholar - World Food Programme. Pakistan – Flood Impact Assessmenthttp://documents.wfp.org/stellent/groups/public/documents/ena/wfp225987.pdf (2010)
- Gu, L. et al. The 2007 eastern US spring freeze: increased cold damage in a warming world. Bioscience 58, 253 (2008)
Article Google Scholar - Barriopedro, D., Fischer, E. M., Luterbacher, J., Trigo, R. M. & García-Herrera, R. The hot summer of 2010: redrawing the temperature record map of Europe. Science 332, 220–224 (2011)
Article ADS CAS Google Scholar - Coumou, D. & Rahmstorf, S. A decade of weather extremes. Nature Clim. Change 2, 491–496 (2012)
Article ADS Google Scholar - Intergovernmental Panel on Climate Change. in Managing the Risks of Extreme Events and Disasters to Advance Climate Change Adaptation (eds Field, C. B. et al. ) 1–19 (Cambridge Univ. Press, 2012)
- United Nations Office for Disaster Risk Reduction. The Pocket GAR 2013 – From Shared Risk to Shared Value: the Business Case for Disaster Risk Reduction (UNISDR, 2013)
- World Meterological Organization. Atlas of Mortality and Economic Losses from Weather, Climate and Water Extremes (1970–2012). (WMO, 2014)
- Food and Agriculture Organization of the United Nations. The Impact of Natural Hazards and Disasters on Agriculture and Food and Nutrition Security – A Call for Action to Build Resilient Livelihoods (FAO, 2015)
- Lobell, D. B. et al. The critical role of extreme heat for maize production in the United States. Nature Clim. Change 3, 497–501 (2013)
Article ADS Google Scholar - Lobell, D. B., Sibley, A. & Ivan Ortiz-Monasterio, J. Extreme heat effects on wheat senescence in India. Nature Clim. Change 2, 186–189 (2012)
Article ADS Google Scholar - Lobell, D. B., Bänziger, M., Magorokosho, C. & Vivek, B. Nonlinear heat effects on African maize as evidenced by historical yield trials. Nature Clim. Change 1, 42–45 (2011)
Article ADS Google Scholar - Moriondo, M., Giannakopoulos, C. & Bindi, M. Climate change impact assessment: the role of climate extremes in crop yield simulation. Clim. Change 104, 679–701 (2010)
Article ADS Google Scholar - Teixeira, E. I., Fischer, G., van Velthuizen, H., Walter, C. & Ewert, F. Global hot-spots of heat stress on agricultural crops due to climate change. Agric. For. Meteorol. 170, 206–215 (2013)
Article ADS Google Scholar - Deryng, D., Conway, D., Ramankutty, N., Price, J. & Warren, R. Global crop yield response to extreme heat stress under multiple climate change futures. Environ. Res. Lett. 9, 034011 (2014)
Article ADS Google Scholar - Iizumi, T. & Ramankutty, N. How do weather and climate influence cropping area and intensity? Glob. Food Sec. 4, 46–50 (2015)
Article Google Scholar - Johnstone, S. & Mazo, J. Global warming and the Arab Spring. Survival 53, 11–17 (2011)
Article Google Scholar - Welton, G. The Impact of Russia’s 2010 Grain Export Ban (Oxfam International, 2011)
- Brad Adams, J., Mann, M. E. & Ammann, C. M. Proxy evidence for an El Niño-like response to volcanic forcing. Nature 426, 274–278 (2003)
Article ADS CAS Google Scholar - Lobell, D. B., Schlenker, W. & Costa-Roberts, J. Climate trends and global crop production since 1980. Science 333, 616–620 (2011)
Article ADS CAS Google Scholar - Lobell, D. B. & Field, C. B. Global scale climate–crop yield relationships and the impacts of recent warming. Environ. Res. Lett. 2, 014002 (2007)
Article ADS Google Scholar - Thornton, P. K., Ericksen, P. J., Herrero, M. & Challinor, A. J. Climate variability and vulnerability to climate change: a review. Glob. Chang. Biol. 20, 3313–3328 (2014)
Article ADS Google Scholar - Dai, A. Increasing drought under global warming in observations and models. Nature Clim. Change 3, 52–58 (2012)
Article ADS Google Scholar - Sheffield, J., Wood, E. F. & Roderick, M. L. Little change in global drought over the past 60 years. Nature 491, 435–438 (2012)
Article ADS CAS Google Scholar - Trenberth, K. E. et al. Global warming and changes in drought. Nature Clim. Change 4, 17–22 (2014)
Article ADS Google Scholar - Greve, P. et al. Global assessment of trends in wetting and drying over land. Nature Geosci. 7, 716–721 (2014)
Article ADS CAS Google Scholar - Lobell, D. B. et al. Greater sensitivity to drought accompanies maize yield increase in the U.S. Midwest. Science 344, 516–519 (2014)
Article ADS CAS Google Scholar - Gornall, J. et al. Implications of climate change for agricultural productivity in the early twenty-first century. Phil. Trans. R. Soc. Lond. B 365, 2973–2989 (2010)
Article Google Scholar
Acknowledgements
We thank R. Below, who is in charge of the EM-DAT project at the Centre for Research on the Epidemiology of Disasters, for sharing the data. We thank C. Champalle for testing the original idea using data over East Africa in a class project. This research was supported by a Discovery Grant from the Natural Science and Engineering Research Council of Canada to N.R.
Author information
Authors and Affiliations
- Department of Geography, McGill University, Montreal, H3A 0B9, Canada
Corey Lesk & Navin Ramankutty - Department of Geography, University of Sussex, Brighton, BN1 9QJ, UK
Pedram Rowhani - Liu Institute for Global Issues and Institute for Resources, Environment and Sustainability, University of British Columbia, Vancouver, V6T 1Z2, Canada
Navin Ramankutty
Authors
- Corey Lesk
- Pedram Rowhani
- Navin Ramankutty
Contributions
This research was designed and coordinated by N.R. All authors performed analyses, discussed the results, and wrote the manuscript.
Corresponding author
Correspondence toNavin Ramankutty.
Ethics declarations
Competing interests
The authors declare no competing financial interests.
Extended data figures and tables
Extended Data Figure 1 Distributions of individual responses to drought and extreme heat.
a–f, Histograms of disaster-year differences from means of 1,000 resampled controls for drought (n = 222) (a–c) and extreme heat (n = 32) (d–f). A preponderance of moderately negative values (falling towards the right of the red shaded areas) underlies the negative mean disaster year signals, with a limited influence of extreme cases (those at the left of the red shaded areas).
Extended Data Figure 2 The influence of sample size on estimated disaster effects.
a, b, Estimated mean 16-cereal aggregated production deficit for extreme heat (a) and drought (b) in 200 sub-samples with size of (1, 2, …, n) (points). Dotted grey line shows the final estimated mean production deficit (9.1% for extreme heat, 10.1% for drought). Most of the initial variability at low sample sizes dissipates into the mean at well below the actual sample size (n = 39 for extreme heat, n = 247 for drought).
Extended Data Figure 3 Seasonal weather anomalies of drought and extreme heat disasters in EM-DAT.
a–c, Normalized composite mean growing season temperature for extreme heat (n = 32) (a) and drought (n = 222) (b), and total precipitation for drought (c). Box plots depict the distributions of 1,000 false-disaster control composites, with red crosses denoting extreme outliers and red dashes denoting medians. Years with extreme heat correspond to seasonal temperature anomalies of 1.2 °C, while drought years have only 0.15 °C warmer temperatures, with no significant precipitation anomaly.
Extended Data Figure 4 Time series of the number of extreme heat and drought disasters per year from the EM-DAT database.
The EM-DAT database is based on a compilation of disaster reports gathered from various organizations including United Nations agencies, governments and the International Federation of Red Cross and Red Crescent Societies. The time series of reported disasters per year exhibits an increasing trend, probably the result of more complete disaster reporting in more recent decades with a possible contribution from increasing disaster incidence. There is also large inter-annual variability in the number of disasters.
Extended Data Table 1 Statistical significance of 16-cereal aggregate analysis
Extended Data Table 2 Sample sizes for individual crop and 16-cereal aggregate analyses
Extended Data Table 3 Statistical significance of regional analysis
Extended Data Table 4 Sample sizes for regional analysis
Extended Data Table 5 Statistical significance of individual crop analysis
Extended Data Table 6 Kruskal–Wallis assumptions test results for group comparison analyses
Related audio
Supplementary information
Supplementary Information (download PDF )
This file contains a Supplementary Discussion and additional references. We discuss the relative influence of larger and smaller EWD impacts, the effect of sample size, the implications of trends in the number of reported disasters per year, the application of comparative statistics and relevant assumptions, and the limitations of comparison to previous studies. (PDF 326 kb)
PowerPoint slides
Rights and permissions
About this article
Cite this article
Lesk, C., Rowhani, P. & Ramankutty, N. Influence of extreme weather disasters on global crop production.Nature 529, 84–87 (2016). https://doi.org/10.1038/nature16467
- Received: 29 April 2015
- Accepted: 16 November 2015
- Published: 06 January 2016
- Issue date: 07 January 2016
- DOI: https://doi.org/10.1038/nature16467
This article is cited by
Editorial Summary
Effects of extreme weather on crop yields
This statistical analyses of the effects of extreme weather disasters on global crop yields — derived from country-level agricultural statistics — shows that drought and extreme heat reduced national cereal yields by about 10% over the past five decades. No discernible effect was seen for floods and extreme cold at the national level; droughts affect yields and the harvested area, whereas extreme heat mainly affects yields.