Coevolution of genes and languages and high levels of population structure among the highland populations of Daghestan (original) (raw)
Abstract
As a result of the combination of great linguistic and cultural diversity, the highland populations of Daghestan present an excellent opportunity to test the hypothesis of language–gene coevolution at a fine geographic scale. However, previous genetic studies generally have been restricted to uniparental markers and have not included many of the key populations of the region. To improve our understanding of the genetic structure of Daghestani populations and to investigate possible correlations between genetic and linguistic variation, we analyzed ~550 000 autosomal single nucleotide polymorphisms, phylogenetically informative Y chromosome markers and mtDNA haplotypes in 21 ethnic Daghestani groups. We found high levels of population structure in Daghestan consistent with the hypothesis of long-term isolation among populations of the highland Caucasus. Highland Daghestani populations exhibit extremely high levels of between-population diversity for all genetic systems tested, leading to some of the highest _F_ST values observed for any region of the world. In addition, we find a significant positive correlation between gene and language diversity, suggesting that these two aspects of human diversity have coevolved as a result of historical patterns of social interaction among highland farmers at the community level. Finally, our data are consistent with the hypothesis that most Daghestanian-speaking groups descend from a common ancestral population (~6000–6500 years ago) that spread to the Caucasus by demic diffusion followed by population fragmentation and low levels of gene flow.
Introduction
The Caucasus region is characterized by extreme cultural and linguistic differentiation, with more than 50 autochthonous ethnic groups living in a small geographic area. The compact and very old branch of the Nakh–Daghestanian (ND) or East Caucasian linguistic family occupies most of Daghestan (the Russian republic comprising the eastern one-third of the Great Caucasus range). The Caucasus Mountains have long served as a crossroad connecting the Near East and the eastern European plains, and likely witnessed one of the initial expansions of agriculture from Mesopotamia to the north and northeast.1, 2, 3 The Caucasus highlands were uninhabitable until after the end of glaciation. Archaeological sites in Daghestan appear at nearly 2000 m in the Mesolithic (~10 000 BP), and provide evidence of continuous human occupation afterward.2, 4 One of the earliest Neolithic sites outside of Mesopotamia is found at Chokh in the eastern Daghestan (~8000 BP).2, 4 Its cultural continuity with the earlier Mesolithic strata suggests that plant and animal domestication spread to this region by diffusion rather than by population replacement.
The ancestral ND protolanguage is about 6000–8000 years old and has a reconstructable vocabulary consistent with the early Neolithic culture.1, 5, 6 The ND linguistic family is extremely diversified with some 30–35 daughter languages, and has never been found beyond the Caucasus highlands and highland/lowland interface.1, 6 Although specific language associations with Chokh cannot be demonstrated, the dispersal of ND likely dates to the early Neolithic in highland Daghestan. From the Mesolithic to historical times there is no archaeological or linguistic evidence pointing to migrations into the highlands. Thus, the great age and diversification among groups living in close proximity may well reflect expansion of the Neolithic through the highlands and its entrenchment there.7, 8 Although the highland populations have likely lived for hundreds of generations in relative isolation in the same region,2, 9, 10, 11 the North Caucasus plain has seen several spreads of steppe nomadic languages and cultures. The major known linguistic impacts on the Caucasus have been the Iranian arrival beginning in the second millennium BC, the movements of Bulgar and Khazar Turkic groups in the mid-first millennium AD, and the arrival of Kipchak Turkic groups in the late first millennium.
Daghestan, with its exceptional combination of linguistic, geographic and cultural diversity, presents an excellent natural laboratory for tracking the influence of demographic processes on patterns of genetic variation. Its compact distribution of deeply divergent languages provides a unique possibility to test gene–language coevolution at a fine scale and to illuminate the genomic footprint of events such as migration and admixture on genetic variation. However, most previous genetic studies either did not perform dense sampling of the region, or were limited to autosomal Alu insertion, autosomal short tandem repeat (STR), Y-chromosomal and mtDNA surveys.12, 13, 14, 15, 16, 17, 18, 19, 20, 21, 22, 23
In the present study, we gather dense single nucleotide polymorphism (SNP) data from the autosomes, as well as from both haploid regions of the genome in 21 Daghestani ethnic groups. This study was designed to (1) investigate the coevolution of genes and languages, comparing and contrasting patterns of linguistic, genetic and geographic variation among Daghestani populations, (2) examine similarities and differences in population differentiation among Daghestani ethnic groups and populations from Europe, the Near East, Central Asia and South Asia and (3) investigate congruence in patterns of genetic variation on the autosomes, Y chromosome and mtDNA.
Materials and methods
A total of 842 cheek swab samples from 21 ethnic Daghestani groups and cosmopolitan Chechens were collected from the volunteers with informed consent and approval of the IRB (Internal Review Board) of the University of Arizona. Armenian samples were collected by LY in Ararat Region, Armenia with a written consent form approved by the Institute of Molecular Biology, Yerevan, Armenia. All additional non-Daghestani samples were included in previous studies.24, 25 Fifteen highland Daghestani populations speak distinct languages that belong to the Daghestanian branch of the ND language family. Six lowland populations speak languages that are not members of ND (non-ND). Three ethnic groups of Daghestan (Kumyks, Nogais and Azerbaijans) speak languages of the Turkic language family. Ethnic Tats, Mountain Jews and a group of Azerbaijans speak languages belonging to the Iranian language branch of the Indo-European language family. Figure 1 shows the population locations. Additional information on sampling locations, sample and population sizes, and language classification is available in Supplementary Table 1. Two populations of Laks were combined for analyses because the lowland population in Novo-Churtakh represents recent migrants (~70 years) from the highland village Churtakh.26
Figure 1
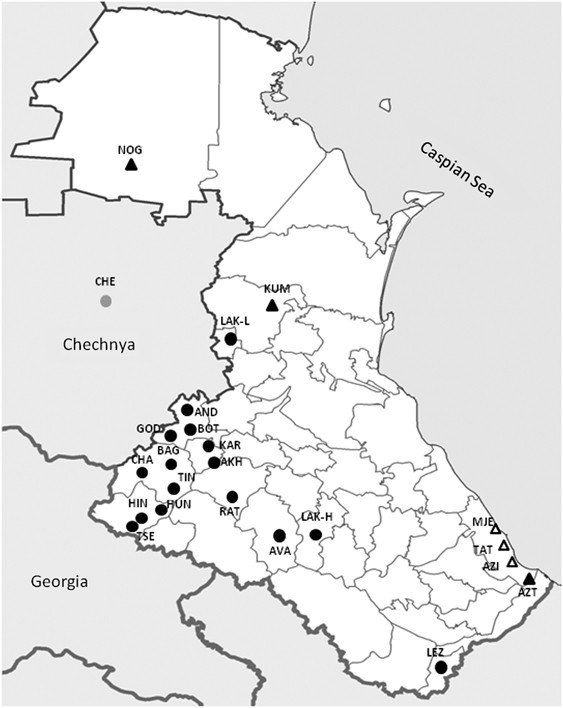
Approximate geographic location of sampling sites. Of the 22 Daghestani populations sampled here, 16 speak unique languages that are separate branch of the Nakh–Daghestanian (ND) language family (in black circles), three speak languages of the Turkic branch of Altaic language family (in black triangles) and three speak languages belonging to the Iranian language branch of the Indo-European language family (in open triangles). Chechens speak a language that belongs to Nakh branch of ND linguistic family (in grey circle). See Supplementary Table 1 for population codes.
Analyses of autosomal SNP data
A total of 314 samples from Daghestan and 261 samples from the Near East, Caucasus, Europe, South Asia and Central Asia (Supplementary Table 1) were genotyped for 567 096 SNPs on Affymetrix (Axiom, Santa Clara, CA, USA) platform using standard protocols. Details on the curation and public availability of these data are presented elsewhere.27 After removing close relatives, the total number of samples in our Axiom data set was 480 including 274 Daghestani samples. For several analyses we used SNPs from the intersection of our data with publicly available samples (Supplementary Table 1). The final merged data set resulted in 104 519 SNPs for 1141 individuals across 59 populations. The merged autosomal data set was used for Principle Components Analysis (PCA),28 multidimensional scaling (MDS) plots29 and ADMIXTURE analysis,30 for estimating diversity parameters and genetic differentiation indices by ARLEQUIN 3.5 software31 and SMARTPCA,28 and to infer population splits and migration events with the TreeMix (version 1.12) program.32
To estimate the effective population sizes and divergence time between populations, we evaluated the decay of linkage disequilibrium (LD) with recombination distance for each chromosome using the genotypic-based _r_2 statistic estimated in PLINK.33 Analyses of LD and IBD (identically by descent) were performed on full data set of 549 008 SNPs. See details in the recent study by Karafet et al.27 Divergence time between populations was estimated as _T=2N_e_F_ST, where _N_e is effective population size as the harmonic means between the two populations.[34](/articles/jhg2015132#ref-CR34 "McEvoy, B. P., Powell, J. E., Goddard, M. E. & Visscher, P. M. Human population dispersal "Out of Africa" estimated from linkage disequilibrium and allele frequencies of SNPs. Genome Res. 21, 821–829 (2011).") We ran GERMLINE 1.5.135 on the phased unpruned data with default parameters (-min_m 3 –bits 128 –err_hom 4 –err_het 1) to detect IBD pairwise segments sharing for all pairs of study samples (_N_=480). We divided the genome into non-overlapping 1 Mb blocks, removed blocks with <100 SNPs, and kept only the shared IBD segments whose length exceeded 3 Mb. We computed the mean length of IBD sharing among ND-speaking populations in the same way as Behar et al.36 Genetic distances based on IBD sharing were evaluated as D _ij_=1 – (X ij _/X_Max), where X ij is the total length of shared IBD segments between populations i and j, _X_Max is the maximum total length of shared IBD segments among ND populations.
Analyses of Y chromosome and mtDNA data
A total of 2461 samples belonging to 60 populations from Daghestan, Caucasus (Chechens and Armenians), Near East, Europe, Central Asia and South Asia were analyzed for 140 polymorphic sites from the non-recombining portion of the human Y chromosome (NRY) by allele-specific PCR or RFLP (Supplementary Table 2). NRY polymorphic sites included 137 published binary polymorphisms together with a set of three new SNPs: P323 (haplogroup C, G->A at position ChrY:14001179–14001179 (Homo sapiens Genome—Build 37)), P354 (haplogroup J, G->A, rs35874196) and P369 (haplogroup C, C->G at ChrY:23785261–23785261). Information on these polymorphisms was submitted to the International Society of Genetic Genealogy (http://www.isogg.org/tree/index.html). We use the mutation-based naming system that keeps the major haplogroup information followed by the name of the terminal mutation that defines a given haplogroup.37 Genotyping data resulted in 101 Y haplogroups, which are presented in Supplementary Table 2. We also analyzed 13 STRs: DYS19, DYS385a, DYS385b, DYS388, DYS389I, DYS389II, DYS390, DYS391, DYS392, DYS393, DYS426, DYS438 and DYS439 as described by Redd et al.38 Results are available upon request.
A total of 2164 samples were sequenced for mtDNA HVSI and typed for 45 coding region markers (Supplementary Table 3). Mitochondrial DNA hypervariable region I sequences are available in GenBank (accession numbers: KP883308–KP885623). For further genetic analyses, we included published data on additional samples from five European populations: Austrian, Bulgarian, Greek, French and Italian39, 40, 41, 42, 43 (Supplementary Table 1). mtDNA haplogroup results are presented in Supplementary Table 3. Population structure analyses were based on mtDNA haplotypes combining diagnostic SNPs in the coding regions and HVS-I variable sites except highly recurrent 16182C, 16183C, 16193.1C(C) and 16519 mutations.
Molecular diversity, population structure estimates and genetic distances between populations for NRY and mtDNA markers were computed using Arlequin v. 3.11.31
To standardize for different mutation rates we applied a measure of interlocus differentiation _G'_ST.44 Nonmetric MDS29 was performed on the _F_ST distances using the software package NTSYS.45 The program Network v. 4.5.1.6 (Fluxus Engineering; http://www.fluxus-engineering.com)46 was used to build Median-Joining network and to estimate the approximate age of paragroup J-M267* in Daghestan with ρ statistic.47 To evaluate the correlation among linguistic, geographic and genetic distances, Mantel tests were performed in Arlequin.
Phylogenetic analyses
We used the SplitsTree program48 to calculate language distances and to perform phylogenetic analyses of linguistic and genetic data. Trees were constructed with different techniques. Although the language tree was built on linguistic entries across the 21 languages in Daghestan, the autosomal, mtDNA and Y-chromosome trees were constructed from the matrices of population pairwise _F_ST genetic distances using the neighbor-joining method. Language distances were calculated on 85 wordlist characters: most of the words are from items 1 to 40 and 56 to 100 in the stability-ranked Swadesh list of the Automated Similarity Judgment Program;49 and 12 other words were cultural terms. For Mountain Jews and Iranian-speaking Azerbaijans we have used Tat and Persian languages, respectively, as proxies.
Results
Relationships among Daghestani and neighboring populations
To explore regional relationships, MDS based on autosomal, Y-chromosome STR and mtDNA data was performed on Daghestani ethnic groups along with populations from the Caucasus, Central Asia, Europe, the Near East and South Asia (Figures 2a–c). Although populations are roughly clustered according to their geographic regions, the patterning within and between groups is quite distinctive for three different sets of markers. Autosomal and Y chromosome markers reveal relatively distinct geographic clusters with partial overlap between Daghestani, the Caucasus and Near Eastern populations. In contrast, MDS plot based on mtDNA shows that European populations are intermingled with a group of Daghestani, the Caucasus and Near Eastern populations. In all three plots Daghestani non-ND populations (Kumyks, Nogais, Azerbaijans, Tats and Mountain Jews) are generally found within the Near Eastern and/or Caucasus clusters, whereas ND populations always form very loose but distinct clusters with several outlier populations.
Figure 2
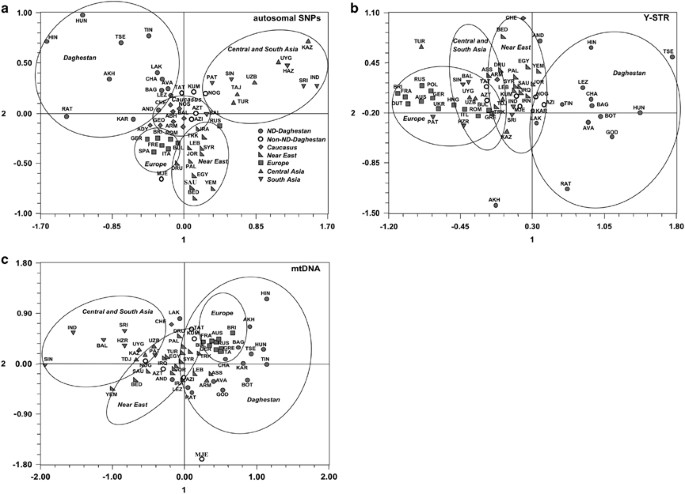
MDS plot constructed on the _F_ST distances (a) 107 079 autosomal SNPs, stress=0.17, _r_=0.95; (b) 13 Y-chromosome STRs, stress=0.16, _r_=0.94; (c) mtDNA SNPs from coding and HVS1 regions, stress=0.15, _r_=0.94.
We applied PCA on the merged autosomal data set using a ‘drop one in’ procedure for incorporating populations50 (Supplementary Figure 1). It was shown that if there is a group of people within a population with excess relatedness (as expected in isolated Daghestani populations), standard PCA will separate such a group from the rest of the sample even if the group is from the same population.50 ‘Drop one in’ procedure helps to avoid the potential effect of high relatedness among the individuals in Daghestani isolate populations and uneven sample sizes.50 ‘Drop one in’ PCA analysis was performed for each individual from a Daghestani population isolate along with all other samples. Each population isolate sample’s resultant PC coordinates for the first two components were then plotted together along with the average PC coordinates for other samples across all runs. In general, the resulting PCA plot separates regional populations according to their geographical location (Supplementary Figure 1). The first PC splits the Near Eastern, Caucasus and European populations from Asians, whereas the second component subdivides Near Eastern, Caucasus and European groups. Daghestani populations (other than Nogais and Mountain Jews) are intermingled with other groups from the Caucasus. Consistent with their origin, Nogais demonstrate a genetic resemblance with Central Asian populations, whereas Mountain Jews are extended toward Near Eastern populations. Turks and Iranians are drawn toward populations from Daghestan, in particular, to Azerbaijans and Tats.
We employed an unsupervised STRUCTURE-like approach30 to estimate individual ancestry in K hypothetical ancestral populations. Yoruba and Han Chinese were included in this analysis. The best projecting accuracy was observed for a model with _K_=8. Consistent with PCA analysis, Daghestani and Caucasus groups are nearly indistinguishable at _K_=3 except Nogais, who share a higher Asian ancestral component (Supplementary Figure 2). At _K_=5,6 ND populations differentiate from non-ND and other Caucasus groups. With _K_=7,8 three ND-speaking populations (Hinukh, Hunzib and Tsez) became dominated by one single ancestry component and three other populations (Akhvakh, Ratlub and Tindal) by another component.
To infer the history of population splitting and mixing in the ancestry of ND groups we built a tree using TreeMix.32 With no admixture events the maximum-likelihood population tree places all ND populations in one cluster accompanied by non-ND populations and other ethnic groups from the Caucasus (Supplementary Figure 3a). Allowing 10 admixture events (Supplementary Figure 3b) find evidence of admixture mostly between and within Central Asian and South Asian regions. No sign of migration edges was observed from any population to ND ethnic groups. We applied the three-population f3-test to each of the 56 populations (Supplementary Table 4). This analysis was introduced by Reich et al.51 to determine evidence of admixture for the Test population. A significantly negative value of the f3 statistic implies that population is admixed. Among Daghestani populations the most negative statistics were found for Nogais and Kumyks taking as the reference populations Kazakhs and Georgians. The majority of ND populations do not produce any negative f3 assuming low admixture or substantial post-admixture drift.52
Distribution of NRY and mtDNA haplogroups
NRY haplogroups are presented in Supplementary Table 2. Y chromosome haplogroup distributions and frequencies differ strikingly between the highland ND and lowland non-ND populations. As a whole, the highland ND group exhibits 18 NRY haplogroups, but only four haplogroups are observed with frequencies >2%. Together these four haplogroups account for more than 89% of ND Y-chromosomes. Haplogroup J-M267(xL136) is found in all ND populations, ranging from 40% in Lezgin to 100% in Hunzib and Tsez populations with an average of 58%. Interestingly, this haplogroup is rare in major geographic regions (0.2–2%), achieving noticeable occurrence only in lowland non-ND populations (16.3%), in Chechens (8.3%) and Armenians (7.5%) from the Caucasus, Assyrians (7.1%) and Iranians (6.9%) from the Near East. Haplogroup R-L23(xP310) is present in 9 out of 15 ND populations with the average incidence of 7.8%. Haplogroup R-L23 was found at low frequencies (4–10%) in the Near East, Europe, and non-ND populations with the highest frequencies in Assyrians (29%), Tats (29%), Turks (15%) and Russians (13%). Two haplogroups, G-U1(xL78) and R-Z93, were observed in ND populations with low incidence of 3.5% and 2.3%, respectively. Outside of Daghestan, haplogroup G-U1(xL78) was found in Armenians (5%), Turks (3.8%) and Palestinians (1%) with low frequencies of 1–5%. Haplogroup R-Z93 is observed at moderate occurrence in South Asia (25%) and Central Asia (18%), and at low frequencies in the Near East (3.9%) and Europe (1.7%). Contrary to the NRY, the distributions of mtDNA haplogroups are similar in highland ND and lowland non-ND populations except for relatively high frequency of the U4 haplogroup in ND populations (9.69%) (Supplementary Table 3). Both ND and non-ND populations also resemble our samples from the Near East and Europe in their frequencies of common haplogroups H and T.
Congruence in patterns of genetic variation on the NRY, mtDNA and autosomes
We assessed associations between autosomal, Y-chromosomal and mitochondrial population structure of Daghestan by correlating matrices of genetic distances for two population sets: 19 Daghestani populations and 13 ND-speaking groups. Botlikh and Godoberi were omitted from these analyses as they were not genotyped for autosomal SNPs. For Y-chromosomal data we employed distances based on Y-STR frequencies because a single Y-chromosome haplogroup is prevalent in Daghestan. No significant correlations were found between Y-chromosome and mtDNA structure for both data sets (_r_=0.12, _P_=0.205; _r_=0.21, _P_=0.118 for 19 and 13 populations, respectively). However, we identified significant simple and partial correlations between distances based on autosomal versus Y-chromosome (_r_=0.53, _P_=0.005) and autosomal versus mtDNA population structure (_r_=0.41, _P_=0.01) for 19 populations from Daghestan. When only ND populations were considered, correlations continued to be positive; however, it was significant for autosomal and Y-STR data (simple correlation: _r_=0.48, _P_=0.024, partial correlation: _r_=0.45, _P_=0.032), but not statistically significant for autosomal versus mtDNA data (simple correlation: _r_=0.27, _P_=0.083; partial correlation when Y STRs held constant: _r_=0.19, _P_=0.164).
Population differentiation and genetic diversity
We investigated parameters of genetic diversity in Daghestani populations and compared the values with those for Caucasus, Near Eastern, European, Central Asian and South Asian populations. Diversity statistics based on autosomal, NRY and mtDNA data are given in Supplementary Table 5. Average gene diversity for three systems exhibited a similar pattern with the lowest values in Daghestan, particularly in populations of highland ND language speakers (highly significant for mtDNA and Y chromosome (P<0.0001), but not significant for autosomal SNPs).
To address the question of population differentiation we employed AMOVA (analysis of molecular variance) analyses. The _F_ST values for the Daghestani populations were 0.017, 0.146, 0.155 and 0.075 for autosomal, Y-SNP, Y-STR and mtDNA data, correspondingly, indicating a significant degree of population differentiation within Daghestan (Table 1). When only ND populations were included in analyses, the _F_ST estimates increased by 7–18% for different genetic systems except Y chromosome haplogroups. These values are higher than _F_ST in the Near East, Europe, Central Asia, South Asia, approaching our global _F_ST values of 0.018, 0.112 and 0.069 based on autosomal data, Y-chromosome STRs and mtDNA polymorphisms typed in ~1100–2400 individuals from 55 to 60 global populations. An analysis of molecular variance illustrates that the Y-chromosome STRs (_F_ST=0.174) have markedly higher variation among ND populations than mtDNA (_F_ST=0.081). The trend holds, when distances are standardized for the different mutation rates. Y-chromosome STRs (_G'_ST=0.978) showed noticeably higher population structure than mtDNA (_G'_ST=0.435) with an intermediate value for autosomal markers (_G'_ST=0.627).
Table 1 Analysis of Molecular Variance
Associations between linguistic, genetic and geographic distances
The language tree based on wordlist data (Figure 3a) and genetic tree (Figure 3b) based on autosomal data have several structural similarities. They separate the ND-speaking from the Turkic and Iranian-speaking Daghestani groups. Both trees show Lezgin as the first branch off the ND languages, strong clustering is observed for the Tsezic-speaking populations Hinukh, Tsez and Hunzib, and a close relationship is found between Bagvalin and Tindal. Trees constructed on NRY and mtDNA data show a general lack of correspondence with the language tree (trees not shown).
Figure 3
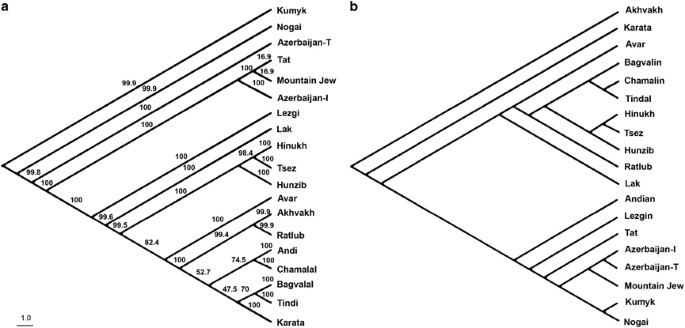
Phylogenetic trees based on (a) language data. Language names were taken from the journal Languages of the Caucasus (http://escholarship.org/uc/languagesofcaucasus), (b) autosomal SNP data. The numbers at the branches on the language tree are confidence values based on bootstrap method (_N_=10 000).
To assess the effect of geography and languages on the genetic structure of ND populations we applied partial and multiple Mantel tests. In view of the mountainous Daghestan landscape we explored the correspondence between genetics based on autosomal SNPs, language and geographic distances computed as (a) a great circle distance based on GPS coordinates, (b) the distance based on altitude, latitude and longitude and (c) the shortest distance by existing automobile roads. All three geographic distances showed no significant correlation with genetics but highly significant association with languages (data not shown). Further Mantel tests were performed with geographic distances as a great circle distance (Table 2). Genetic distances calculated with NRY and mtDNA markers uncovered no significant full or partial correlation with linguistic or geographic distances either for 21 Daghestani populations or for ND-speaking groups. Strong genetic drift and founder effects acting on uniparental markers tend to increase genetic distances, and to exaggerate the time of divergence among populations, and to possibly obscure correlations between gene and language distances. Analyses of multiple autosomal markers increase statistical inference power and provide an access to patterns of demographic processes over much deeper timescales. Genetic distances among ND populations based on autosomal SNPs show high, but not significant association with languages (_r_=0.343, _P_=0.061), but not with geography (_r_=0.029, _P_=0.434), possibly because of a small number of populations. Partial correlation of genetics with languages revealed a very strong significant positive association among ND populations (_r_=0.428, _P_=0.015) when controlling for geography, and a negative correlation with geography after removing the effects of the linguistic variables. When we combined ND and non-ND populations of Daghestan, no correlation of genetics with geography or languages was observed.
Table 2 Mantel test results for linguistic, geographic and genetic data
We also explored the effect of recent ancestry and migration on the association among genetic, linguistic and geographic distances employing genetic distances calculated on IBD sharing. Genetic distances were calculated on IBD segments >3 Mb (assuming common ancestry ~400 years ago) shared among ND populations. Genetic distances based on IBD sharing have a very strong positive correlation with languages and geography (_r_=0.516, P<0.001; _r_=0.480, P<0.001, respectively). Partial correlation remained significant with languages (_r_=0.306, _P_=0.012), but not with geography (_r_=0.222, _P_=0.059) (Table 2).
Time of ND population divergence and TMRCA for J-M267* haplotypes
We calculated population divergence time T F based on N e and _F_ST information. Inter-population T F values were used to construct a neighbor-joining phylogenetic tree for indigenous populations from Daghestan, Europe, Near East and Central Asia (Figure 4). The tree provides clear separation of geographic groupings with ND populations as a distinctive cluster. The average T F estimates of the most diverged ND populations—Hinukh and Hunzib from the closest branch of the combined European and Near Eastern populations—is ~6 KYA. We also estimated the age of paragroup J-M267* in Daghestan. Though very rare outside Daghestan, paragroup J-M267* is by far the major Y-haplogroup in ND males. This paragroup can be likely associated with very early population movements into the Daghestani highlands. We constructed a network for haplogroup J-M267* in Daghestani populations. The genealogy of the Y chromosome genetic pool shows a star-like pattern with an abundance of reticulations (tree not shown). This feature supports a demic expansion from ancestral haplotypes currently shared by people of Daghestan. We obtained the time estimate for the radiation of the paragroup J-M267* of 6650 years (±1430 years) using ρ statistic and evolutionary mutation rate of 6.9 × 10⁻⁴ per 25 years.53 Pedigree mutation rates, which greatly underestimate TMRCA, are not suitable for evolutionary studies.54
Figure 4
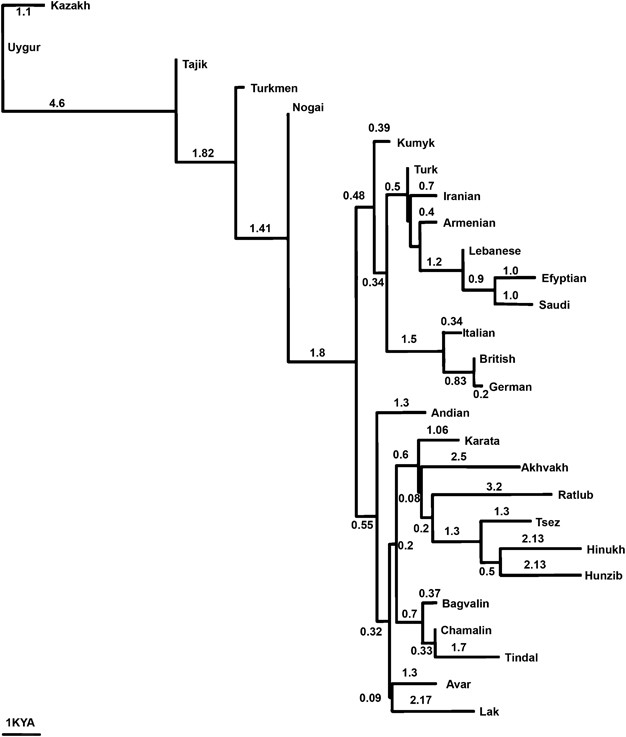
Neighbor-joining tree (NJ) constructed on T F divergence time. T F is estimated from genetic distance classes 0.005–0.25 cM. Branch length is proportional to divergence times in thousand years ago. European, Near Eastern, Central Asian and indigenous Daghestani populations were included in the NJ tree. NJ tree was generated using SplitsTree program.
Discussion
Daghestan, particularly its mountainous area, is one of the few places on earth with exceptionally high linguistic density and diversity. Typical highland social structure is rooted in the mountainous topography and land scarcity.10 The traditional economy was always dominated by sheep and goat pastoralism, terrace agriculture and horticulture. Daghestani clans (tukhums) typically consist of some 60–80 related families living in the same village. Small clans sometimes are united into larger settlements commonly on a linguistic or ethnic basis.10 To keep land and property in the community, marriages traditionally arranged by families were usually clan- and village-endogamous. Both men and women inherited a portion of land as well as movable possessions. Small villages were typically associated with an adjacent town that was essentially a city–state with its own language, traditional constitution, customary law and leadership.10, 11 Impoverishment of the highland economy and settlement in the lowlands began during the peak of the Little Ice Age (17th–18th centuries). Resettlement, both forced and economically driven, increased after the Russian conquest of the Caucasus in 19th century and, particularly, in the 20th century. However, relocation rarely led to assimilation or cultural amalgamation. Highlanders moving to lowland rural areas tended to remain compactly settled, and typically maintained close ties with their traditional villages and clans.55, 56
The working-age male population in highland Daghestan was transhumant, with men spending several months in lowland winter pastures or working in cities. Highlanders regularly learned lowland languages for economic purposes, and often also intervening foothill languages, but lowlanders rarely traveled uphill and almost never learned highland languages. As a consequence, language influence spread uphill, with highlanders sometimes shifting to lowland dialects or languages but almost never vice versa. This asymmetrical vertical bilingualism was universal in Daghestan.1, 6, 57
In this genetic study, which is the largest such study of Daghestani populations to date, we investigated biparental and uniparental genetic markers from 21 ethnic groups to measure the extent of genetic differentiation and isolation among Daghestani ethnic groups, as well as associations between genetic, linguistic and geographic variation. We found that reduced genetic diversity and strong differentiation prevail among ND populations relative to non-ND and other continental groups for all genetic markers: autosomal, NRY and mtDNA (Table 1, Supplementary Table 5). The large genetic distances among ND populations are also apparent in all three MDS plots (Figures 2a–c). These results are consistent with study of autosomal STR data in small number of Daghestani populations (four ND and two non-ND populations).15 Our recent work demonstrated that ND-speaking populations are characterized by exceptionally elevated coefficients of inbreeding, very high numbers and long lengths of Runs of Homozygosity, and elevated linkage disequilibrium compared with surrounding groups from the Caucasus, Near East, Europe, Central Asia and South Asia.27 It was also shown that inbreeding and long-standing small effective population sizes have most likely been a common feature in Daghestan over a sustained period. Consistent with long-term isolation we observed no signal of admixture in ND highland populations today (Supplementary Figure 3, Supplementary Table 4).
A previous study of Daghestani populations reported a reduction of genetic diversity in the NRY haplogroups among highland populations compared with mtDNA diversity, suggesting the effects of a patrilocal mating system.17 Under patrilocality the same pattern of reduced diversity would be expected for Y-STR haplotypes. Nevertheless, heterozygosity based on Y-STR haplotypes (0.911) proves to be only slightly and insignificantly lower than mtDNA heterozygosity (0.916) in highland ND populations. A high frequency of a single haplogroup J-M267(xL136) limits the accuracy of any parameters based on NRY haplogroups and explains drastic reduction of Y-chromosome diversity in Daghestan (Supplementary Tables 2 and 5). Unlike other populations in the Caucasus, marriages in highland Daghestan are traditionally endogamous along both parental descent lines and also by village and often by social class.10, 15 The marriages in highland Daghestan can be called patrilocal only at the family level because a bride moves to husband’s house within the same village. Marriages with outsiders happened, but they were rare, occurring chiefly in smaller societies under demographic stress (for example, deportations and resettlements) and with increased inter-ethnic contact (for example, improved roads and transport). _F_ST and _G'_ST parameters reveal twofold higher variation for NRY STRs than for mtDNA among ND populations (Table 1). The larger variation among populations for the Y chromosome in many geographic regions including Caucasus is usually attributed to a higher female than male migration rate due to patrilocality.17, 18, 58 On the other hand, males and females can differ not only in their pattern of migration, but also in their effective population sizes. Several studies suggest that sex-specific processes throughout paternal and maternal history indicate consistently larger effective population sizes for females than for males, which are roughly half that of females.59, 60, 61 Higher variance of male reproductive success, existence of polygyny and warfare with high male mortality rates may have produced different male versus female demographic histories in the Daghestani highlands. Thus, it is not surprising that no significant correlation was observed between the mtDNA and Y-chromosome distance matrices. In contrast, autosomal variation is structured by both male and female ancestry (correlation coefficients _r_=0.48, _P_=0.024 and _r_=0.27, _P_=0.083 correspond to autosomal/Y-STR and autosomal/mtDNA data, respectively), whereas evidence for association is weaker for mtDNA data.
Genetic, geographic and linguistic associations were previously investigated in the Caucasus based on NRY, mtDNA and autosomal (Alu or STRs) data.12, 17, 18, 20, 22 These data produced very inconsistent and controversial results. Some studies have shown that neither geography nor linguistics have had a strong influence on the genetic structure.19 Geography, rather than language, was claimed to provide a better explanation for the observed genetic structure by the majority of studies,16, 18, 20, 22 while parallel evolution of Y chromosome and language variation was supported by Balanovsky et al.12 We suggest that part of the explanation for these diverse conclusions came from differences in sampling schemes. Sampling of a few geographically sparse populations speaking languages from different linguistic families is not sensitive to the recent demographic history of the population and prevents successful fitting of linguistic and genetic structure. To model interactive historical processes such as the developmental cycles of villages, and language speciation, our genetic and linguistic sampling has focused at the community scale. We found no correlation between genetic and geographic distances (vertical, linear or along car roads). The latter result is expected given that isolation by distance can hardly be achieved in Daghestan due to high isolation and the extremely low gene flow between communities resulting from endogamous marriage rules and social structure in highland Daghestan. The observed correlation between geography and genetic distances calculated on the basis of IBD segments >3 Mb (and the assumption of common ancestry ~400 years ago) might reflect the beginning of forced resettlements of traditional highland villages.55, 56
We also did not observe a gene–language association when all Daghestani populations were taken into account (Table 2). However, we found high, although not significant positive correlation between linguistic and genetic distances based on autosomal data (_r_=0.343, _P_=0.061) when only highland ND populations were considered. Human genetic and linguistic diversity can be correlated either through a direct link, when linguistic and genetic affiliations reflect the same historical population processes, or an indirect one, where the evolution of genetic and linguistic diversity is independent but conditioned by another factor (for example, the same geographical factors). By controlling for geography, we can test for a residual relationship between linguistic and genetic affiliations.62 Our finding of a stronger significant correlation between linguistic and genetic variation when geography was held constant (_r_=0.428, _P_=0.015) for ND populations provides evidence that language and genetic variation in highland Daghestan have actually evolved together. To verify that the language–gene association could have emerged within the time frame as farming spread to pre-existing Mesolithic populations in Daghestan, we determined the divergence time for the Daghestani branch of the ND linguistic family based on autosomal and NRY data; our calculation is ~6–6.5 KYA, which is consistent with the timing of the Proto–Daghestanian language dispersal.1 Interestingly, that despite the great age of the ND language family and some of the highland villages, the internal ages of the major branches of ND are generally shallow (Figure 4), probably reflecting the latest phase of uphill language spreading.
In summary, our study reveals that Daghestanian speakers are most likely descendants of the earliest farming communities in the Caucasus. Proto–Nakh–Daghestanian appears to have diversified and taken root in the eastern Caucasus foothills and highlands as an early consequence of the initial spread of agriculture from Mesopotamia. Linguistic and genetic correlation are consistent with the scenario that most Daghestanian-speaking groups descend from a common ancestral population that spread into the Caucasus by demic diffusion with subsequent relative sedentism and low levels of gene flow in the last few thousand years.62 The combination of geography and endogamy in the highland Caucasus has produced a highly structured population exhibiting great linguistic diversity, with genetically isolated societies existing more or less autonomously within a relatively small geographic territory.
Accession codes
Accessions
GenBank/EMBL/DDBJ
References
- Nichols, J. in The Black Sea FloodQuestion: Changes in Coastline, Climate, and Human Settlement (eds Yanko-Holmbach, V., Gilbert, A. S., Panin, N. & Dolukhanov, P. M.) 775–796 (Springer, Dordrecht, 2007).
- Gadzhiev, M. G., Davudov, O. M. & Shikhsaidov, S. M. in The History of Dagestan, (Nauka, Moscow, 1996).
Google Scholar - Zohary, D., Hopf, M. & Weiss, E. in Domestication of Plants in the Old World, (Oxford University Press, Oxford, 2012).
Book Google Scholar - Kotovich, V. G. & Sheikhov, N. B. in Uchenye Zapiski IIYaL Dagestan Filial AN SSSR IIYaL Scientific Transections Dagestan Filial Acad. Nauk SSSR Vol. 8, (IIYaL, Makhachkala, 1964).
Google Scholar - Nichols, J. The origin of the Chechen and Ingush: a study in alpine linguistic geography. Anthropol. Linguist. 46, 129–155 (2005).
Google Scholar - Nichols, J . in Proceedings of the 37th Annual Meeting of the Berkeley Linguistics Society: Special Session on Languages of the Caucasus (eds Cathcart, C., Kang, S. & Sandy, C. S.) 68–80 (Berkeley Linguistics Society, Berkeley, 2013).
Google Scholar - Cavalli-Sforza, L. L., Piazza, A., Menozzi, P. & Mountain, J. Reconstruction of human evolution: bringing together genetic, archaeological, and linguistic data. Proc. Natl Acad. Sci. USA 85, 6002–6006 (1988).
Article CAS PubMed PubMed Central Google Scholar - Diamond, J. & Bellwood, P. Farmers and their languages: the first expansions. Science 300, 597–603 (2003).
Article CAS PubMed Google Scholar - Bulayeva, K. B., Dubinin, N. P., Shamov, I. A., Isaichev, S. A. & Pavlova, T. A. Population genetics of Dagestan highlanders. Genetika 21, 1749–1758 (1985).
Google Scholar - Aglarov, M. A. in Rural Society in Mountainous Daghestan in XVII - the Beginning XIX Century, (Nauka, Moscow, 1988).
Google Scholar - Aglarov, M. A . in 12th International Congress of Anthropological and Ethnological Sciences, (Springer, Zagreb, 1988).
Google Scholar - Balanovsky, O., Dibirova, K., Dybo, A., Mudrak, O., Frolova, S., Pocheshkhova, E. et al. Parallel evolution of genes and languages in the Caucasus region. Mol. Biol. Evol. 28, 2905–2920 (2011).
Article CAS PubMed Google Scholar - Bulayeva, K., Jorde, L. B., Ostler, C., Watkins, S., Bulayev, O., Harpending, H. et al. Genetics and population history of Caucasus populations. Hum. Biol. 75, 837–853 (2003).
Article PubMed Google Scholar - Bulayeva, K. B., Davudov, O. M., Pavlova, T. A., Kurbanov, R. M., Bulaev, O. A., Harpending, H. et al. Genetic subdivision of Dagestan ethnic populations. Genetika 39, 83–92 (2003).
Google Scholar - Bulayeva, K. B., Jorde, L., Watkins, S., Ostler, C., Pavlova, T. A., Bulayev, O. A. et al. Ethnogenomic diversity of Caucasus, Daghestan. Am. J. Hum. Biol. 18, 610–620 (2006).
Article CAS PubMed Google Scholar - Caciagli, L., Bulayeva, K., Bulayev, O., Bertoncini, S., Taglioli, L., Pagani, L. et al. The key role of patrilineal inheritance in shaping the genetic variation of Dagestan highlanders. J. Hum. Genet. 54, 689–694 (2009).
Article PubMed Google Scholar - Marchani, E. E., Watkins, W. S., Bulayeva, K., Harpending, H. C. & Jorde, L. B. Culture creates genetic structure in the Caucasus: autosomal, mitochondrial, and Y-chromosomal variation in Daghestan. BMC Genet. 9, 47 (2008).
Article PubMed PubMed Central Google Scholar - Nasidze, I., Ling, E. Y., Quinque, D., Dupanloup, I., Cordaux, R., Rychkov, S. et al. Mitochondrial DNA and Y-chromosome variation in the Caucasus. Ann. Hum. Genet. 68, 205–221 (2004).
Article CAS PubMed Google Scholar - Nasidze, I., Risch, G. M., Robichaux, M., Sherry, S. T., Batzer, M. A., Stoneking, M. et al. Alu insertion polymorphisms and the genetic structure of human populations from the Caucasus. Eur. J. Hum. Genet. 9, 267–272 (2001).
Article CAS PubMed Google Scholar - Nasidze, I., Sarkisian, T., Kerimov, A. & Stoneking, M. Testing hypotheses of language replacement in the Caucasus: evidence from the Y-chromosome. Hum. Genet. 112, 255–261 (2003).
PubMed Google Scholar - Tofanelli, S., Ferri, G., Bulayeva, K., Caciagli, L., Onofri, V., Taglioli, L. et al. J1-M267 Y lineage marks climate-driven pre-historical human displacements. Eur. J. Hum. Genet. 17, 1520–1524 (2009).
Article PubMed PubMed Central Google Scholar - Yunusbayev, B., Metspalu, M., Järve, M., Kutuev, I., Rootsi, S., Metspalu, E. et al. The Caucasus as an asymmetric semipermeable barrier to ancient human migrations. Mol. Biol. Evol. 29, 359–365 (2011).
Article PubMed Google Scholar - Xing, J., Watkins, W. S., Witherspoon, D. J., Zhang, Y., Guthery, S. L., Thara, R. et al. Fine-scaled human genetic structure revealed by SNP microarrays. Genome Res 19, 815–825 (2009).
Article CAS PubMed PubMed Central Google Scholar - Karafet, T. M., Zegura, S. L., Posukh, O., Osipova, L., Bergen, A., Long, J. et al. Ancestral Asian source(s) of new world Y-chromosome founder haplotypes. Am. J. Hum. Genet. 64, 817–831 (1999).
Article CAS PubMed PubMed Central Google Scholar - Hammer, M. F., Karafet, T. M., Redd, A. J., Jarjanazi, H., Santachiara-Benerecetti, S., Soodyall, H. et al. Hierarchical patterns of global human Y-chromosome diversity. Mol. Biol. Evol. 18, 1189–1203 (2001).
Article CAS PubMed Google Scholar - Bulayeva, K. B., Kurbatova, O. L., Pavlova, T. A., Guseǐnov, G. G., Bodia, I. E., Charukhilova, S. M. et al. Genetic-demographic study of mountain populations from Dagestan and their migrants to the lowlands. Comparison of basic parameters of fitness. Genetika 31, 1300–1307 (1995).
Google Scholar - Karafet, T. M., Bulayeva, K. B., Bulayev, O. A., Gurgenova, F., Omarova, J., Yepiskoposyan, L. et al. Extensive genome-wide autozygosity in the population isolates of Daghestan. Eur. J. Hum. Genet. 23, 1405–1412 (2015).
Article CAS PubMed PubMed Central Google Scholar - Patterson, N., Price, A. L. & Reich, D. Population structure and eigenanalysis. PLoS Genet. 2, e190 (2006).
Article PubMed PubMed Central Google Scholar - Kruskal, J. B. Multidimensional scaling by optimizing goodness of fit to a nonmetric hypothesis. Psychometrika 29, 1–27 (1964).
Article Google Scholar - Alexander, D. H., Novembre, J. & Lange, K. Fast model-based estimation of ancestry in unrelated individuals. Genome Res. 19, 1655–1664 (2009).
Article CAS PubMed PubMed Central Google Scholar - Excoffier, L. & Lischer, H. E. Arlequin suite ver 3.5: a new series of programs to perform population genetics analyses under Linux and Windows. Mol. Ecol. Resour. 10, 564–567 (2010).
Article PubMed Google Scholar - Pickrell, J. K. & Pritchard, J. K. Inference of population splits and mixtures from genome-wide allele frequency data. PLoS Genet. 8, e1002967 (2012).
Article CAS PubMed PubMed Central Google Scholar - Purcell, S., Neale, B., Todd-Brown, K., Thomas, L., Ferreira, M. A., Bender, D. et al. PLINK: a tool set for whole-genome association and population-based linkage analyses. Am. J. Hum. Genet. 81, 559–575 (2007).
Article CAS PubMed PubMed Central Google Scholar - McEvoy, B. P., Powell, J. E., Goddard, M. E. & Visscher, P. M. Human population dispersal "Out of Africa" estimated from linkage disequilibrium and allele frequencies of SNPs. Genome Res. 21, 821–829 (2011).
Article CAS PubMed PubMed Central Google Scholar - Gusev, A., Lowe, J. K., Stoffel, M., Daly, M. J., Altshuler, D., Breslow, J. L. et al. Whole population, genome-wide mapping of hidden relatedness. Genome Res. 19, 318–326 (2009).
Article CAS PubMed PubMed Central Google Scholar - Behar, D. M., Metspalu, M., Baran, Y., Kopelman, N. M., Yunusbayev, B., Gladstein, A. et al. No evidence from genome-wide data of a Khazar origin for the Ashkenazi Jews. Hum. Biol. 85, 859–900 (2013).
Article PubMed Google Scholar - Karafet, T. M., Mendez, F. L., Meilerman, M. B., Underhill, P. A., Zegura, S. L., Hammer, M. F. et al. New binary polymorphisms reshape and increase resolution of the human Y chromosomal haplogroup tree. Genome Res. 18, 830–838 (2008).
Article CAS PubMed PubMed Central Google Scholar - Redd, A. J., Agellon, A. B., Kearney, V. A., Contreras, V. A., Karafet, T., Park, H. et al. Forensic value of 14 novel STRs on the human Y chromosome. Forensic Sci. Int. 130, 97–111 (2002).
Article CAS PubMed Google Scholar - Dubut, V., Chollet, L., Murail, P., Cartault, F., Béraud-Colomb, E., Serre, M. et al. mtDNA polymorphisms in five French groups: importance of regional sampling. Eur. J. Hum. Genet. 12, 293–300 (2004).
Article CAS PubMed Google Scholar - Irwin, J., Saunier, J., Strouss, K., Paintner, C., Diegoli, T., Sturk, K. et al. Mitochondrial control region sequences from northern Greece and Greek Cypriots. Int. J. Legal Med. 122, 87–89 (2008).
Article PubMed Google Scholar - Karachanak, S., Carossa, V., Nesheva, D., Olivieri, A., Pala, M., Hooshiar Kashani, B. et al. Bulgarians vs the other European populations: a mitochondrial DNA perspective. Int. J. Legal Med. 126, 497–503 (2012).
Article PubMed Google Scholar - Kloss-Brandstatter, A., Schäfer, G., Erhart, G., Hüttenhofer, A., Coassin, S., Seifarth, C. et al. Somatic mutations throughout the entire mitochondrial genome are associated with elevated PSA levels in prostate cancer patients. Am. J. Hum. Genet. 87, 802–812 (2010).
Article PubMed PubMed Central Google Scholar - Ottoni, C., Martinez-Labarga, C., Vitelli, L., Scano, G., Fabrini, E., Contini, I. et al. Human mitochondrial DNA variation in Southern Italy. Ann. Hum. Biol. 36, 785–811 (2009).
Article PubMed Google Scholar - Hedrick, P. W. A standardized genetic differentiation measure. Evolution 59, 1633–1638 (2005).
Article CAS PubMed Google Scholar - Rohlf, F. J. in NTSYS-pc: Numerical Taxonomy and Multivariate Analysis System, (Exeter Publishing, Setauket, New York, 1998).
Google Scholar - Bandelt, H. J., Forster, P. & Rohl, A. Median-joining networks for inferring intraspecific phylogenies. Mol. Biol. Evol 16, 37–48 (1999).
Article CAS PubMed Google Scholar - Cox, M. P. Accuracy of molecular dating with the rho statistic: deviations from coalescent expectations under a range of demographic models. Hum. Biol. 80, 335–357 (2008).
Article PubMed Google Scholar - Huson, D. H. & Bryant, D. Application of phylogenetic networks in evolutionary studies. Mol. Biol. Evol. 23, 254–267 (2006).
Article CAS PubMed Google Scholar - Holman, E. W.,Wichmann,S.,Brown,C. H.,Velupillai,V.,Müller,A. & Bakker,D. Explorations in automated language classification. Folia Linguist. 42, 331–354 (2008).
Article Google Scholar - Veeramah, K. R., Tönjes, A., Kovacs, P., Gross, A., Wegmann, D., Geary, P. et al. Genetic variation in the Sorbs of eastern Germany in the context of broader European genetic diversity. Eur. J. Hum. Genet. 19, 995–1001 (2011).
Article PubMed PubMed Central Google Scholar - Reich, D., Thangaraj, K., Patterson, N., Price, A. L. & Singh, L. Reconstructing Indian population history. Nature 461, 489–494 (2009).
Article CAS PubMed PubMed Central Google Scholar - Lazaridis, I., Patterson, N., Mittnik, A., Renaud, G., Mallick, S., Kirsanow, K. et al. Ancient human genomes suggest three ancestral populations for present-day Europeans. Nature 513, 409–413 (2014).
Article CAS PubMed PubMed Central Google Scholar - Zhivotovsky, L. A., Underhill, P. A., Cinnioğlu, C., Kayser, M., Morar, B., Kivisild, T. et al. The effective mutation rate at Y chromosome short tandem repeats, with application to human population-divergence time. Am. J. Hum. Genet. 74, 50–61 (2004).
Article CAS PubMed Google Scholar - Underhill, P. A., Poznik, G. D., Rootsi, S., Järve, M., Lin, A. A., Wang, J. et al. The phylogenetic and geographic structure of Y-chromosome haplogroup R1a. Eur. J. Hum. Genet. 23, 124–131 (2015).
Article PubMed Google Scholar - Karpov, J. J. & Kapustina, E. L. in Gorcy posle gor: Migracionnye processy v Dagestane v XX-nachale XXI vv.: ix social’nye i etnokul’turnye posledstvija i perspektivy [Mountaineers Down from the Mountains: Migration Processes in Daghestan, 20th and early 21st centuries: Social and Ethnocultural Consequences], (Rossijskaja AN, Muzej antropologii i etnografii, St. Petersburg, 2011).
Google Scholar - Kurtsikidze, S. & Chikovani, V. in Ethnography and Folklore of the Georgia-Chechnya Border, (Lincom Europa, Munich, 2009).
Google Scholar - Lavrov, L. I. Some results from the field work in Dagestan 1950-52. Kratkie soobschenija Instituta Ètnografii 19, 3–7 (1953).
Google Scholar - Seielstad, M. T., Minch, E. & Cavalli-Sforza, L. L. Genetic evidence for a higher female migration rate in humans. Nat. Genet. 20, 278–280 (1998).
Article CAS PubMed Google Scholar - Wilder, J. A., Mobasher, Z. & Hammer, M. F. Genetic evidence for unequal effective population sizes of human females and males. Mol. Biol. Evol. 21, 2047–2057 (2004).
Article CAS PubMed Google Scholar - Lippold, S., Xu, H., Ko, A., Li, M., Renaud, G., Butthof, A. et al. Human paternal and maternal demographic histories: insights from high-resolution Y chromosome and mtDNA sequences. Investig. Genet. 5, 13 (2014).
Article PubMed PubMed Central Google Scholar - Balaresque, P., Poulet, N., Cussat-Blanc, S., Gerard, P., Quintana-Murci, L., Heyer, E. et al. Y-chromosome descent clusters and male differential reproductive success: young lineage expansions dominate Asian pastoral nomadic populations. Eur. J. Hum. Genet. 23, 1413–1422 (2015).
Article CAS PubMed PubMed Central Google Scholar - Nettle, D. & Harriss, L. Genetic and linguistic affinities between human populations in Eurasia and West Africa. Hum. Biol. 75, 331–344 (2003).
Article PubMed Google Scholar
Acknowledgements
We thank all Daghestani people participating in this study, Daniel Wolf, Daniel Teberg, Audrey Copeland, Kiana Lee Diehl and Amal Mohamed for technical assistance. This work was supported by grants from the National Science Foundation (BSC 1025266 to MFH and TMK and BSC0742328 to TMK).
Author information
Authors and Affiliations
- ARL Division of Biotechnology, University of Arizona, Tucson, AZ, USA
Tatiana M Karafet, Olga V Savina & Michael F Hammer - Vavilov Institute of General Genetics, Russian Academy of Sciences, Moscow, Russia
Kazima B Bulayeva, Oleg A Bulayev, Farida Gurgenova & Jamilia Omarova - Department of Slavic Languages and Literatures, University of California, Berkeley, CA, USA
Johanna Nichols - Institute of Molecular Biology, National Academy of Sciences, Yerevan, Armenia
Levon Yepiskoposyan - Russian-Armenian University, Yerevan, Armenia
Levon Yepiskoposyan - Institute of Oriental Studies, Russian Academy of Sciences, Moscow, Russia
Barry H Rodrigue
Authors
- Tatiana M Karafet
You can also search for this author inPubMed Google Scholar - Kazima B Bulayeva
You can also search for this author inPubMed Google Scholar - Johanna Nichols
You can also search for this author inPubMed Google Scholar - Oleg A Bulayev
You can also search for this author inPubMed Google Scholar - Farida Gurgenova
You can also search for this author inPubMed Google Scholar - Jamilia Omarova
You can also search for this author inPubMed Google Scholar - Levon Yepiskoposyan
You can also search for this author inPubMed Google Scholar - Olga V Savina
You can also search for this author inPubMed Google Scholar - Barry H Rodrigue
You can also search for this author inPubMed Google Scholar - Michael F Hammer
You can also search for this author inPubMed Google Scholar
Corresponding author
Correspondence toMichael F Hammer.
Ethics declarations
Competing interests
The authors declare no conflict of interest.
Additional information
Supplementary Information accompanies the paper on Journal of Human Genetics website
Supplementary information
Rights and permissions
About this article
Cite this article
Karafet, T., Bulayeva, K., Nichols, J. et al. Coevolution of genes and languages and high levels of population structure among the highland populations of Daghestan.J Hum Genet 61, 181–191 (2016). https://doi.org/10.1038/jhg.2015.132
- Received: 06 July 2015
- Revised: 11 August 2015
- Accepted: 08 October 2015
- Published: 26 November 2015
- Issue Date: March 2016
- DOI: https://doi.org/10.1038/jhg.2015.132