3.1 Population (original) (raw)
Population growth is a key parameter as it is used to compute the evolution of the targeted demand together with the diet assumption. Nine population projections are taken from the United Nations DESA population division prospects: low, medium, high, constant fertility, instant replacement, momentum, zero migration, constant mortality and no change (UNDESA, 2017). Five population projections are taken from the SSP database developed at IIASA: SSP1 to SSP5 (KC & Lutz, 2017). Historical data for 2000, 2005, 2010, and 2015 are taken from UN DESA (UNDESA, 2017).
Shifters are computed as the ratio between the projected population in each time step and the population reported in 2015 in each database. The shifters corresponding to the selected population scenario are applied to the 2015 historical population level from UN DESA as well as its growth projections regarding age group and sex to derive the evolution of the average Minimum Dietary Energy Requirement (MDER) (cf. Section 4.1). One problem is that the historical population value for 2015 is inconsistent across the UN and SSP databases.
The average activity level of a nation’s population affects its minimum dietary energy requirement (MDER) against which the FABLE Calculator compares feasible consumption. By default, three activity-level scenarios are defined in accordance with USDA (Institute of Medicine, 2002): low, middle, and high. Low corresponds to the USDA’s definition of a mostly sedentary lifestyle “that includes only the physical activity of independent living”. Middle corresponds to a moderately active lifestyle, “including physical activity equivalent to walking about 1.5 to 3 miles per day at 3 to 4 miles per hour, in addition to the activities of independent living”. High activity corresponds to USDA’s active lifestyle, including “physical activity equivalent to walking more than 3 miles per day at 3 to 4 miles per hour, in addition to the activities of independent living”. Daily calorie needs increase with higher activity: for instance, an adult male’s minimum needs are 2,600 kcal per day with low activity but 3,200 kcal per day with high activity.
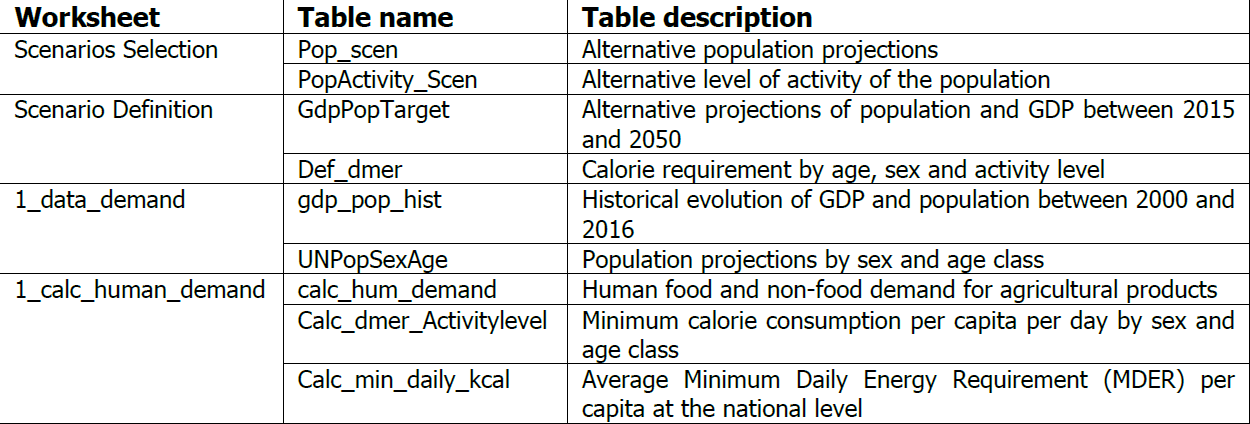
Table 3. List of tables related to the population scenarios