4.4 Steps 4 to 6: Computation of the targeted productive land, land adjustment coefficient and feasible productive land (original) (raw)
Worksheets in the FABLE Calculator:
⇒ 4_calc_land
⇒ 4_data_land
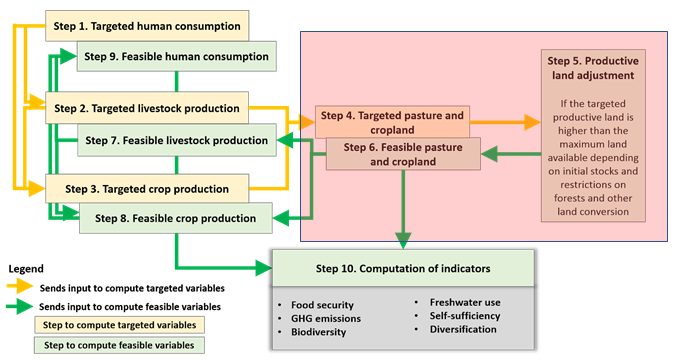
We represent 6 land cover types in the FABLE Calculator: pasture, cropland, urban area, forest, new forest, and other natural land. Computed changes in area of pasture, cropland, urban, and new forest induce changes in the area of forest and other natural land as the total land area cannot expand. For each land cover type, we first compute the initial area at the beginning of the period using 2000 historical data as the base year and the feasible computed area at the end of the previous period for the other time steps.
- Pasture area - The difference between the targeted pasture area for each time step which is computed in the previous steps (cf. Pasture) and the initial pasture area at the beginning of the time step corresponds to the targeted pasture area change (expansion or reduction) (Figure 8; Figure 10). The targeted pasture change is compared with the maximum pasture expansion which depends on the selected land scenario (cf. Land availability); e.g., in the NoExpansion scenario, there is no pasture expansion possible after 2015. In case the targeted expansion is higher than the maximum expansion, the maximum value is used to compute the feasible pasture area.
- Cropland area - The same is done for cropland. The targeted cropland area is computed as the sum of computed harvested area by crop in previous steps (cf. Crop production). According to the FAOSTAT Commodity Balance (FAOSTAT, 2020), post-harvest losses include "waste during the year at all stages between the level at which production is recorded and the household” (i.e. storage and transportation). In the FABLE Calculator, losses in retail are considered as part of food waste (c.f. Food Waste). We compute the share of losses for each commodity in each country as the number of historical losses over production plus imports plus stock withdrawals, based on historical data from the FAO Commodity Balance. By default, depending on the selected scenario (cf. Post-Harvest Loss), we either keep the share constant at 2010 levels for the rest of the period 2015-2050 or reduce it by a target percentage by 2050, where the time steps are defined through the set implementation speed. Stock variation is only included for historical years using FAO statistics and assumed null for the rest of the period. Targeted production is computed as targeted human consumption, plus targeted feed consumption, plus targeted exports, minus imports, plus losses, minus stock variation (Figure 9) plus the area for "other crops" which results from the difference of cropland area in 2000 and the sum of harvested area by crop in the FAO database. The discrepancy between reported cropland and the sum of harvested area can be explained by missing crops in the FAO database but also because arable land includes "temporary meadows for mowing or pasture, land under market and kitchen gardens and land temporarily fallow (less than five years)" (FAOSTAT, 2020), which are not yet explicitly taken into account in the FABLE Calculator. The area under "other crops" is set constant at 2000 levels for the whole period of simulation.
- Urban area - Targeted urban area is computed based on historical expansion rates computed based on ESA-CCI land cover maps from 2000 and 2005 but capped at 3.5% of total land area maximum.
- Afforested area - Depending on the Afforestation scenario which is selected (cf. Afforestation), there might be some land which is taken out of pasture, cropland and/or other natural land to be converted into new forest (afforested area). In this case, the afforested area is removed from the initial land area before the land expansion/reduction is computed.
- Forest - Targeted deforestation is computed as the share of the total expansion which occurs at the expense of forests and the total targeted expansion which is computed by adding cropland, pasture, and urban area expansion. The share of the expansion which occurs on forest is based on FAO data over 2000-2005 but can also be changed through land scenario (cf. Land availability); e.g., in the No deforestation scenario, the share is set to zero. This targeted deforestation is compared with the maximum deforestation which is computed as the initial forest area at the beginning of the period minus the forest within protected areas. The targeted deforestation cannot be higher than the maximum deforestation.
- Other natural land - The initial other natural land category in 2000 is computed as the difference between the total land area of the country/region minus pasture used for livestock, cropland, forest, and urban areas. It can thus include quite heterogeneous land types and degree of wilderness. The maximum other natural land which is available for conversion to productive land use is computed as the initial other natural land at the beginning of the period minus the area within protected areas and minus the area which is targeted for afforestation. The targeted other natural land change is the sum of the targeted productive land expansion minus the targeted productive land expansion that occurs on forest land or the targeted reduction of productive land area, and the targeted afforestation on other natural land. The computed other natural land change cannot be higher than the maximum available other natural land area outside protected areas.
Figure 10. Computation of targeted expansion of agricultural land and urban area with a focus on pasture and feasible deforestation and other natural land change
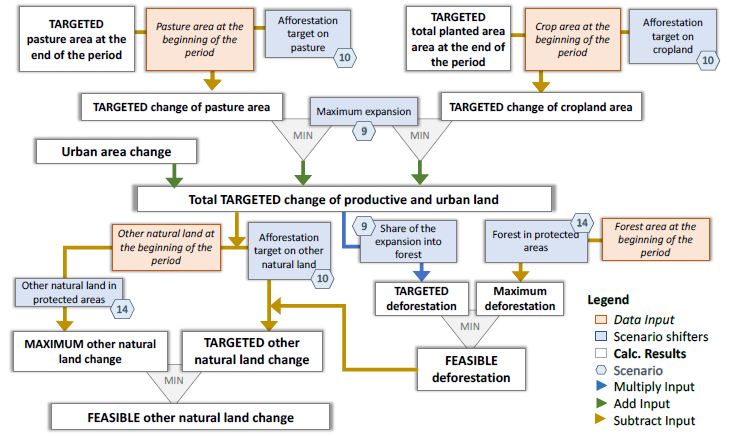
Note: When an arrow passes through a box or is sourced from more than one, it means that two parameters are used together in order to compute the next parameter. The numbers within the blue hexagons refer to the scenario table numbers in the worksheet Scenarios Selection, as labeled in the Open FABLE Calculator 2020. The numbers may differ in other versions of the FABLE Calculator.
If the targeted expansion of productive land (i.e. the sum of pasture, cropland, and urban area) is higher than the feasible expansion, we call the difference the “excess expansion” (Figure 11). Pasture and cropland targeted areas are then proportionally reduced according to their share in the total targeted expansion of agricultural land. The adjustment factor for pasture and cropland is computed as the maximum feasible pasture area over the targeted pasture area and the maximum feasible cropland area over the targeted cropland area. Urban and afforested area are excluded from the adjustment.
Figure 11. Computation of the excess expansion and resulting cropland and pasture adjustment factors
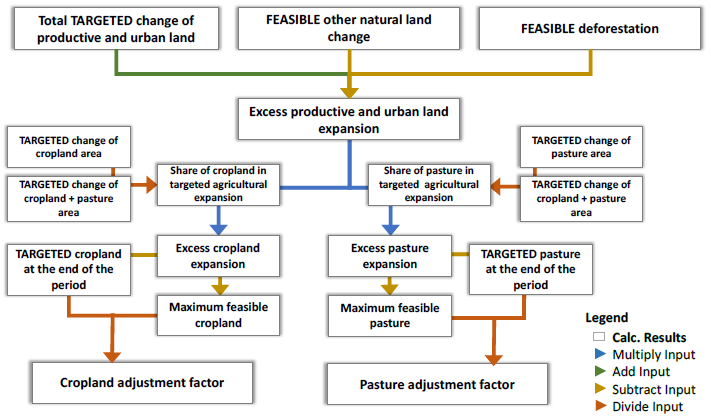
Note: When an arrow passes through a box or is sourced from more than one, it means that two parameters are used together in order to compute the next parameter.