InspectApedia Diagnose & Fix What's Wrong at Your Building (original) (raw)
 Air Movement Direction in Buildings
- POST a QUESTION or COMMENT about air movement in buildings.
Building air movement direction, forces, measurements & effects:
How to become a "house doctor" for building energy & IAQ problems. This article discusses how & why air moves in buildings and explains why sometimes air can move in surprising directions such as warm air moving downwards.
We include an index to research and to additional articles discussing building air movement, the effects of air movement on building environmental testing for contaminants, mold, gases or other indoor air quality measures, as well as the effects of air movement on heat loss or on the transport of odors or other contaminants between building areas.
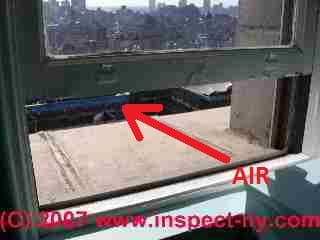
The photograph at page top illustrates how a strong updraft of air may occur in tall buildings: the tenant, troubled by inability to turn down a heating radiator,leaves this window open all winter. A white tissue we taped to the bottom of the window sill flaps outwards illustrating the direction of air movement: up through the building and out at this window.
InspectAPedia tolerates no conflicts of interest. We have no relationship with advertisers, products, or services discussed at this website.
- Daniel Friedman, Publisher/Editor/Author - See WHO ARE WE?
How does Air Move Through a Building? A Quick Look at the Basic Forces of Building Air Movement
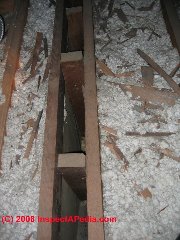 An understanding of air movement in buildings is essential when studying building heat loss, building heating and cooling costs, or when investigating building indoor air quality by making checks for sources of common indoor air contaminants in buildings such as mold or allergens.
In addition, researchers have pointed out that air movement in buildings can impact more than occupant comfort and heating costs, extending even to the rust or deterioration of building components Bundy (1984).
Here we include expanded annotated information about building air movement, its causes, directions, and effects from the US EPA and other expert sources.
We will discuss a range of air movement questions. What cause air to flow up or down in a structure: unexpected air flow directions; What is the effect of air movement on indoor air quality tests & measurements for contaminants, gases, molds, or other particles in indoor air.
What forces that determine the direction of air movement in buildings and how are they measured. Why is it that air movement in buildings can reverse direction? How building air movement transports indoor air pollutants, mold, gases, odors, and heat indoors. Index to articles & research on building air movement indoors.
Article Contents
Definition of building stack effect
The stack effect in buildings is the upwards movement of building air and airborne dust or particles through a building, air updrafting caused by the natural tendency of warm air to rise through a space. Inside the building air rises up from lower building areas, even crawl spaces and basements, and exits at air leakge or air exit points high on the building such as open windows, attic ventilation openings, or other smaller air leak openings.
See details at AIR MOVEMENT in BUILDINGS
The word "stack" in stack effect refers to the chimney or chimney-stack that is formed by the building itself as an air path.
The physics of the building stack effect are relatively simple: warm air, because it is less dense than cold air, weighs less than cold air so tends to rise upwards in a building.
The strength of the stack effect in a building and therefore the air flow rate from lower to upper levels and then out of the building depends on several variables:
- Building height:
The taller the building height between low and high leaks, the stronger will be the stack pressure. In a tall New York City building, where top floor tenants kept the windows open in winter - they were too hot - the stack effect was a virtual gale of out-blowing hot air. - Air temperature differences between lower and upper building floors.
- Total effective size of exit ventilation or air openings high on the building
- Air leakiness throughout the building between its various levels or floors. Leakier buildings usually have a stronger stack-effect.
- The presence of easy air movement or updraft channels such as open stairwells or elevator shafts.
- Moisture differences in different building areas that may in turn affect air density and temperatures.
- The operation of HVAC or mechanical equipment that move air in the building.
On occasion, the natural up-draft of air through a building may be overcome if the air on upper floors is kept cooler than that on lower floors, such as in a home at which only upper floor air conditioning is in use.
 Notice that tissue we taped to the under-side of the window sash? Any desktop papers near an open window would simply blow outside! -- DJF.
These same stack effects and thus building heat losses occur in one and two story residential homes as well.
Watch out: Not only do stack effects draw heat out of a building, any indoor air contaminants such as airborne crawl space mold or sewage spill or rodent-borne pathogens are drawn upwards through the rest of the building.
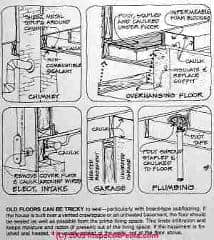
Illustrated in the sketch above: air and heat loss leaks in old building floors can be tricky to seal - particularly with board-type subflooring.
If the building is built over a vented crawlspace or an unheated basement, the floor should be sealed as well as possible from the prime living space.
This limits air infiltration and keeps moisture (and possibly airborne mold or radon gas if present) out of the living space. If the basement is finished and heated, it is usually sealed at its walls, not at the floor above.
At CONVECTIVE LOOPS & THERMAL BYPASS LEAKS we explain how stack effects in buildings chill the interior walls - increasing conduction (heat) losses through them.
Air Usually Moves "Up" in Buildings in a Chimney Effect
 Generally in buildings warm air rises, carrying gases, smoke, odors, particulates, other indoor air pollutants including ultra-small airborne particles such as asbestos (if present and friable and disturbed) or particularly small mold spores (Aspergillus sp. for example) in the 1u range.
- The taller the structure, and the greater the temperature differences between levels, the stronger may be this "upwards" airflow movement. In high rise buildings the upwards air currents in stairways, elevator shafts, and other areas can be enormous, and may be still stronger when windows are opened or exhaust fans operated on upper floors.
Our photo (left) illustrates a strong air flow out through an open window at the top floor of a Manhattan office building.
We [DF] taped a tissue to the window sash bottom (red arrow) to demonstrate the airflow to the office management. You can just see the tissue to the right of our arrow on the under-side of the window sash, and blowing vigorously towards the outdoors, indicating the direction of air-flow.
Although the tissue-for-air-flow is hardly a quantitative test , the air flow velocity out of this window was so strong that loose papers placed anywhere near the window opening immediately blew outdoors.
One could feel the outgoing "wind" simply by standing close to the window!
See details at BATHROOM VENT AIR FLOW MEASUREMENT - Air infiltration leaks at lower levels (or deliberate fresh air intake vents) in a building permit make-up air to enter the structure so that this air movement may be continuous.
See AIR BYPASS LEAKS - Air exhaust openings (such as attic ridge vents or other roof vents) in the upper levels or attic or roof of a building increase this chimney effect.
Air Movement may be "Down" in Buildings
But air movement in buildings can be tricky, the natural chimney effect can be overcome, and air may sometimes move in un-expected directions. For example:
- Cooling the air in an upper floor room in a warm building may generate downwards movement of air in the building
- Use of exhaust fans can reverse the usual direction of air movement in a building, for example operating window fans or other exhaust fans that are blowing "out" on lower floors
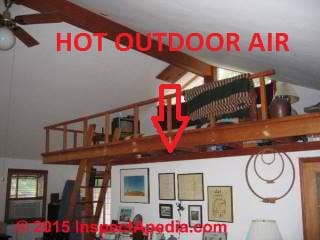
Case report: hot air flows down through roof opening into a cooled space
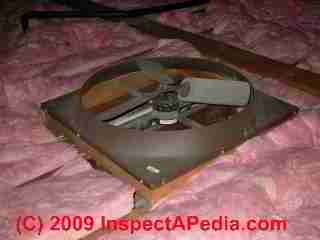
In a New York home I had installed a roof ventilating fan to be used as a hot air exhaust to cool a sleeping loft below a cathedral ceiling that covered a second floor addition on a small home originally built in the 1920's. Though the cathedral ceiling / roof was heavily insulated still the building was uncomfortably warm during very hot weather.
For cosmetic reasons we built a stained wood hatch cover that could be set in place to cover the exhaust fan intake opening when the fan was not in use.
Later the occupants installed a window air-conditioner that was able to cool this entire space and the roof hatch was seldom if ever opened. It remained in place undisturbed for a decade. During building renovations I thought to open the hatch to inspect the roof opening for leaks (there were none).
At the time that the hatch was opened the room's air conditioner had been operating for several hours and the lower area of the room was comfortably cool and dehumidified: it was perhaps 68 F indoors and close to 90 F outside on a hot humid summer day.
But up on the sleeping loft and close to the under-side of the roof it was a different story: warm air was still collecting in this area and it was hot. The cool air blowing into the room from the window-mounted air conditioner could cool the lower portion of the room and even the downstairs but it was not blowing much cool air upwards towards the loft area.
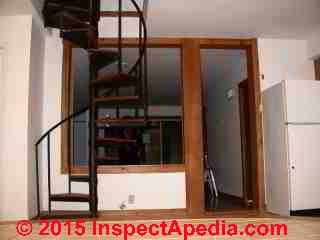 We had already observed that cool air from the comfy second floor flowed downstairs through a spiral staircase opening. When the second floor was cooled the first floor of the home was also being cooled and dehumidified by that down-flow of cool dry air.
At left you can see the spiral stairway between building floors. The opening through the upper floor was a particularly comfortable spot to stand on a hot day as cool conditioned air fell through the opening to the lower floor.
But on opening the roof hatch (above the red arrow in the photograph at above left) I expected the hot humid air in the loft area to flow upwards and out of the roof hatch by natural convection.
After all it was hot in that loft and warm air rises, right? And the warm air was already sitting pressed against the cathedral ceiling in the loft area.
But on removing the roof vent fan hatch and after wiping a decade of smut and dust from my eyes I was surprised to feel a strong down-draft of still hotter humid air from outdoors.
Opening the roof venting hatch over a room (mostly) full of cool air on a hot summer day gave an intake opening that allowed the flow of room air down to the building's lower floor to increase. The down flow of cool air to the lower floor was sufficient to overcome any natural chimney effect. Hot outdoor air flowed into the loft area, actually increasing its temperature.
We could reverse this air flow direction by turning on the roof vent fan mounted above the hatch, but left to natural convection over a cool room, hot air flowed down not up.
Contributors to Air Movement & Determinants of Air Movement Direction in Buildings
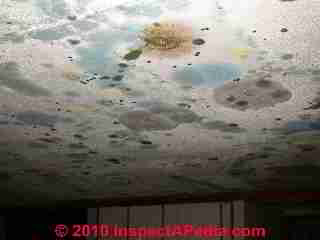 Air flow patterns in buildings are the result of combined forces but are dominated by the chimney effect or by mechanical ventilation. The importance of understanding air movement indoors and its effects on occupant comfort as well as on building heating and cooling costs has been long and widely discussed.
Less well understood and too-often ignored in indoor air quality investigations and tests for gases such as formaldehyde or for airborne mold or other particular contaminants such as asbestos are the effects of air movement in the transport of these contaminants and the effects of changes in air movement on the accuracy of indoor air quality (IAQ) measurements.
My own investigations [DF] have found one to three orders of magnitude variation in the level of small airborne mold spores such as Aspergillus sp. caused simply by walking through a mold-contaminated area or waving a notebook in the air. Turning HVAC system fans on and off or opening or closing windows or doors can produce still higher variability, making some IAQ measurements highly inaccurate.
See AIRBORNE MOLD COUNT VALIDITY
Below we list the principal sources of and influences on the direction & force indoor air movement in most structures. McGuire (1967) emphasizes that among these effects, the dominant natural influence on building air movement is the chimney effect but all of these forces must be considered and sometimes one or more of these can become the dominant factor in how air is moving indoors.
- Human activities in the building (breathing, cooking, using equipment)
Watch out: the presence or absence of occupants as well as the level of their activity can make a significant difference in building IAQ measurements - Mechanical ventilation systems such as warm air heat, air conditioning, exhaust fans, ventilation system blowers and fans.
Watch out: Mechanical disturbance or the absence of it can cause several orders of magnitude variation in the results of building air quality tests and measurements.
Watch out: the condition of the mechanical system such as dirty blower fans (DIRTY A/C BLOWERS), leaky or disconnected air ducts (LEAKY DUCT CONNECTIONS), a dirty air filter (DIRTY AIR FILTER PROBLEMS)
and even an improper refrigerant charge (FROST BUILD-UP on AIR CONDITIONER COILS)
or a stuck or non-functioning damper (ZONE DAMPER CONTROLS) can change the level of air movement attributed to the system and can prove embarrassing for IAQ or building energy usage investigators who make assumptions about the effects of the mechanical system without checking its actual condition. It's not just about turning the fan on and off. - Natural effects or chimney effects (warm air rises, cool air falls) may be increased by building shapes, natural chimneys such as stairwells or elevator shafts, and building exhaust ventilation systems.
Except when overcome by unusual forces (falling cool air from an upper floor) or by mechanical ventilation, chimney effects are the dominant force in building indoor air movement. Building air leaks and convective loops (photo at above left) are important sources of sometimes-hidden chimneys or chimney effects in buildings.
Watch out: simply opening or closing a door, window, or HVAC system supply register, or changing a dirt-clogged air filter can cause orders of magnitude differences in measurements used to assess indoor contaminant levels or IAQ. A measurement of any indoor contaminant that does not take these variables into account is fundamentally unreliable. - Pressure expansion, for example during a fire or possibly during the use of a heating appliance the heating of air causes a pressure differential that can contribute to air movement.
- Temperature changes: changes in air temperature or differences in air temperatures in different building areas can produce surprising air movement changes, even the movement of warm air downwards in buildings. We discuss these effects in this article.
- Weather & outdoor conditions: changes in wind velocity, wind direction, even wind flow over different roof shapes (Kindangen et als 1997) and also outdoor temperature all have significant effects on indoor air movement and conditions.
The Direction of Air Movement Can Change Significantly & Quickly in Buildings
The effects of operation of this whole house fan, when it's turned on, are rather obvious, though the amount of exit vent openings in the attic (soffits, ridge, or gable-end vents) will affect its total air flow rate. But what about when the fan is off during building IAQ measurements.
A building investigator who fails to notice the existence of this fan or fails to check in the attic to see if a winter fan-cover has been left in place (slowing the chimney effects through this opening) or removed (increasing the chimney effects of natural draft ventilation) is, as Dr. Lewis K. Johnson (W&L Univ. 1964) frequently told his students, Asleep at the Switch.
All building conditions & systems that can affect the direction and rate of air movement must be considered when measuring or reporting building IAQ, heat loss or similar study results.
See ACCURACY vs PRECISION of MEASUREMENTS
Here are examples of building conditions or changes that can have a great impact on both air movement direction and air movement rates.
- Opening or closing doors and windows will affect building air movement and depending on which windows or doors are opened, the effects can be dramatic as our page top photo illustrates.
- Operation of heating & cooling equipment: not just the effects of air transport through the duct system of a central air conditioner or heating furnace system but also the effects of differences in the temperature of various building areas can make a significant difference in direction and rate of air movement. We elaborate on these factors in our discussion (below) of the direction of air movement in buildings and its occasional reversal.
- Operation of elevators in buildings can reverse airflow and the direction of movement of airborne particles, gases, or odors between upper and lower building areas every time the elevator car makes a trip up (sucking up air from lower floors) or down (pushing a column of air out from upper levels down through lower floors) the elevator shaft.
- Closing the door to a small boiler or furnace room, especially in tight buildings, can cause the equipment to lack adequate combustion air.
See COMBUSTION AIR for TIGHT BUILDINGS - Opening previously-blocked roof or attic vent intake or outlet openings can make substantial changes in building air movement by natural convection as well as changing the effects of running a whole house fan.
Un-balanced roof venting designs that provide too much air outlet (at a ridge or gable end vent) without sufficient intake of outdoor air (at the house eaves or soffits) creates a natural chimney effect that increases building heating costs and can distribute contaminants from lower floors or even a crawl space or basement throughout the rest of the structure.
See ROOF VENTING DEFECTS
Small Openings in Buildings can Move Large Volumes of Air & Pollutants
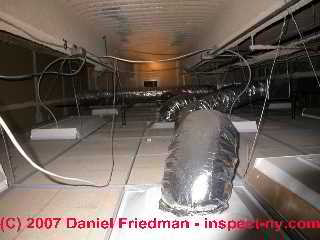
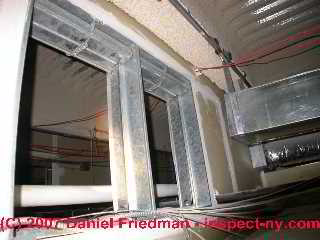
These photos show a common ceiling return air plenum over commercial offices. In the first or left hand photo, notice that rectangular opening in the distance? The second photo is a close-up showing a big surprise: the ceiling area used as return air plenum for an office suite is wide open to the rest of the building ceilings on the same floor.
These air pressure differences and air movements in buildings readily move particles, gases, and odors between building areas through both large openings (windows, doors, stairways, elevator shafts, ductwork), and tiny openings (gaps and cracks in framing, openings around electrical wires, pipes, ducts).
In the photo above the air passage shutter may have been manually chained up, overriding an automatic closure feature. If this is the case, the modification of an important fire safety feature could be a real fire and smoke-spread hazard in this office building.
Below we illustrate one of the most commonly-encountered subversions of the best efforts of HVAC technicians to adjust and balance the air flow within a building: uncomfortable local office occupants remove suspended ceiling panels to make their own adjustments to local heating or cooling levels.
What surprises those unfamiliar with building air movement and indoor air pollution studies, is that the myriad of tiny openings in buildings, much smaller than the openings shown just above, can in the aggregate permit significant levels of air and particle or contaminant movement between building areas even when there are not large obvious holes or "windows" between the spaces.
Simple Tests Demonstrate Air Movement In Buildings
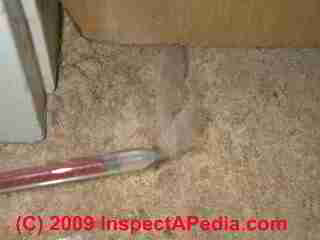 Our photo (left) shows the author [DF] demonstrating air movement between rooms beneath a bedroom door, using a chemical smoke test gun. That smoke has long been a valid and effective means of visual study of the direction of air movement in buildings is well established.
McGuire (1967), discussing how smoke moves in buildings, pointed out how easily small pressure differentials can cause significant air movement in buildings.
Firemen make high level openings to deliberately induce air flow through lower-level openings in the same structure, a step to improve visibility in the building for firefighter. In discussing how smoke moves in buildings during a fire McGuire points out that
... as far as movement is concerned, smoky and normal atmospheres are virtually indistinguishable. ... The properties of the particulate smoke component differ .. but the concentration will not be sufficient to influence the over-all movement of the atmosphere ... The mechanisms to be discussed are not, therefore, unique to the movement of a smoky atmosphere as distinct from air.
Pressure differentials associated with winds, blowers, fans, and mechanical ventilation systems will contribute to smoke movement; however, temperature differentials and variations are usually more important factors. ...
Expansion only occurs as temperatures rise, but another effect, known colloquially as "chimney effect" proceeds continuously whenever there is any temperature differential between interior and exterior. ... Because some level of temperature differential usually exists between a building and the exterior atmosphere, chimney effect is also responsible for much of the normal air movement in buildings. ...
[Regarding thermally induced movement of air in buildings he continues] ... The displacement of gases by the expansion mechanism can be conveniently discussed on the basis of the universal gas law, which states that for any given mass of gas the product of pressure, P, and volume, V, is proportional to the absolute temperature, T.
... In other words, PV = RT where R is a constant (usually taken to relate specifically to 1 g mole of a gas).
The pressure differentials required to establish substantial [air] flow velocities are very small compared with absolute atmospheric pressure.
... It may be said therefore that the volume of a given mass of gases is proportional to its absolute temperature, since, during all the relevant processes short of explosions, P in the above expression hardly varies.
Articles Related to Building Air Movement & Its Effects on the Building Environment
- ACCURACY vs PRECISION of MEASUREMENTS - why highly precise instruments or measurements can still lead to a conclusion that is dead wrong
- AIR CHANGE RATE ACH HEAT SAVINGS
- AIR FLOW MEASUREMENT CFM - details on how to measure air flow
- AIR LEAK DETECTION TOOLS for a discussion of using heat loss measurement tools in practical applications
- AIR LEAK NOISES in BUILDINGS noises can be both annoying and diagnostic aids that explain air leak sources in buildings.
- AIRBORNE MOLD COUNT VALIDITY - sources of variation and inaccuracy in airborne mold or other airborne particle level measurements & counts
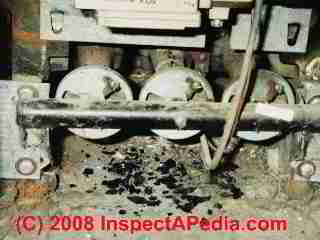
- BACKDRAFTING HEATING EQUIPMENT causes improper heater operation and risks fatal CO poisoning. Below our photo illustrates soot formation at a gas burner where the heating system's exhaust venting may have been subverted.
Also
see BACKDRAFTING & SEWER/SEPTIC ODORS for a discussion of explosive methane gas hazards and sewer gas odor complaints that may be made more obvious by backdrafting in the building.
Watch out: backdrafting that draws combustion products or sewer gases into a building risks a fatal explosion or carbon monoxide poisoning.
- BLOWER DOORS & AIR INFILTRATION - testing building air change (ACH) rates
- CONVECTIVE LOOPS & THERMAL BYPASS LEAKS using IR or visual inspection to find and correct heat loss through convective loops in walls
- DUCT SYSTEM ENERGY LOSSES
- ENERGY SAVINGS in BUILDINGS - Energy Efficiency Designs, Inspections, Tests, & Retrofit Improvements for buildings
- FORENSIC INVESTIGATION of BUILDINGS
- FORMALDEHYDE HAZARDS - Sources of formaldehyde gas or odors in buildings. Formaldehyde gas exposure limits. How to reduce formaldehyde exposure levels in a building. Current sources of formaldehyde gas concerns in buildings.
- HEAT LOSS DETECTION TOOLS used to diagnose and describe repairs or changes necessary for a wide range of building complaints such as indoor air quality, mold contamination, heating costs, cooling costs, odors, leaks, and problems with the structure and/or its mechanical systems.
- HOUSE DOCTOR, how-to be - a "house doctor" is an expert building consultant who understands building science, how air moves through a building, how buildings are actually constructed (and what goes wrong), heating, ventilating, air conditioning, and building insulation systems, standards, and good practices.
- HOWLING NOISES in BUILDINGS can be tracked to air movement across surfaces (decks), HVAC duct leaks, even air movement through gaps at an attic pull-down stairs. It's not just dogs that howl in the night.
- INDOOR AIR QUALITY & HOUSE TIGHTNESS - chimney effects in tight buildings
- MOISTURE PROBLEMS: CAUSE & CURE - moisture moves in buildings as building indoor air moves; moisture levels in buildings may be significantly affected by leakage of outdoor air into the structure.
For example venting a crawl space with outdoor air in hot humid climates can cause significant crawl space moisture and mold trouble (CRAWL SPACE DEHUMIDIFICATION ).
Similar problems occur in building attics or roof spaces (ROOF ICE DAM LEAKS). - MOLD CLEARANCE INSPECTIONS points out the importance of documenting building air movement conditions during testing
- ODORS GASES SMELLS, DIAGNOSIS & CURE - air movement's role as an odor transporter in building odor complaints
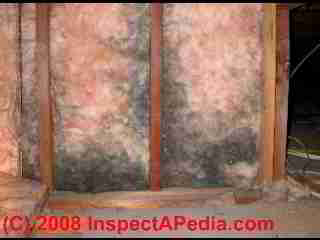
See AIR CONDITIONING SYSTEM ODORS for a discussion of odor transport in HVAC systems. - STAIN DIAGNOSIS on BUILDING INTERIORS - air movement through building openings or across surfaces can explain thermal tracking or ghosting, stains on insulation (INSULATION STAINS - AIR BYPASS LEAKS), stains on ceilings & walls or even carpets (CARPET STAIN DIAGNOSIS).
- Tamblyn, R. T. COPING WITH AIR PRESSURE PROBLEMS IN TALL BUILDINGS [PDF] Ashrae Transactions 97, no. 1 (1991): 824-827.
- THERMAL IMAGING, THERMOGRAPHY how to use thermal imaging and the sources of error or even abuse and misuse of the equipment
- THERMAL TRACKING BRIDGING GHOSTING gives examples of visual clues that identify building air leaks and heat loss with no instruments whatsoever.
- VENTILATION in BUILDINGS - types of building ventilation systems, supply only, exhaust only, balanced ventilation, their designs & their effects on building air movement
- WIND NOISES at BUILDINGS
Watch out: The toolbox for studying air movement, heat loss, airborne particle levels, gases or chemicals moving in buildings, is a large one, but tools and gadgets alone do not make a building expert, and worse, they might be used improperly giving misleading and unnecessarily expensive results use to "sell" treatments or "improvements" that might not be the best way to spend on improving building air quality or saving on building energy costs.
Understanding the basics about air movement and appreciating the benefits of an expert visual inspection (see THERMAL TRACKING & HEAT LOSS) can help consumers guard against bad advice or superficial building studies. .
Building Air Movement Research
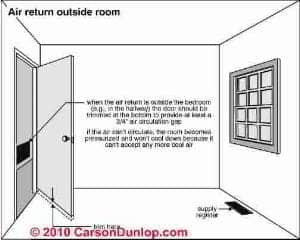 Photo at left provided courtesy of Carson Dunlop Associates, a Toronto home inspection & education firm.
- ANSI/ASHRAE Standard 55-2010 "Thermal Environmental Conditions for Human Occupancy", https://www.ashrae.org/
- Awbi, Hazim B. "Calculation of convective heat transfer coefficients of room surfaces for natural convection." Energy and Buildings 28, no. 2 (1998): 219-227.
Abstract
Convective heat transfer from internal room surfaces has major effect on the thermal comfort, air movement and heating and cooling loads for the room. Recent studies have shown that the values of convective heat transfer coefficient used in building thermal models greatly influence the prediction of the thermal environment and energy consumption in buildings.
In computational fluid dynamics (CFD) codes for room air movement prediction, accurate boundary conditions are also necessary for a reliable prediction of the air flow. However, most CFD codes use ‘wall functions’ derived from data relating to the flow in pipes and flat plates which may not be applicable to room surfaces.
This paper presents results for natural convection heat transfer coefficients of a heated wall, a heated floor and a heated ceiling which have been calculated using CFD. Two turbulence models have been used to calculate these coefficients: a standard k — ɛ model using ‘wall functions’ and a low Reynolds number k — ɛ model. The computed results are compared with data obtained from two test chambers. - Awbi, Hazim B. "Air movement in naturally-ventilated buildings." Renewable Energy 8, no. 1 (1996): 241-247.
Abstract
The air movement and the distribution of CO2 in naturally ventilated office room and an atrium is investigated using computational fluid dynamics. The results show that natural ventilation is capable of achieving acceptable CO2 levels. Adequate comfort levels could also be achieved for a typical UK summer climate in both types of buildings. Both wind-driven and buoyancy-driven flows are considered. - Bundy, D. S. "Rate of dust decay as affected by relative humidity, ionization and air movement [in animal confinement buildings]." Transactions of the ASAE [American Society of Agricultural Engineers](USA) (1984).
- de Dear, Richard J., and Gail S. Brager. "Thermal comfort in naturally ventilated buildings: revisions to ASHRAE Standard 55." Energy and buildings 34, no. 6 (2002): 549-561.
- Fanger, P. Ole, and Jørn Toftum. "Extension of the PMV model to non-air-conditioned buildings in warm climates." Energy and Buildings 34, no. 6 (2002): 533-536.
Abstract
The PMV model agrees well with high-quality field studies in buildings with HVAC systems, situated in cold, temperate and warm climates, studied during both summer and winter. In non-air-conditioned buildings in warm climates, occupants may sense the warmth as being less severe than the PMV predicts.
The main reason is low expectations, but a metabolic rate that is estimated too high can also contribute to explaining the difference. An extension of the PMV model that includes an expectancy factor is introduced for use in non-air-conditioned buildings in warm climates.
The extended PMV model agrees well with quality field studies in non-air-conditioned buildings of three continents.
[Note: Fanger developed the Predicted Mean Vote (PMV) model for the investigation of thermal comfort in buildings. The following excerpt is from a Wikipedia definition of "Thermal Comfort":
Thermal neutrality is maintained when the heat generated by human metabolism is allowed to dissipate, thus maintaining thermal equilibrium with the surroundings. The main factors that influence thermal comfort are those that determine heat gain and loss, namely metabolic rate, clothing insulation, air temperature, mean radiant temperature, air speed and relative humidity. Psychological parameters such as individual expectations also affect thermal comfort.[2]
The Predicted Mean Vote (PMV) model stands among the most recognized thermal comfort models.
It was developed using principles of heat balance and experimental data collected in a controlled climate chamber under steady state conditions.[3] The adaptive model, on the other hand, was developed based on hundreds of field studies with the idea that occupants dynamically interact with their environment. Occupants control their thermal environment by means of clothing, operable windows, fans, personal heaters, and sun shades.[2] [4]
The PMV model can be applied to air conditioned buildings, while the adaptive model can be generally applied only to buildings where no mechanical systems have been installed.[1]
There is no consensus about which comfort model should be applied for buildings that are partially air conditioned spatially or temporally.
- "Thermal comfort", Wikipedia, retrieved 11 April 2015, original souce: http://en.wikipedia.org/wiki/Thermal\_comfort - Fanger, Povl Ole, Arsen Krikor Melikov, H. Hanzawa, and J. Ring. "Air turbulence and sensation of draught." Energy and buildings 12, no. 1 (1988): 21-39.
Abstract
The impact of turbulence intensity (Tu) on sensation of draught has been investigated. Fifty subjects, dressed to obtain a neutral thermal sensation, were in three experiments exposed to air flow with low (Tu<12%), medium ( 20% < Tu < 35%) and high ( Tu > 55%) turbulence intensity. In each experiment the sedentary subjects were exposed to six mean air velocities ranging from 0.05 m/s to 0.40 m/s.
The air temperature was kept constant at 23°C. They were asked whether and where they could feel air movement and whether or not it felt uncomfortable.
The turbulence intensity had a significant impact on the occurence of draught sensation. A model is presented which predicts the percentage of people dissatisfied because of draught as a function of air temperature, mean velocity and turbulence intensity. The model can be a useful tool for quantifying the draught risk in spaces and for developing air distribution systems with a low draught risk. - Gan, Guohui. "A parametric study of Trombe walls for passive cooling of buildings." Energy and buildings 27, no. 1 (1998): 37-43.
[Includes discussion of use of a solar chimney to induce air mvoement in buildings] - Haghighat, Fariborz, and Giovanna Donnini. "Impact of psycho-social factors on perception of the indoor air environment studies in 12 office buildings." Building and Environment 34, no. 4 (1999): 479-503.
Abstract
Abstract The main function of a mechanically ventilated office building is to provide a healthy and comfortable working environment for occupants, while maintaining minimum energy consumption. Twelve mechanically ventilated buildings were selected. They varied greatly in surface area, number of floors, occupant density, and building use.
The indoor air quality, thermal comfort, energy consumption, and perception of occupants were investigated in these buildings. A total of 877 subjects participated in the questionnaire survey during the hot summer months of June, July, and August, and during the cold winter months of January, February, and March.
The questions included in the questionnaire dealt with health, environmental sensitivity, work area satisfaction, personal control of the workstations environment, and job satisfaction. Measured parameters concerning the quality of indoor air included ventilation rate, concentration of TVOC, CO2, CO, RH, and formaldehyde.
The thermal comfort parameters included room air, mean radiant, plane radiant asymmetry, and dew point temperatures, as well as air velocity and turbulence intensity. Monthly energy consumption data was also gathered for each building.
Ventilation performance, in terms of air flow rate and indoor air quality, was compared with the ASHRAE Standard 62-89R (Ventilation for Acceptable Indoor Air Quality. Atlanta: American Society of Heating, Refrigerating, and Air Conditioning Engineers, Inc. U.S.A. [1]).
The measured and calculated thermal environmental results were also compared with the ASHRAE Standard 55-92 (Thermal Environmental Conditions for Human Occupancy. Atlanta: American Society of Heating, Refrigerating, and Air Conditioning Engineers, Inc. U.S.A. [2]). CO2 and CO levels satisfied the recommended limits.
The outdoor airflow rate was half that recommended in only one building. The formaldehyde and TVOC levels were moderately higher than suggested comfort levels. However, more than 56% of the occupants rated dissatisfaction with the indoor air quality.
Only 63% of the indoor climatic observations fell within the ASHRAE Standard 55-92 summer comfort zone; 27% in the winter. However, only 69% of those surveyed agreed with the comfort zones. More symptoms were reported by workers who perceived IAQ to be poor. Positive relationships were observed between the job satisfaction and satisfaction with office air quality, ventilation, work area temperature, and ratings of work area environment.
However, job dissatisfaction did not correlate with symptom reports. The occupants were more dissatisfied with IAQ when they preferred more air movement. In other words, the higher the perceived air movement, the greater the satisfaction with IAQ. - Haghighat, F., Z. Jiang, J. C. Y. Wang, and F. Allard. "Air movement in buildings using computational fluid dynamics." Journal of solar energy engineering 114, no. 2 (1992): 84-92.
Abstract
This paper presents the development of a three-dimensional numerical model to study the distributions of indoor air velocity, air temperature, contaminant concentration, and ventilation effectiveness in a two-zone enclosure. The numerical model is based on the k–ε two-equation model of turbulence and the SIMPLE algorithm.
The false-time step and ADI iteration procedure are employed.
The results of the computed velocity and temperature profiles and convective heat transfer by the model are in good agreement with the measurements as well as with the prediction of the PHOENICS code. - Inard, Christian, Hassan Bouia, and Pascal Dalicieux. "Prediction of air temperature distribution in buildings with a zonal model." Energy and buildings 24, no. 2 (1996): 125-132.
Abstract
This study presents a zonal model used for predicting the air temperature distribution inside a room. This model is original in the calculation of mass air flows between two zones. To do so, we distinguish zones where the momentum is small and for which we calculate the flow rates with the aid of a pressure field, and the driving zones described using appropriate specific flow laws.
A comparison between experimental results and those obtained with the model proves that they are fully consistent with each other. This allows us to consider the integration of this type of model into a general building thermal code. - Jones, P. J., and G. E. Whittle. "Computational fluid dynamics for building air flow prediction—current status and capabilities." Building and Environment 27, no. 3 (1992): 321-338.
- Kindangen, J., G. Krauss, and P. Depecker. "Effects of roof shapes on wind-induced air motion inside buildings." Building and Environment 32, no. 1 (1997): 1-11.
Abstract
The effects of roof shape on wind-induced air motion inside buildings were analysed by using a numerical simulation: computational fluid dynamics (CFD).
The average indoor velocity coefficient, a non-dimensional indoor air motion parameter, was used to calculate the relative strength of the interior air movement in the horizontal plane representative of the occupied space of the room.
The distribution of average velocity between inlet and outlet, which enabled observation of the interior air motion behaviour, was analysed.
The coefficient of spatial variation was used to investigate the uniformity of airflow inside the building. It was observed that the shape of the roof directly affected the airflow pattern, especially the velocity magnitude. The importance of wind direction, building overhang and roof height was also investigated. - Lane-Serff, Gregory. "Heat flow and air movement in buildings." PhD diss., University of Cambridge, 1989.
- McGuire, J. H. "Smoke movement in buildings." Fire Technology 3, no. 3 (1967): 163-174.
Abstract
Smoke is a major killer of building occupants in times of fire. How does it spread throughout a building and reach untenable accumulations before temperatures become dangerously high?
In this, the first of two articles, the author discusses the movement of smoke. In the second, he will deal with methods for controlling the movement of smoke in buildings. - Nicol, J. Fergus, and Michael A. Humphreys. "Adaptive thermal comfort and sustainable thermal standards for buildings." Energy and buildings 34, no. 6 (2002): 563-572.
Abstract
The origin and development of the adaptive approach to thermal comfort is explained. A number of recent developments in the application of the theory are considered and the origin of the differences between adaptive thermal comfort and the ‘rational’ indices is explored.
The application of the adaptive approach to thermal comfort standards is considered and recommendations made as to the best comfort temperature, the range of comfortable environments and the maximum rate of change of indoor temperature. The application of criteria of sustainability to thermal standards for buildings is also considered. - Randall, J. M., and V. A. Battams. "Stability criteria for airflow patterns in livestock buildings." Journal of Agricultural Engineering Research 24, no. 4 (1979): 361-374.
Abstract
The environment experienced by stock housed in intensive livestock buildings depends on the ability of the ventilation system to control not only the air temperature but also the pattern of air movement. Although traditional ventilation systems aim to keep a constant temperature at the detector by varying the ventilation rate, as the external temperature changes both the internal air movement and consequently the distribution of internal air temperatures vary.
This is because the small quantities of air required in cold weather and large quantities required in hot weather enter through the same inadequately adjusted vents with the result that both the buoyancy and dynamic pressures in the inlet air jet are continuously varying.
Consequently to provide the most desirable environment for livestock at all times it is necessary to maintain a stable airflow pattern by exercising control over these two factors. It is shown that the airflow pattern depends on the buoyancy and dynamic pressures the ratio of which is defined as the Archimedes number.
It is concluded that the jet remains horizontal for an Archimedes number less than 30 and falls when it is greater than 75, thus causing stable air flows with opposite directions of rotation. Intermediate values should be avoided to prevent unstable patterns and unstable environmental conditions near to the stock. - Raja, Iftikhar A., J. Fergus Nicol, Kathryn J. McCartney, and Michael A. Humphreys. "Thermal comfort: use of controls in naturally ventilated buildings." Energy and Buildings 33, no. 3 (2001): 235-244.
Abstract:
A field study of the thermal comfort of workers in natural ventilated office buildings in Oxford and Aberdeen, UK, was carried out which included information about use of building controls. The data were analysed to explore that what effect the outdoor temperature has on the indoor temperature and how this is affected by occupants’ use of environmental controls during the peak summer (June–August).\ The proportion of subjects using a control was related to indoor and outdoor temperatures to demonstrate the size of the effect.
The results suggest that the use of controls is also related to thermal sensation and their appropriate use is a significant part of adaptive behaviour to modify the indoor thermal conditions.
The results make it possible to predict the effect of temperature on the ventilation rate in naturally ventilated buildings. - Whittle, G. E. "Computation of air movement and convective heat transfer within buildings." International Journal of Ambient Energy 7, no. 3 (1986): 151-164.
Synopsis [Abstract]
A review has been undertaken of the numerical computation of air movement and convective heat transfer within buildings. The fundamental conservation equations together with a turbulence model are described, and a numerical procedure for solving the elliptic partial differential equations is outlined.
The literature on the subject, spanning the past twelve years, is reviewed. Attention is briefly drawn to examples of the use of numerical air movement codes. - Zhang, Hui, Edward Arens, Sahar Abbaszadeh Fard, Charlie Huizenga, Gwelen Paliaga, Gail Brager, and Leah Zagreus. "Air movement preferences observed in office buildings." International Journal of Biometeorology 51, no. 5 (2007): 349-360.
Abstract
Office workers’ preferences for air movement have been extracted from a database of indoor environmental quality surveys performed in over 200 buildings. Dissatisfaction with the amount of air motion is very common, with too little air movement cited far more commonly than too much air movement. Workers were also surveyed in a detailed two-season study of a single naturally ventilated building.
About one-half the building’s population wanted more air movement and only 4% wanted less.
This same ratio applied when the air movement in workspaces was higher than 0.2 m/s, the de facto draft limit in the current ASHRAE and ISO thermal environment standards. Preference for “less air motion” exceeded that for “more” only at thermal sensations of −2 (cool) or colder.
These results raise questions about the consequences of the ASHRAE and ISO standards’ restrictions on air movement, especially for neutral and warm conditions.
...
Continue reading at PASCAL CALCULATIONS or select a topic from the closely-related articles below, or see the complete ARTICLE INDEX.
Or see these
Recommended Articles
- AIR BYPASS LEAKS - and Thermal Tracking
- AIR FLOW MEASUREMENT CFM - how to make air flow measurements, where to buy air flow measurement equipment.
- AIR & HEAT LEAK FIXES
- AIR LEAK DETECTION TOOLS - using heat loss measurement tools in practical application
- AIR LEAK SEALING STRATEGIES - home
- AIR MOVEMENT in BUILDINGS
- BLOWER DOORS & AIR INFILTRATION
- CONVECTIVE LOOPS & THERMAL BYPASS LEAKS
- HOUSE DOCTOR, how-to be
- INSULATION AIR & HEAT LEAKS
- PASCAL CALCULATIONS
- SMOKE GUNS for AIR LEAK DETECTION
- THERMAL IMAGING, THERMOGRAPHY
- THERMAL TRACKING & HEAT LOSS
- WIND WASHING INSULATION at EAVES
Suggested citation for this web page
AIR MOVEMENT in BUILDINGS at InspectApedia.com - online encyclopedia of building & environmental inspection, testing, diagnosis, repair, & problem prevention advice.
Or see this
INDEX to RELATED ARTICLES: ARTICLE INDEX to BUILDING ENERGY SAVINGS
Or use the SEARCH BOX found below to Ask a Question or Search InspectApedia
Or see
INDEX to RELATED ARTICLES: ARTICLE INDEX to BUILDING INDOOR AIR QUALITY IAQ
Or use the SEARCH BOX found below to Ask a Question or Search InspectApedia
Or see
INDEX to RELATED ARTICLES: ARTICLE INDEX to MOLD CONTAMINATION & REMEDIATION
Or use the SEARCH BOX found below to Ask a Question or Search InspectApedia
Ask a Question or Search InspectApedia
Questions & answers or comments about energy experts, house doctors, building diagnosticians
Try the search box just below, or if you prefer, post a question or comment in the Comments box below and we will respond promptly.
Search the InspectApedia website
Note: appearance of your Comment below may be delayed: if your comment contains an image, photograph, web link, or text that looks to the software as if it might be a web link, your posting will appear after it has been approved by a moderator. Apologies for the delay.
Only one image can be added per comment but you can post as many comments, and therefore images, as you like.
You will not receive a notification when a response to your question has been posted.
Please bookmark this page to make it easy for you to check back for our response.
IF above you see "Comment Form is loading comments..." then COMMENT BOX - countable.ca / bawkbox.com IS NOT WORKING.
In any case you are welcome to send an email directly to us at InspectApedia.com at editor@inspectApedia.com
We'll reply to you directly. Please help us help you by noting, in your email, the URL of the InspectApedia page where you wanted to comment.
Citations & References
In addition to any citations in the article above, a full list is available on request.
ADVERTISEMENT
