Deformations within Moving Kinetochores Reveal Different Sites of Active and Passive Force Generation (original) (raw)
. Author manuscript; available in PMC: 2013 Jun 5.
Published in final edited form as: Science. 2012 Jun 21;337(6092):355–358. doi: 10.1126/science.1221886
Abstract
Kinetochores mediate chromosome segregation at mitosis. They are thought to contain both active, force-producing and passive, frictional interfaces with microtubules whose relative locations have been unclear. We inferred mechanical deformation within single kinetochores during metaphase oscillations by measuring average separations between fluorescently labeled kinetochore subunits in living cells undergoing mitosis. Inter-subunit distances were shorter in kinetochores moving toward poles than those moving away. Inter-subunit separation decreased abruptly when kinetochores switched to poleward movement, and decreased further when pulling force increased, suggesting that active force generation during poleward movement compresses kinetochores. The data revealed an active force -generating interface within kinetochores, and a separate passive frictional interface located at least 20 nm away poleward. Together, these interfaces allow persistent attachment with intermittent active force generation.
Kinetochores link chromosomes to microtubules in the mitotic spindle and generate forces for chromosome movement (1). Mammalian kinetochores consist of more than 80 proteins (2), many of whose positions have been mapped with nanometer precision (3–9). Kinetochores are thought to interact both actively and passively with microtubules, but the molecular identity and physical nature of the relevant interfaces are unclear (10). Active interfaces generate pulling force by transducing the free energy of microtubule plus-end depolymerization into mechanical work (11, 12)at kinetochores moving poleward (P). Passive interfaces generate molecular friction when kinetochores are forced to slide over the microtubule lattice towards plus-ends (13). This occurs when kinetochores moving away from poles (AP) are pulled by P sisters, and also when poleward flux pulls microtubules away from stationary kinetochores in some systems (14, 15).
Mechanical compliance (deformation in response to force) should report on the position and direction of forces acting on kinetochores (6). Here we used the separation between red and green probes to measure kinetochore deformation in living Ptk2 cells. The CenpC probe reported on kinetochore subunits near the chromosome, and Cdc20 and Hec1 probes reported on subunits near microtubules. CenpC binds DNA (16), Cdc20 reports on microtubule-binding protein KNL1, and Hec1 binds microtubules and is part of the load-bearing Ndc80 complex (Figure 1A, (17)). Metaphase oscillations, where kinetochores switch fairly regularly between P and AP movement, provided natural force fluctuations (18, 19).
Fig. 1.

Tracking kinetochore probe pairs. (A) Simplified one-dimensional representation of kinetochore organization (6) with probe positions indicated by stars. (B) Experimental schematic. Kinetochore positions oscillate during metaphase. P denotes movement towards a pole, AP movement away. Probes are indicated as colored circles. (C) Representative images of EYFP-Cdc20 and mCherry-CenpC at one time point. Bar = 5 μm. (D) Enlarged image of the single kinetochore pair indentified in (C). Bar = 500 nm. (E) Representative tracks of a single kinetochore (circle-identified in (C)) with direction indicated. Dashed lines = direction reversals. (F) Inter-probe distance versus time from the tracks in (E). Dotted lines = reversal times. (G, H) Histograms of all CenpC(N)-Cdc20 distance measurements during metaphase (G) and anaphase (H) anaphase. The average of the means of P and AP distributions is consistent with reported CenpC-KNL1 N-terminal distance in fixed cells (53–54 nm (6, 17)). (I) Histograms of all CenpC(N)-Hec1(C) distance measurements during metaphase. The noise in single traces and histogram widths (F–I) stemmed from both experimental noise (e.g. centroid determination and two color registration) and biological variation. Stars = histogram distribution means.
A one-dimensional map of kinetochore subunits (Fig. 1A) was generated from light-level measurements in fixed cells and in vitro structural work (6). Weco -expressed two fluorescent kinetochore protein pairs in Ptk2 cells, either mCherry-CenpC (N-terminal label, CenpC(N)) and EYFP-Cdc20, or mCherry-CenpC and Hec1-EGFP (C-terminal label, Hec1(C)). These probes did not perturb metaphase oscillations (17). The Cdc20 probe was brighter than the Hec1 probe, and was used for most experiments. We imaged red and green probes simultaneously by confocal fluorescence microscopy with a dichroic beam splitter and a single camera. Cells were compressed with an agarose pad to keep kinetochores in focus (Fig. 1B) and compression did not perturb oscillations (Table S1) (20). Occasionally, drastic compression was used to induce unusually large forces (17). Using a variant (3, 6) of SHREC (single molecule high-resolution colocalization (21)) in vivo (Fig. 1C), we measured the distance between centroids of the probes (Fig. 1D) every 10 s during several oscillation cycles (Fig. 1E, Movies S1-S2) (17).
We first asked whether P and AP kinetochores were on average different. Graphs of inter-probe distance over time for a single kinetochore (Fig. 1F), and a histogram of many kinetochores (Fig. 1G), revealed CenpC(N)-Cdc20 distances of 47±20 nm in P kinetochores (n=525), and 55±19 nm in AP kinetochores (n=569). These values differ with high significance (p=10−10). 93% of kinetochores imaged displayed a greater mean inter-probe distance in AP than P state (Fig. S1A). The 15% shorter CenpC(N) -Cdc20 distance in P compared to AP kinetochores could stem from either a mechanically compliant CenpC(N)-Cdc20 linkage that responds to force, or from biochemical changes that relocalize a probe molecule.
To distinguish mechanical from biochemical causes of inter-probe distance change we first asked if it also occurred during anaphase, which drastically changes kinetochore biochemistry (22). Anaphase kinetochores are biased towards P motion to segregate chromosomes, but AP transients still occur in Ptk2 cells with similar velocities to metaphase (18, 23), probably due to polar ejection forces (17). Inter-probe distances in anaphase were statistically indistinguishable from those at metaphase (p=0.2 for P, and p=0.4 for AP). The mean CenpC(N)-Cdc20 distance in anaphase was 49±22 nm in P kinetochores (n=204), and 57±20 nm in AP kinetochores (n=89) (Fig. 1H, Table S2). Just as for metaphase, anaphase P and AP inter-probe distances were statistically different from each other (p=0.004), and all but one kinetochore displayed a greater mean inter-probe distance in AP than P state.
Next, we measured the inter-probe distance at metaphase between CenpC(N) and Hec1(C), which is part of the main load-bearing complex, Ndc80. The mean CenpC(N)-Hec1(C) distance was 38±15 nm in P kinetochores (n=564), and 43±17 nm in AP kinetochores (n=487) (Fig. 1I, Table S2). These values differ with high significance (p=10−5), and their average was consistent with the localization of the Hec1 in fixed cells (6). Here too, the mean behavior was representative of individual kinetochores (Fig. S1B). Observing similar changes in distance from CenpC to two different probes reporting on the microtubule-binding KMN network (2, 17) strongly argues that length changes between P to AP are due to mechanical compliance.
In a mechanical model, force changes and deformation changes are expected to be closely correlated in time. To test whether this requirement is met, we tracked sister kinetochores during direction reversals(Fig. 2A), where forces change abruptly. We measured the distance within one kinetochore and distance between that kinetochore and its sister, where the latter reports on force between kinetochores from centromere stretch, during 40 s of observation (five sequential images) centered on reversals, averaged over all reversals in the dataset (Fig. 2B–D). Kinetochore direction (Fig. 2B) (19)and inter -kinetochore distance (Fig. 2C) both changed abruptly at reversals. P-to-AP and AP-to-P reversals occurred at markedly different inter-kinetochore distances (p=10−13, Fig. 2C, Table S3) and times. The leading P kinetochore reversed, on average 6±11s (n=133) before the trailing AP one (and in 15% of the cases after the AP one), illustrated by a shift on the time axis (Fig. 2B–D). Inter-kinetochore distance tended to increase during coordinated movement, because the leading P kinetochore moved slightly faster (on average) than its trailing AP sister (Fig. S2A–D). P-to-AP reversal occurred, on average 7±15 s (n=151) after the maximum inter-kinetochore distance had been reached; inter-kinetochore distance was 2.7±1.0 μm at this reversal, and it decreased abruptly afterwards as both sisters transiently moved towards each other (Fig. 2C). AP-to-P reversal occurred after this decrease in inter-kinetochore distance, at 1.9±0.6 μm, close to the global minimum (Fig. 2C). The above data is consistent with a mechanical model (24)where high centromere stretch favors P-to-AP reversal and low stretch favors AP-to-P reversal (14).
Fig. 2.

Distance between sister kinetochores and between probes in one kinetochore during direction reversals. (A) Single kinetochore position (top) and inter-kinetochore distance (bottom) over time for a sister kinetochore pair (the one in Fig. 1C). Black stars = direction reversals. (B) Mean kinetochore position, (C) inter-kinetochore distance and (D) CenpC(N)-Cdc20 distance over time for metaphase P-to-AP (n=104 traces) and AP-to-P (n=98 traces) reversals (P in red, AP in blue). AP-to-P reversals are positioned 6 s later than P-to-AP on the time axis to reflect the average time between them. Bars = s.e.m. Direction reversals cause abrupt changes in inter-probe distance with a kinetochore, consistent with a mechanical response to a change in force.
Within our time resolution, changes in movement direction and CenpC(N)-Cdc20 distances coincided (17). CenpC(N)-Cdc20 distances increased abruptly after P-to-AP reversals, and decreased abruptly after AP-to-P reversals (Fig. 2D, Fig. S2E–F, Tables S3–S4), which was also true at anaphase (Table S4). That change in forces exerted by P and on AP kinetochores, measured by inter-kinetochore stretch, coincide closely with changes in inter-probe distances within kinetochores supports the mechanical inter pretation of inter-probe distances, while constraining timescales associated with force transitions.
Extent of deformation is expected to correlate with magnitude of force in a mechanical model. To test this, we plotted inter-probe distance against inter-kinetochore distance. Here too, chromosome oscillations provided natural changes in kinetochore forces (Fig. S2); to extend the range of forces, we included measurements from drastically compressed cells, where inter-kinetochore stretch was up to 6 μm. Force between kinetochores is due to active force from the P kinetochore opposed largely by friction from the AP kinetochore (14, 15, 24). Velocity of AP kinetochores increased with inter-kinetochore distance, as expected if AP movement is due to pulling by the P sister opposed by frictional drag at the AP kinetochore (Fig. 3A, Table S5, p=10−4). Consistent with this view, velocity of P kinetochores decreased with inter-kinetochore distance (Fig. 3A, Table S5, p=0.08) (13). Inter-probe distances in P kinetochores decreased with inter-kinetochore distance (Fig. 3B, Table S5, p=10−8). This suggests that P kinetochores that exert more force are more compressed. No correlation between inter-probe and inter-kinetochore distances was detected in AP kinetochores (Fig. 3B, Table S5, p=0.6). Notably, when little active force was generated at low inter-kinetochore distances, both P and AP kinetochores displayed similar inter-probe distances (Fig. 3B).
Fig. 3.
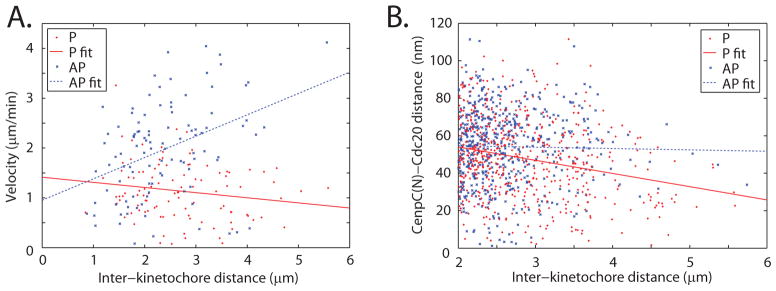
Kinetochore velocity and CenpC(N)-Cdc20 distance at different inter-kinetochore distances. (A) Kinetochore velocity as a function of inter-kinetochore distance during metaphase P (n=104) and AP (n=104) movement before and after P-to-AP reversals, respectively, when the highest inter-kinetochore distances are visited. P velocity decreases and AP velocity increases with inter-kinetochore distance, as expected if P kinetochores generate force and inter-kinetochore distance is a metric for force. We include data from drastic spindle compression to probe even higher forces (17). (B) CenpC(N)-Cdc20 distance as a function of inter-kinetochore distance during metaphase P (n=547) and AP (n=529) movement. Inter-probe distance decreases with inter-kinetochore distance in P kinetochores, consistent with a force-deformation relationship. Lines are best linear fits. Statistics are provided in Table S5.
Because P kinetochores, where active force is generated, are internally compressed relative to AP kinetochores, and the larger the force generated at P kinetochores, the more compressed they are, we developed a simple mechanical model in which frictional forces are generated at a more outward position than active forces in P kinetochores, leading to internal compression (Fig. 4A, Fig. S3–4, Tables S6–7) (17). AP kinetochores, which lack active force generation, are extended by pulling from centromeric chromatin balanced by friction at the kinetochore-microtubule interface. Kinetochore deformation need not vary linearly with force, and may either represent changes in length of protein linkages or their reorientation and reorganization. We extended this mechanical model in light of previous mapping data (Fig. 4B) (6). The active, force-generating interface for P movement lies internal to the mean position of the Hec1(C) probe, and the passive, frictional interface at least 20nm outward of the active interface one (Fig. 3B). This makes the microtubule-binding site at the outer end of Hec1 (0 nm mean position, Fig. 4A) a good candidate for passive force generation (17).
Fig. 4.

Mechanical model for kinetochore compliance. (A) Kinetochores and inter-kinetochore chromatin viewed as three springs in series. P kinetochores are compressed, on average, relative to AP kinetochores. We interpret this as indicating that an active force generating interface that is only engaged in P kinetochores (orange) lies inward of the mean positions of Cdc20 and Hec1(C), while a passive frictional interface that is engaged in all kinetochores (blue) lies outward of these markers. (B) Preliminary structural interpretation, with inter-probe distances indicated (mean±s.e.m.). The active and passive interfaces could differ because they comprise different molecules, or because force generation is restricted to the end of the microtubule, while friction occurs all along the embedded lattice.
Spatially separated passive and active interfaces at kinetochores, whether comprised by different molecules or different interactions of the same molecule with microtubules in different locations (17), may represent a design principle with important advantages. The passive frictional interface binds persistently to microtubules independently of the microtubule dynamics state or movement direction, ensuring segregation accuracy. The active interface consumes energy to efficiently move kinetochores poleward, but can evolve without the constraint of requiring persistent attachment. Together, both interfaces allow the kinetochore to harness force from depolymerizing microtubules without losing grip. That said, kinetochores may be able to function using only the passive interface, e.g. in systems without anaphase A (25) or where microtubules polymerize continuously at kinetochores, even during anaphase (26). In these systems segregation forces will be generated elsewhere in the spindle, and presumably transmitted to chromatin via molecular friction.
Supplementary Material
Movie 1
Movie 2
Supplement
Acknowledgments
We thank J. Shah for the stable Ptk2 EYFP-Cdc20 line, C. Carroll and A. Straight for the mCherry-CenpC construct, J. DeLuca for Hec1 constructs, X. Wan for sharing SpeckleTracker, and M. Kirschner for equipment loan. We thank I. Cheeseman, P. Choi, S. Churchman, J. DeLuca, M. Ginzberg, Q. Justman, J. Shah, X. Wan and J. Waters (HMS Nikon Imaging Center) for discussions. S.D. was supported by the Charles A. King Trust, Bank of America, N.A., Co-Trustee and NIH K99GM094335, E.D.S. by NIH R37GM024364, and T.J.M. by NIH R01GM039565.
Footnotes
Data are presented in the Supplementary Materials.
References and Notes
- 1.Santaguida S, Musacchio A. The life and miracles of kinetochores. EMBO Journal. 2009;28:2511–2531. doi: 10.1038/emboj.2009.173. [DOI] [PMC free article] [PubMed] [Google Scholar]
- 2.Cheeseman IM, Desai A. Molecular architecture of the kinetochore-microtubule interface. Nature Reviews Molecular and Cell Biology. 2008;9:33–46. doi: 10.1038/nrm2310. [DOI] [PubMed] [Google Scholar]
- 3.Joglekar AP, Bloom K, Salmon ED. In vivo protein architecture of the eukaryotic kinetochore with nanometer scale accuracy. Current Biology. 2009;19:694–699. doi: 10.1016/j.cub.2009.02.056. [DOI] [PMC free article] [PubMed] [Google Scholar]
- 4.Ribeiro SA, et al. A super-resolution map of the vertebrate kinetochore. Proceedings of the National Academy of Sciences. 2010;107:10484–10489. doi: 10.1073/pnas.1002325107. [DOI] [PMC free article] [PubMed] [Google Scholar]
- 5.Schittenhelm RB, et al. Spatial organization of a ubiquitous eukaryotic kinetochore protein network in drosophila chromosomes. Chromosoma. 2007;116:385–402. doi: 10.1007/s00412-007-0103-y. [DOI] [PMC free article] [PubMed] [Google Scholar]
- 6.Wan X, et al. Protein architecture of the human kinetochore microtubule attachment site. Cell. 2009;137:672–684. doi: 10.1016/j.cell.2009.03.035. [DOI] [PMC free article] [PubMed] [Google Scholar]
- 7.Maresca TJ, Salmon ED. Intrakinetochore stretch is associated with changes in kinetochore phosphorylation and spindle assembly checkpoint activity. Journal of Cell Biology. 2009;184:373–381. doi: 10.1083/jcb.200808130. [DOI] [PMC free article] [PubMed] [Google Scholar]
- 8.Uchida KS, et al. Kinetochore stretching inactivates the spindle assembly checkpoint. Journal of Cell Biology. 2009;184:383–390. doi: 10.1083/jcb.200811028. [DOI] [PMC free article] [PubMed] [Google Scholar]
- 9.Venkei Z, et al. Spatiotemporal dynamics of Spc105 regulates the assembly of the drosophila kinetochore. Open Biology. 2012;2:110032. doi: 10.1098/rsob.110032. [DOI] [PMC free article] [PubMed] [Google Scholar]
- 10.Joglekar AP, Bloom KS, Salmon ED. Mechanisms of force generation by end-on kinetochore-microtubule attachments. Current Opinion in Cell Biology. 2010;22:57–67. doi: 10.1016/j.ceb.2009.12.010. [DOI] [PMC free article] [PubMed] [Google Scholar]
- 11.Grishchuk EL, Molodtsov MI, Ataullakhanov FI, McIntosh JR. Force production by disassembling microtubules. Nature. 2005;438:384–388. doi: 10.1038/nature04132. [DOI] [PubMed] [Google Scholar]
- 12.Koshland DE, Mitchison TJ, Kirschner MW. Polewards chromosome movement driven by microtubule depolymerization in vitro. Nature. 1988;331:499–504. doi: 10.1038/331499a0. [DOI] [PubMed] [Google Scholar]
- 13.Nicklas RB. Measurements of the force produced by the mitotic spindle in anaphase. Journal of Cell Biology. 1983;97:532–548. doi: 10.1083/jcb.97.2.542. [DOI] [PMC free article] [PubMed] [Google Scholar]
- 14.Khodjakov A, Rieder CL. Kinetochores moving away from their associated pole do not exert a significant pushing force on the chromosome. Journal of Cell Biology. 1996;135:315–327. doi: 10.1083/jcb.135.2.315. [DOI] [PMC free article] [PubMed] [Google Scholar]
- 15.Maddox P, Straight A, Coughlin P, Mitchison TJ, Salmon ED. Direct observation of microtubule dynamics at kinetochores in Xenopus extract spindles: Implications for spindle mechanics. Journal of Cell Biology. 2003;162:377–382. doi: 10.1083/jcb.200301088. [DOI] [PMC free article] [PubMed] [Google Scholar]
- 16.Hori T, et al. Ccan makes multiple contacts with centromeric DNA to provide distinct pathways to the outer kinetochore. Cell. 2008;135:1039–1052. doi: 10.1016/j.cell.2008.10.019. [DOI] [PubMed] [Google Scholar]
- 17.See Supplementary Materials on Science Online.
- 18.Skibbens RV, Skeen VP, Salmon ED. Directional instability of kinetochore motility during chromosome congression and segregation in mitotic newt lung cells: A push-pull mechanism. Journal of Cell Biology. 1993;122:859–875. doi: 10.1083/jcb.122.4.859. [DOI] [PMC free article] [PubMed] [Google Scholar]
- 19.Akiyoshi B, et al. Tension directly stabilizes reconstituted kinetochore-microtubule attachments. Nature. 2010;468:576–579. doi: 10.1038/nature09594. [DOI] [PMC free article] [PubMed] [Google Scholar]
- 20.Dumont S, Mitchison TJ. Compression regulates spindle length by a mechanochemical switch at the poles. Current Biology. 2009;19:1086–1095. doi: 10.1016/j.cub.2009.05.056. [DOI] [PMC free article] [PubMed] [Google Scholar]
- 21.Churchman LS, Okten Z, Rock RS, Dawson JF, Spudich JA. Single molecule high-resolution colocalization of Cy3 and Cy5 attached to macromolecules measures intramolecular distances through time. Proceedings of the National Academy of Sciences. 2005;102:1419–1423. doi: 10.1073/pnas.0409487102. [DOI] [PMC free article] [PubMed] [Google Scholar]
- 22.Howell BJ, et al. Spindle checkpoint protein dynamics at kinetochores in living cells. Current Biology. 2004;14:953–964. doi: 10.1016/j.cub.2004.05.053. [DOI] [PubMed] [Google Scholar]
- 23.Tirnauer JS, Canman JC, Salmon ED, Mitchison TJ. EB1 targets to kinetochores with attached, polymerizing microtubules. Molecular Biology of the Cell. 2002;13:4308–4316. doi: 10.1091/mbc.E02-04-0236. [DOI] [PMC free article] [PubMed] [Google Scholar]
- 24.Skibbens RV, Rieder CL, Salmon ED. Kinetochore motility after severing between sister centromeres using laser microsurgery: Evidence that kinetochore directional instability and position is regulated by tension. Journal of Cell Science. 1995;108:2537–2548. doi: 10.1242/jcs.108.7.2537. [DOI] [PubMed] [Google Scholar]
- 25.Oegema K, Desai A, Rybina S, Kirkham M, Hyman AA. Functional analysis of kinetochore assembly in Caenorhabditis Elegans. Journal of Cell Biology. 2001;153:1209–1226. doi: 10.1083/jcb.153.6.1209. [DOI] [PMC free article] [PubMed] [Google Scholar]
- 26.LaFountain JRJ, Cohan CS, Siegel AJ, LaFountain DJ. Direct visualization of microtubule flux during metaphase and anaphase in crane-fly spermatocytes. Molecular Biology of the Cell. 2004;15:5724–5732. doi: 10.1091/mbc.E04-08-0750. [DOI] [PMC free article] [PubMed] [Google Scholar]
- 27.Mitchison TJ, Salmon ED. Poleward kinetochore fiber movement occurs during both metaphase and anaphase-a in newt lung cell mitosis. Journal of Cell Biology. 1992;119:569–582. doi: 10.1083/jcb.119.3.569. [DOI] [PMC free article] [PubMed] [Google Scholar]
- 28.Rieder CL, Davison EA, Jensen LC, Cassimeris L, Salmon ED. Oscillatory movements of monooriented chromosomes and their position relative to the spindle pole result from the ejection properties of the aster and half-spindle. Journal of Cell Biology. 1986;103:581–591. doi: 10.1083/jcb.103.2.581. [DOI] [PMC free article] [PubMed] [Google Scholar]
- 29.Ke K, Cheng J, Hunt AJ. The distribution of polar ejection forces determines the amplitude of chromosome directional instability. Current Biology. 2009;19:807–815. doi: 10.1016/j.cub.2009.04.036. [DOI] [PMC free article] [PubMed] [Google Scholar]
- 30.Levesque AA, Compton DA. The chromokinesin Kid is necessary for chromosome arm orientation and oscillation, but not congression, on mitotic spindles. Journal of Cell Biology. 2001;154:1135–1146. doi: 10.1083/jcb.200106093. [DOI] [PMC free article] [PubMed] [Google Scholar]
- 31.Wan X. University of North Carolina; Chapel Hill: 2008. [Google Scholar]
- 32.Churchman LS, Flyvbjerg H, Spudich JA. A non-Gaussian distribution quantifies distances measured with fluorescence localization techniques. Biophysical Journal. 2006;90:668–671. doi: 10.1529/biophysj.105.065599. [DOI] [PMC free article] [PubMed] [Google Scholar]
- 33.McEwen BF, Heagle AB, Cassels GO, Buttle KF, Rieder CL. Kinetochore-fiber maturation in Ptk1 cells and its implications for the mechanisms of chromosome congression and anaphase onset. Journal of Cell Biology. 1997;137:1567–1580. doi: 10.1083/jcb.137.7.1567. [DOI] [PMC free article] [PubMed] [Google Scholar]
- 34.Mortensen KI, Churchman LS, Spudich J, Flyvbjerg H. Optimized localization analysis for single-molecule tracking and super-resolution microscopy. Nature Methods. 2010;7:377–381. doi: 10.1038/nmeth.1447. [DOI] [PMC free article] [PubMed] [Google Scholar]
- 35.Waters JC, Chen RH, Murray AW, Salmon ED. Localization of Mad2 to kinetochores depends on microtubule attachment, not tension. Journal of Cell Biology. 1998;141:1181–1191. doi: 10.1083/jcb.141.5.1181. [DOI] [PMC free article] [PubMed] [Google Scholar]
- 36.Carroll CW, Milks KJ, Straight AF. Dual recognition of cenp-a nucleosomes is required for centromere assembly. Journal of Cell Biology. 2010;189:1143–1155. doi: 10.1083/jcb.201001013. [DOI] [PMC free article] [PubMed] [Google Scholar]
- 37.Milks KJ, Moree B, Straight AF. Dissection of Cenp-C-directed centromere and kinetochore assembly. Molecular Biology of the Cell. 2009;20:4246–4255. doi: 10.1091/mbc.E09-05-0378. [DOI] [PMC free article] [PubMed] [Google Scholar]
- 38.Shah J, et al. Dynamic of centromere and kinetochore proteins: Implications for checkpoint signaling and silencing. Current Biology. 2004;14:942–952. doi: 10.1016/j.cub.2004.05.046. [DOI] [PubMed] [Google Scholar]
- 39.Screpanti E, et al. Direct binding of Cenp-C to the Mis12 complex joins the inner and outer kinetochore. Current Biology. 2011;21:391–398. doi: 10.1016/j.cub.2010.12.039. [DOI] [PMC free article] [PubMed] [Google Scholar]
- 40.Przewloka M, et al. Cenp-Cis a structural platform for kinetochore assembly. Current Biology. 2011;21:399–405. doi: 10.1016/j.cub.2011.02.005. [DOI] [PubMed] [Google Scholar]
- 41.DeLuca J, Musacchio A. Structural organization of the kinetochore-microtubule interface. Current Opinion in Cell Biology. 2012;24:48–56. doi: 10.1016/j.ceb.2011.11.003. [DOI] [PMC free article] [PubMed] [Google Scholar]
- 42.Lawrimore J, Bloom KS, Salmon ED. Point centromeres contain more than a single centromere-specific Cse4 (Cenp-A) nucleosome. Journal of Cell Biology. 2011;195:573–582. doi: 10.1083/jcb.201106036. [DOI] [PMC free article] [PubMed] [Google Scholar]
- 43.Cheeseman IM, Chappie JS, Wilson-Kubalek EM, Desai A. The conserved KMN network constitutes the core microtubule-binding site of the kinetochore. Cell. 2006;127:983–997. doi: 10.1016/j.cell.2006.09.039. [DOI] [PubMed] [Google Scholar]
- 44.Kiyomitsu T, Obuse C, Yanagida M. Human Blinkin/Af15q14 is required for chromosome alignment and the mitotic checkpoint through direct interaction with Bub1 and BubR1. Developmental Cell. 2007;13:663–876. doi: 10.1016/j.devcel.2007.09.005. [DOI] [PubMed] [Google Scholar]
- 45.Kallio MJ, Beardmore VA, Weinstein J, Gorbsky GJ. Rapid microtubule-independent dynamics of Cdc20 at kinetochores and centrosomes in mammalian cells. Journal of Cell Biology. 2002;158:841–847. doi: 10.1083/jcb.200201135. [DOI] [PMC free article] [PubMed] [Google Scholar]
- 46.Tang Z, Bharadwaj R, Li B, Yu H. Mad2-independent inhibition of APCCdc20 by the mitotic checkpoint protein BubR1. Developmental Cell. 2001;1:227–237. doi: 10.1016/s1534-5807(01)00019-3. [DOI] [PubMed] [Google Scholar]
- 47.Liu ST, Rattner JB, Jablonski SA, Yen TJ. Mapping the assembly pathways that specify formation of the trilaminar kinetochore plates in human cells. Journal of Cell Biology. 2006;175:41–53. doi: 10.1083/jcb.200606020. [DOI] [PMC free article] [PubMed] [Google Scholar]
- 48.Tang Z, Shu H, Oncel D, Chen S, Yu H. Phosphorylation of Cdc20 by Bub1 provides a catalytic mechanism for APC/C inhibition by the spindle checkpoint. Molecular Cell. 2004;16:387–397. doi: 10.1016/j.molcel.2004.09.031. [DOI] [PubMed] [Google Scholar]
- 49.Kang J, et al. Structure and substrate recruitment of the human spindle checkpoint kinase bub1. Molecular Cell. 2008;32:394–405. doi: 10.1016/j.molcel.2008.09.017. [DOI] [PMC free article] [PubMed] [Google Scholar]
- 50.D’Arcy S, Davies OR, Blundell TL, Bolanos-Garcia VM. Defining the molecular basis of BubR1 kinetochore interactions and APC/C-Cdc20 inhibition. Journal of Biological Chemistry. 2010;285:14764–14776. doi: 10.1074/jbc.M109.082016. [DOI] [PMC free article] [PubMed] [Google Scholar]
- 51.Yang F, Moss LG, Phillips GN. The molecular structure of green fluorescent protein. Nature Biotechnology. 1996;14:1246–1251. doi: 10.1038/nbt1096-1246. [DOI] [PubMed] [Google Scholar]
- 52.Shaner NC, Steinbach PA, Tsien RY. A guide to choosing fluorescent proteins. Nature Methods. 2005;2:905–909. doi: 10.1038/nmeth819. [DOI] [PubMed] [Google Scholar]
- 53.Ganem NJ, Upton K, Compton DA. Efficient mitosis in human cells lacking poleward microtubule flux. Current Biology. 2005;15:1827–1832. doi: 10.1016/j.cub.2005.08.065. [DOI] [PubMed] [Google Scholar]
- 54.Houghtaling BR, Yang G, Matov A, Danuser G, Kapoor TM. Op18 reveals the contribution of nonkinetochore microtubules to the dynamic organization of the vertebrate meiotic spindle. Proceedings of the National Academy of Sciences. 2009;106:15338–15343. doi: 10.1073/pnas.0902317106. [DOI] [PMC free article] [PubMed] [Google Scholar]
- 55.Buster DW, Zhang D, Sharp DJ. Poleward tubulin flux in spindles: Regulation and function in mitotic cells. Molecular Biology of the Cell. 2007;18:3094–3104. doi: 10.1091/mbc.E06-11-0994. [DOI] [PMC free article] [PubMed] [Google Scholar]
- 56.McDonald KL, O’Toole ET, Mastronarde DN, McIntosh JR. Kinetochore microtubules in Ptk cells. Journal of Cell Biology. 1992;118:369–383. doi: 10.1083/jcb.118.2.369. [DOI] [PMC free article] [PubMed] [Google Scholar]
- 57.Rieder C. The formation, structure, and composition of the mammalian kinetochore and kinetochore fiber. International Review of Cytology. 1982;1979:1–58. doi: 10.1016/s0074-7696(08)61672-1. [DOI] [PubMed] [Google Scholar]
- 58.McEwen BF, Heagle AB. Electron microscopic tomography: A tool for probing the structure and function of subcellular components. International Journal of Imaging Systems and Technology. 1997;8:175–187. [Google Scholar]
- 59.Hutchins JR, et al. Systematic analysis of human protein complexes identifies chromosome segregation proteins. Science. 2010;328:593–599. doi: 10.1126/science.1181348. [DOI] [PMC free article] [PubMed] [Google Scholar]
- 60.Neumann B, et al. Phenotypic profiling of the human genome by time-lapse microscopy reveals cell division genes. Nature. 2010;464:721–727. doi: 10.1038/nature08869. [DOI] [PMC free article] [PubMed] [Google Scholar]
- 61.Johnson VL, Scott MI, Holt SV, Hussein D, Taylor SS. Bub1 is required for kinetochore localization of BubR1, Cenp-E, Cenp-Fand Mad2, and chromosome congression. Journal of Cell Science. 2004;117:1577–1589. doi: 10.1242/jcs.01006. [DOI] [PubMed] [Google Scholar]
- 62.Klebig C, Korinth D, Meraldi P. Bub1 regulates chromosome segregation in a kinetochore-independent manner. journal of Cell Biology. 2009;185:841–858. doi: 10.1083/jcb.200902128. [DOI] [PMC free article] [PubMed] [Google Scholar]
- 63.Khodjakov A, Pines J. Centromere tension: A divisive issue. Nature Cell Biology. 2010;12:919–923. doi: 10.1038/ncb1010-919. [DOI] [PMC free article] [PubMed] [Google Scholar]
- 64.Amaro AC, et al. Molecular control of kinetochore-microtubule dynamics and chromosome oscillations. Nature Cell Biology. 2010;12:319–329. doi: 10.1038/ncb2033. [DOI] [PMC free article] [PubMed] [Google Scholar]
- 65.Coue M, Lombillo VA, McIntosh JR. Microtubule depolymerization promotes particle and chromosome movement in vitro. Journal of Cell Biology. 1991;112:1165–1175. doi: 10.1083/jcb.112.6.1165. [DOI] [PMC free article] [PubMed] [Google Scholar]
- 66.Asbury CL, Tien JF, Davis TN. Kinetochores’ gripping feat: Conformational wave or biased diffusion? Trends in Cell Biology. 2011;21:38–46. doi: 10.1016/j.tcb.2010.09.003. [DOI] [PMC free article] [PubMed] [Google Scholar]
- 67.McIntosh JR, et al. Fibrils connect microtubule tips with kinetochores: A mechanism to couple tubulin dynamics to chromosome motion. Cell. 2008;135:322–333. doi: 10.1016/j.cell.2008.08.038. [DOI] [PMC free article] [PubMed] [Google Scholar]
- 68.VandenBeldt KJ, et al. Kinetochores use a novel mechanism for coordinating the dynamics of individual microtubules. Current Biology. 2006;16:1217–1223. doi: 10.1016/j.cub.2006.04.046. [DOI] [PMC free article] [PubMed] [Google Scholar]
- 69.Dong Y, Vanden Beldt KJ, Meng X, Khodjakov A, McEwen BF. The outer plate in vertebrate kinetochores is a flexible network with multiple microtubule interactions. Nature Cell Biology. 2007;9:516–522. doi: 10.1038/ncb1576. [DOI] [PMC free article] [PubMed] [Google Scholar]
- 70.Welburn JP, et al. The human kinetochore Ska1 complex facilitates microtubule depolymerization-coupled motility. Developmental Cell. 2009;16:374–385. doi: 10.1016/j.devcel.2009.01.011. [DOI] [PMC free article] [PubMed] [Google Scholar]
- 71.Powers AF, et al. The Ndc80 kinetochore complex forms load-bearing attachments to dynamic microtubule tips via biased diffusion. Cell. 2009;136:865–175. doi: 10.1016/j.cell.2008.12.045. [DOI] [PMC free article] [PubMed] [Google Scholar]
- 72.Meraldi P, McAinsh A, Rheinbay E, Sorger PK. Phylogenetic and structural analysis of centromeric DNA and kinetochore proteins. Genome Biology. 2006;7:R23. doi: 10.1186/gb-2006-7-3-r23. [DOI] [PMC free article] [PubMed] [Google Scholar]
- 73.DeLuca JG, et al. Kinetochore microtubule dynamics and attachment stability are regulated by Hec1. Cell. 2006;127:969–982. doi: 10.1016/j.cell.2006.09.047. [DOI] [PubMed] [Google Scholar]
- 74.Hill TL. Theoretical problems related to the attachment of microtubules to kinetochores. Proceedings of the National Academy of Sciences. 1985;82:4404–4408. doi: 10.1073/pnas.82.13.4404. [DOI] [PMC free article] [PubMed] [Google Scholar]
- 75.Lombillo VA, Stewart RJ, McIntosh JR. Minus-end-directed motion of kinesin-coated microspheres driven by microtubule depolymerization. Nature. 1995;373:161–164. doi: 10.1038/373161a0. [DOI] [PubMed] [Google Scholar]
- 76.Asbury CL, Gestaut DR, Powers AF, Franck AD, Davis TN. The Dam1 kinetochore complex harnesses microtubule dynamics to produce force and movement. Proceedings of the National Academy of Sciences. 2006;103:9873–9878. doi: 10.1073/pnas.0602249103. [DOI] [PMC free article] [PubMed] [Google Scholar]
Associated Data
This section collects any data citations, data availability statements, or supplementary materials included in this article.
Supplementary Materials
Movie 1
Movie 2
Supplement