HapMap tagSNP transferability in multiple populations: general guidelines (original) (raw)
. Author manuscript; available in PMC: 2009 Jul 1.
Abstract
This PDF receipt will only be used as the basis for generating PubMed Central (PMC) documents. PMC documents will be made available for review after conversion (approx. 2–3 weeks time). Any corrections that need to be made will be done at that time. No materials will be released to PMC without the approval of an author. Only the PMC documents will appear on PubMed Central -- this PDF Receipt will not appear on PubMed Central.
Linkage disequilibrium (LD) has received much recent attention because of its value in localizing disease-causing genes. Due to the extensive LD between neighboring loci in the human genome, it is believed that a subset of the single nucleotide polymorphisms in a region (tagSNPs) can be selected to capture most of the remaining SNP variants. In this study, we examined LD patterns and HapMap tagSNP transferability in more than 300 individuals. A South Indian and an African Mbuti Pygmy population sample were included to evaluate the performance of HapMap tagSNPs in geographically distinct and genetically isolated populations. Our results show that HapMap tagSNPs selected with _r_2 >= 0.8 can capture more than 85% of the SNPs in populations that are from the same continental group. Combined tagSNPs from HapMap CEU and CHB+JPT serve as the best reference for the Indian sample. The HapMap YRI are a sufficient reference for tagSNP selection in the Pygmy sample. In addition to our findings, we reviewed over 25 recent studies of tagSNP transferability and propose a general guideline for selecting tagSNPs from HapMap populations.
Keywords: tagSNPs, transferability, single nucleotide polymorphism, linkage disequilibrium, genome-wide association study
Introduction
Linkage disequilibrium (LD) has been instrumental in localizing many Mendelian disease-causing genes [1; 2; 3], and it holds great promise for mapping genes related to complex disease [4; 5; 6]. In addition, LD plays a crucial role in other areas of human genetics, including studies of human population structure and migration history [7]. Since portions of the human genome are in extensive LD, certain single nucleotide polymorphisms (SNPs) can be selected to represent other nearby SNPs that are in strong LD with them and therefore largely redundant. A set of such SNPs (i.e. tagSNPs) can be used to capture the vast majority of SNP variation in a region, thereby reducing the genotyping cost significantly [8].
The International HapMap Project is an effort to identify and catalog common genetic variants (mostly SNPs) in the human genome [9]. It is believed that tagSNPs selected from HapMap populations will be useful for association studies performed in other populations [9; 10]. With the completion of phase II of the HapMap project [11], more than three million SNPs have been genotyped in 270 individuals from the four HapMap populations: Yoruba from Ibadan, Nigeria (YRI), Japanese from Tokyo, Japan (JPT), Han Chinese from Beijing, China (CHB) and Utah residents with northern and western European ancestry (CEU). These data give researchers an unprecedented opportunity to select tagSNPs to cut genotyping costs while maintaining sufficient power to detect disease-causing mutations. Nevertheless, it is known that LD patterns and haplotype blocks can vary across populations due to their unique histories [12; 13; 14]. Several earlier studies suggested that tagSNPs should be assessed in each individual population [15; 16; 17]. To evaluate the usefulness of tagSNPs selected from HapMap populations, it is critical to evaluate the similarity of haplotypes in different populations (especially isolated ones) and whether tagSNPs can capture most of the variants in these populations. To assess LD and haplotype variation among populations and to examine the transferability of HapMap tagSNPs, we genotyped 141 SNPs in more than 300 individuals from 20 populations around the world, including a South Indian population sample composed of two tribal groups and a genetically distinct African Mbuti Pygmy population sample that has not been previously evaluated for LD.
Results
Populations
A total of 325 individuals from 20 world-wide populations are included in the analysis, with geographic information and sample sizes shown in Figure 1. The HapMap populations represent three major continental groups: CEU for Europe, YRI for sub-Saharan Africa, and CHB+JPT for East Asia. For direct comparison with HapMap populations, three continental population groups were constructed from our samples based on individual ancestry: 104 unrelated individuals of northern European descent (EUR), 145 unrelated individuals from sub-Saharan Africa (AFR, including the Mbuti Pygmy group), and 59 unrelated individuals from East Asia (EAS). These groups can be compared with the HapMap population groups CEU, YRI and CHB+JPT, respectively. Two populations were analyzed as examples of more challenging populations for tagSNP transfer: 17 unrelated individuals from two tribal non-caste populations (Irula and Khonda Dora) in South India (IND), which do not correspond to any HapMap continental group; and 37 unrelated individuals from an African Mbuti Pygmy group (PYG), which is genetically distinct from other African populations [18; 19].
Figure 1. Populations examined.

Number of individuals in each population sample is given in parentheses.
To examine the degree of population differentiation, we calculated pairwise Fst estimates between HapMap populations and our populations (Table 1). The AFR, EAS and EUR samples show almost no differentiation from the corresponding HapMap YRI, CHB+JPT and CEU samples (Fst values of 0.010, 0 and 0.003, respectively). The Indian sample is more divergent from the HapMap CHB+JPT and CEU groups (Fst values of 0.055 and 0.074, respectively), consistent with India’s intermediate geographic location between Europe and East Asia. Mbuti Pygmies show substantial differentiation from all HapMap populations, including HapMap YRI (Fst = 0.043).
Table 1.
Pairwise Fst distances between HapMap populations and those of the present study.
| YRI | CHB+JPT | CEU | |
|---|---|---|---|
| AFR | 0.010 | 0.201 | 0.153 |
| EAS | 0.191 | 0.000 | 0.075 |
| EUR | 0.123 | 0.082 | 0.003 |
| IND | 0.136 | 0.055 | 0.074 |
| PYG | 0.043 | 0.231 | 0.186 |
Allele frequencies and Pairwise LD patterns
A total of 141 SNPs from 14 genomic regions on eight different chromosomes were genotyped. Each region is about 50kb in length and contains ten SNPs on average (Table 2). SNP genotype data for HapMap populations were obtained from the HapMap project website. We first compared allele frequencies between HapMap populations and our three continental groups. Figure 2A shows that each of our continental groups has the highest allele frequency correlation with its corresponding HapMap population. Spearman’s correlation coefficients (rho) are 0.95, 0.96 and 0.95 for AFR vs. YRI, EAS vs. CHB+JPT and EUR vs. CEU, respectively. In comparisons between population samples from different continents, the correlations range from as low as 0.30 for AFR vs. CHB+JPT to a maximum of 0.70 for EAS vs. CEU.
Table 2.
Fourteen genomic regions genotyped in this study
| Region | SNPs | Chromosomal Position (NCBI build 36) | Gene Content 1 | Distance to Telomere/Centromere 2 | Recombination Hotspots 3 |
|---|---|---|---|---|---|
| 01_chr4 | 10 | chr4:118570829-118604338 | Geneless | - | 1 |
| 02_chr2 | 12 | chr2:118396837-118446760 | CCDC93 | - | None |
| 03_chr2 | 10 | chr2:51812762-51860087 | Geneless | - | 1 |
| 04_chr4 | 8 | chr4:118704627-118751776 | Geneless | - | 2 |
| 05_chr4 | 10 | chr4:118511074-118549903 | Geneless | - | None |
| 06_chr4 | 10 | chr4:74981921-75037270 | Geneless | - | None |
| 07_chr6 | 10 | chr6:165635865-165694591 | C6orf118, PDE10A | - | 2 |
| 08_chr7 | 11 | chr7:116635430-116686530 | ST7 | - | None |
| 09_chr11 | 12 | chr11:1997573-2054530 | Geneless | 2Mb from Telomere | 2 |
| 10_chr12 | 9 | chr12:38942446-38976973 | LRRK2 | 2.4Mb from Centromere | None |
| 11_chr16 | 11 | chr16:61666033-61707014 | Geneless | - | None |
| 12_chr18 | 9 | chr18:23749694-23794966 | CDH2 | - | 3 |
| 13_chr18 | 9 | chr18:24074314-24115028 | Geneless | - | 1 |
| 14_chr18 | 10 | chr18:24120336-24160471 | Geneless | - | None |
Figure 2. Correlations of allele frequencies (A) and LD measures (_r_2) for all SNP pairs (B) between HapMap populations and corresponding continental groups.

Spearman’s correlations (rho) are shown.
A comparison of pairwise LD (measured as _r_2) for all pairs of SNPs in each region shows similar patterns across populations (Figure 2B). The Spearman’s rho value for the pairwise _r_2 values are 0.84, 0.94 and 0.95 for AFR vs. YRI, EAS vs. CHB+JPT and EUR vs. CEU, respectively. For between-continent comparisons, the correlations range from 0.63 for AFR vs. CEU to 0.75 for EUR vs. CHB+JPT. Similar analyses were performed using _D_′ as a measure of LD, although all correlations for _D_′ are lower compared to those of _r_2 (not shown). The lower correlation of _D_′ values may be largely caused by a ceiling effect of this measurement [20].
We then compared allele frequencies and LD patterns of HapMap populations with the Indian and Pygmy population samples. Allele frequencies in these two populations are less correlated with the corresponding frequencies in the HapMap populations than was the case for our continental groups (Figure 3). Allele frequencies for Indians show the highest correlation with the HapMap JPT+CHB (rho=0.71), and Mbuti Pygmies correlate best with the HapMap YRI (rho=0.87). Pairwise LD (_r_2) values also show a weaker correlation with HapMap populations, relative to the results of our continental groups. LD patterns in Indians are correlated with LD in the HapMap CHB+JPT and CEU populations to a similar degree (rho=0.76 and 0.71, respectively) and to a lesser degree with YRI (rho=0.62). The LD pattern in Mbuti Pygmies is most similar to that in the HapMap YRI population (rho=0.60; Figure 4), although the correlation is less than the correlation between AFR and YRI (rho=0.84; Figure 2B).
Figure 3. Correlation of allele frequency between HapMap populations and A) Indians; B) Mbuti Pygmies.

Spearman’s correlations (rho) are shown.
Figure 4. Correlation of pairwise LD (_r_2) between HapMap populations and A) Indians; B) Mbuti Pygmies.

Spearman’s correlations (rho) are shown.
HapMap tagSNP transferability in comparable continental groups
To examine the transferability and tagging efficiency of HapMap tagSNPs in major continental groups, tagSNPs in each genomic region were selected from each HapMap population so that 100% of the known polymorphic SNPs in each region would be captured with _r_2 >= 0.8 in that population. These sets of tagSNPs were then evaluated in each of our continental groups to determine the SNP capture rate: the percentage of SNPs captured at _r_2 >= 0.8 when using a pairwise tagging algorithm. These SNP capture rates show how well the chosen tagSNPs represent haplotype variation in other populations. The tagging efficiency is evaluated by the total number of the captured SNPs divided by the number of tagSNPs used, i.e. the number of SNPs captured per tagSNP. By calculating per tagSNP capture rate, we effectively normalize the different number of tagSNPs selected from each HapMap population. The more SNPs captured per tagSNP, the more efficient the tagSNP strategy will be.
Figure 5A shows the SNP capture rate averaged over all 14 regions. TagSNPs selected from HapMap CEU, CHB+JPT and YRI captured 93%, 86% and 94% of SNPs in the corresponding continental groups in our dataset EUR, EAS and AFR, respectively. It may seem curious that YRI has the highest total capture rate among three HapMap groups. However, figure 5B shows that YRI has the lowest per-tagSNP capture rate among the three tests (1.69, 1.73 and 1.25 in CEU, CHB+JPT and YRI, respectively). Therefore, the high capture rate in YRI is a result of the larger number of tagSNPs (102 out of 135 of total SNPs) selected in this population, and lower tagging efficiency.
Figure 5. HapMap tagSNP transferability and tagging efficiency.

(A) HapMap tagSNP transferability in three continental groups (AFR, EAS and EUR) and two populations (IND and PYG) are shown. The average transferability among all 14 regions are shown as bars, and the transferability for each individual region are shown as black dots. For example, the first blue bar in the “AFR” section indicates that tagSNPs selected from the HapMap CEU population captured ~60% of the SNPs with _r_2 >= 0.8 in our Africans, on average. (B) HapMap tagSNP tagging efficiency. The average tagging efficiency across all 14 regions are shown as bars, and the tagging efficiencies for each region are shown as black dots. For example, the last brown bar in the “PYG” section indicates that on average every HapMap YRI tagSNPs captured 1.21 SNPs in our African Pygmy samples.
When applied to data from continental groups other than the ones from which they were chosen, most HapMap tagSNP sets still captured more than 80% of SNPs, with the exception of the tagSNPs selected from CEU or CHB+JPT, which only captured 66% and 62% of SNPs in AFR, respectively. Interestingly, tagSNPs from CEU show a higher capture rate (90%) in EAS compared to those from CHB+JPT. Closer examination revealed that CHB+JPT tagSNP set has a higher tagging efficiency (1.73) compared to CEU (1.65), as the CHB+JPT tagSNP set captured more “un-typed” SNPs (SNPs that are not selected as tagSNPs) in EAS (Figure 5B).
When each region was examined individually, we found that tagSNP transferability varies considerably among different chromosomal regions (Supplemental Figure 1). For example, in regions 2 and 10, ~30% of the SNPs were selected as tagSNPs in all HapMap populations. In region 2, all three tagSNP sets capture more than 90% of the SNPs in EAS. In contrast, in region 10, they only capture ~50% of the SNPs in EAS, reflecting very different LD patterns among populations in this region.
To examine variation in tagSNP transferability among regions, we calculated the average SNP capture rate in each of the 14 regions for each continental group (i.e., capture rate of AFR by HapMap YRI tagSNPs, EAS by CHB+JPT tagSNPs, and EUR by CEU tagSNPs). Regions 5 and 10 have the lowest average SNP capture rates (73% in each region), while the rates in the other 12 regions ranged from 83% to 100%. The low capture rates show no apparent correlation with recombination hotspots, since neither region contains known recombination hotspot (Table 2). While seven of the other 12 regions do contain known hotspots, they showed no apparent decrease in the capture rate (Region 12, for example, contains three hotspots but has an average capture rate of 96%). Distance to cetromere or telomere represents another factor that may influence the LD pattern. Region 10 resides within 3Mb of the centromere of chromosome 12 and region 5 is not located within 5Mb of the telomere or centromere. Other factors, such as gene content and GC content, can also influence LD patterns [21]. In our case, region 5 contains no genes, while region 10 is located within the LRRRK2 gene (Table 2). Since no apparent genomic pattern can be identified in the two regions with the lowest SNP capture rate and most above-mentioned factors have been shown to account for only a small proportion of the variance in LD [21], much of the variation observed in our regions may be attributed simply to the high level of stochastic variation inherent in the evolutionary process [22].
HapMap tagSNP transferability in Indian and Pygmy population samples
We next evaluated the transferability of HapMap tagSNPs to our tribal Indian and Pygmy samples. As shown in Figure 5A, YRI, CEU, and CHB+JPT tagSNPs capture 99%, 93% and 83% of the total SNPs in our Indian sample, respectively. Because Indian populations are both geographically and genetically intermediate between European and East Asian populations [18; 19; 23], we combined tagSNPs previously identified in CEU and CHB+JPT into a single set and examined its performance. We found that the combined set had a 97% capture rate with a per tagSNP capture rate of 1.38 (Table 3). Therefore, the combined set represents a better reference for the Indian sample with less genotyping cost (per tagSNP capture rate of 1.38 as compared to 1.29 of YRI) and minimum loss of information (97% capture rate compared to 93% for CEU) compared to a single HapMap population. When genotyping savings is the primary concern, the CEU set provides good coverage (93%) with an extra 21% per tagSNP capture rate (1.67 vs. 1.38) compared to the combined set (Table 3).
Table 3.
HapMap tagSNP transferability and efficiency
| Testing Pop. | Reference HapMap Pop. | Total SNPs | % of SNPs captured with r2>0.8 | No. of SNPs captured by each tagSNPs | Mean Maximum r2 |
|---|---|---|---|---|---|
| Pairwise Tagging | |||||
| AFR | CEU | 135 | 65.9 | 1.20 | 0.98 |
| CHB+JPT | 135 | 62.2 | 1.25 | 0.98 | |
| YRI | 135 | 94.1 | 1.25 | 0.98 | |
| EAS | CEU | 135 | 90.4 | 1.65 | 0.98 |
| CHB+JPT | 135 | 85.9 | 1.73 | 0.97 | |
| YRI | 135 | 96.3 | 1.27 | 0.99 | |
| EUR | CEU | 135 | 92.6 | 1.69 | 0.97 |
| CHB+JPT | 135 | 81.5 | 1.64 | 0.97 | |
| YRI | 135 | 97.0 | 1.28 | 0.99 | |
| IND | CEU | 135 | 92.6 | 1.67 | 0.99 |
| CHB+JPT | 135 | 83.0 | 1.65 | 0.99 | |
| YRI | 135 | 98.5 | 1.29 | 1 | |
| CEU+CHB+JPT | 135 | 97.0 | 1.38 | 1 | |
| PYG | CEU | 134 | 70.2 | 1.27 | 0.98 |
| CHB+JPT | 134 | 67.2 | 1.32 | 0.98 | |
| YRI | 134 | 93.3 | 1.21 | 0.99 | |
| Aggressive Tagging | |||||
| AFR | CEU | 135 | 60.7 | 1.17 | 0.99 |
| CHB+JPT | 135 | 57.0 | 1.20 | 0.98 | |
| YRI | 135 | 85.9 | 1.21 | 0.99 | |
| EAS | CEU | 135 | 87.4 | 1.69 | 0.98 |
| CHB+JPT | 135 | 85.2 | 1.80 | 0.96 | |
| YRI | 135 | 97.8 | 1.38 | 0.99 | |
| EUR | CEU | 135 | 90.4 | 1.74 | 0.96 |
| CHB+JPT | 135 | 83.0 | 1.75 | 0.97 | |
| YRI | 135 | 97.0 | 1.36 | 0.98 | |
| IND | CEU | 135 | 90.4 | 1.69 | 0.99 |
| CHB+JPT | 135 | 83.0 | 1.72 | 0.99 | |
| YRI | 135 | 97.0 | 1.35 | 1 | |
| CEU+CHB+JPT | 135 | 96.3 | 1.38 | 1 | |
| PYG | CEU | 134 | 65.7 | 1.26 | 0.99 |
| CHB+JPT | 134 | 61.2 | 1.26 | 0.98 | |
| YRI | 134 | 88.1 | 1.22 | 0.99 |
For the Mbuti Pygmy sample, YRI tagSNPs capture more than 93% of total SNPs, while tagSNPs from CEU and CHB+JPT only capture 70% and 67%, respectively. Therefore, despite the fact that the YRI set requires the lowest per tagSNP capture rate (1.21), it represents the best reference population in terms of maximizing the information gained (Figure 5B).
Performance of pairwise and aggressive tagging algorithm
Finally, we compared the performance of the pairwise tagging algorithm to the aggressive tagging algorithm provided in Haploview. In addition to the pairwise tagging steps in which the algorithm selects a set of markers to capture all SNPs in a dataset with pairwise _r_2 larger than a pre-set threshold [16], the aggressive tagging algorithm also searches for combinations of multiple markers as predictors for certain alleles and removes the redundant individual tagSNPs during the process. Therefore, higher tagging efficiency can be achieved by this algorithm [24]. The two tagging algorithms performed similarly in our dataset (Table 3). This may be due to the relatively small regions (~50kb) in this study, which prevented the multi-marker approach from making use of long-range LD.
Discussion
Linkage disequilibrium patterns, and thus tagSNP transferability rates, can be influenced both by the demographic histories of populations and by genomic factors. In accord with other studies, our data show less LD in African than in non-African populations [9], and we find that geographically isolated populations have somewhat lower tagSNP transferability rates. We also observed variation in tagSNP transferability rates among different genomic regions. This may reflect the inherent stochasticity in evolution and the influence of factors that can alter the LD pattern in a region, such as the presence of recombination hotspots, gene content, GC content, and distance relative to centromeres and telomeres.
To date, more than 25 studies have assessed the tagSNPs transferability in a range of world-wide populations (detailed in Table 4). In the following section, we combine the results of our study with those of other recent studies to compose general guidelines for tagSNP selection based on HapMap populations. Figure 6 summarizes the guidelines in a flowchart.
Table 4.
A summary of tagSNP transferability studies.
| Year | No. of Populations | No. of Individuals | Populations | Regions | No. of SNPs | Conclusion | Reference |
|---|---|---|---|---|---|---|---|
| 2003 | 3 | 96trios | Chinese, Malysian, Utah CEPH | SCN1A gene | 31 | TagSNPs chosen from CEPH work poorly in Malay or Chinese. TagSNPs should be chosen from closely related populations. | [17] |
| 2004 | 5 | 1635 | Gambian, British, Norwegian, Finnish, Romanian | VDR gene region, 94Kb | 55 | TagSNPs chosen from each European population can capture most SNPs in other European populations, but performed poorly in Gambians. | [30] |
| 2004 | 3 | 242 | UK Caucasian, African-American, CEPH European | Chr20, 10Mb | 2139 | TagSNPs selected from UK Caucasians can capture 96% and 84% of haplotypes in CEPH Europeans and African Americans, respectively. | [25] |
| 2005 | 44 | 1262 | CEPH Human Genome Diversity Panel (HGDP-CEPH) | CTLA4gene, 14 Kb | 17 | With 2 to 4 tagSNPs, tagSNP sets work well within continental groups, but work poorly across continental groups. | [53] |
| 2005 | 9 | ~1200 | 9 European populations | 4 genes, 749 Kb | 100 | TagSNPs selected from HapMap CEU captured more than 70% of SNPs in three genes for most populations (except two in LMNA gene), but only 2 populations in the PLAU gene. | [32] |
| 2006 | 52 | 927 | HGDP-CEPH | 36 regions, ~12 Mb | 2834 | The geographically nearest HapMap population usually yields the best tagSNPs for target populations. Populations with low LD, especially African populations, require higher tagSNP density. | [28] |
| 2006 | 38 | 1055 | HGDP-CEPH | Chr22, 1 Mb | 144 | TagSNPs are highly informative in populations within the same continental group and often efficient for more distant and differentiated populations. | [13] |
| 2006 | 38 | ~2000 | Allele FREquency Database (ALFRED) | 10 regions, 338 Kb | 134 | TagSNPs transfer better from “older” and more diverse populations to “younger” populations. | [14] |
| 2006 | 15 | 869 | 4 HapMap populations, 3 HGDP populations, 6 Multiethnic Cohort (MEC) populations, Finnish and African-American | 25 genes, 2.6 Mb | 1679 | TagSNPs selected from HapMap populations capture the majority of common haplotypes in many other populations and provide good power for association study involving common variants. | [27] |
| 2006 | 7 | 318 | European, African, 5 East Asian populations | entire Chr21 | 19060 | TagSNPs selected from East Asia populations are portable within the group. Fst between populations can be used to evaluate the portability of tagSNPs. | [26] |
| 2006 | 7 | 396 | CEU, 5 MEC populations, Chinese | 61 genes, 5.7 Mb | 2783 | Using tagSNPs from CEU, ~80% or more of SNPs were captured in non-African populations, but only 50% in African Americans. | [29] |
| 2006 | 4 | 185 | Caucasian, CEPH, Han Chinese, Japanese | Chr20, 10 Mb | 1012–2100 | TagSNPs selected from the four populations have similar power among these populations in simulated association studies. | [54] |
| 2006 | 1 | 1425 | Finnish | Chr14, 17.9 Mb | 956 | HapMap CEU samples provide an adequate basis for tagSNPs selection in Finnish individuals. | [33] |
| 2006 | 1 | 845 | Spanish | 66 cancer-associated genes, ~7 Mb | 491 | TagSNPs selected from HapMap CEU tagged more than 70% of SNPs in 64 genes in a Spanish population (>80% in 58 genes). | [34] |
| 2006 | 1 | 1054 | Estonian | Two ENCODE regions, 500 Kb each | ~1400 | HapMap CEU tagSNPs capture more than 90% of SNPs in Estonians. | [35] |
| 2006 | 1 | 44 | European | 4 regions, 14.4 Mb | ~800 | TagSNPs from HapMap CEU data captured 98% of SNPs in the cohort. | [36] |
| 2006 | 1 | 90 | Korean | Chr7 ENCODE region, 500 Kb | 792 | ~90% transferability from HapMap CHB+JPT to Korean. | [38] |
| 2006 | 1 | 359 | Australian | Chr 6, 3.7 Mb; Chr10, 1.3 Mb | 633 | HapMap CEU will be useful for tagSNP selection in Australians with European ancestry. | [37] |
| 2006 | 1 | 30 | Kosraen trios | Whole genome | ~110,000 | Over 98% of Kosraen haplotypes are present in the HapMap CEU, JPT and CHB populations. | [42] |
| 2006 | 1 | 280 | Thai | 166 drug-related genes | 861 | TagSNPs chosen from HapMap CHB+JPT captured 98% of Thai SNPs. | [55] |
| 2006 | 1 | 90 | Korean | 3 ENCODE regions, 500 Kb each | 886 | TagSNPs chosen from HapMap CHB+JPT captured more than 80% of Korean SNPs in all three regions. | [56] |
| 2007 | 38 | 1979 | ALFRED | 6 regions, ~2.6 Mb | 248 | Moving out Africa, the western populations can be used as references to reconstruct “untyped” SNPs in their eastern neighbors, with the exception of isolated populations. | [31] |
| 2007 | 10 | 320 | Indian | 3 genes, 12 Kb | ~60 | HapMap CEU works well for some Indian groups, not for others. | [47] |
| 2007 | 1 | 22 | Sami | Chr21, 3.3 Mb | 3188 | 46% of SNPs in Sami are not present in HapMap dataset, and 43% of the Sami-unique SNPs are not tagged by HapMap CEU tagSNPs. | [46] |
| 2007 | 1 | 80 | Filipino | 40 Kb central regions of 10 ENCODE regions | ~627 | TagSNPs chosen from HapMap CHB or JPT captured more than 80% of Cebu Filipinos SNPs. | [57] |
| 2008 | 1 | 101 | Sardinian | Chr22, 8 Mb | 771 | HapMap CEU is sufficient for tagSNP selection in Sardinians. | [58] |
Figure 6.
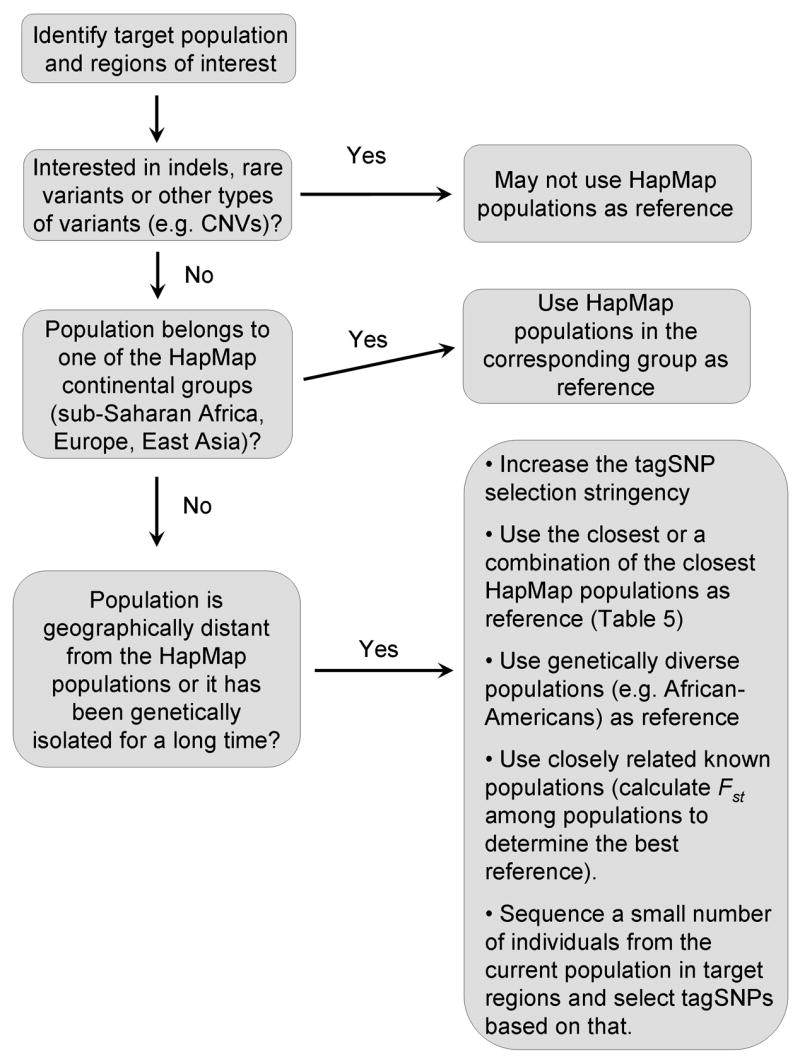
A flow chart for tagSNP selection using HapMap populations.
If the population under consideration belongs to the same continental group (i.e. sub-Saharan Africa, Europe, and East Asia) as one of the HapMap populations, it is intuitive to choose tagSNPs from that HapMap population. Results from this study (Figure 5) and other studies analyzing a number of world-wide populations support this approach [13; 25; 26; 27; 28; 29; 30; 31].
In a study using the CEPH Human Genome Diversity Panel (HGDP-CEPH) [28], tagSNPs were picked from HapMap samples to capture all SNPs at _r_2 > 0.85. The HapMap population located geographically closest to the population to be tagged yielded the best results for most populations except for Mayans (best results from CEU set) and Mozabites (best results from YRI set). This result may reflect recent European admixture in Mayans and African ancestry in Mozabites. Populations from another world-wide collection, the ALlele FREquency Database (ALFRED) with ~2000 individuals from 38 populations, have also been evaluated [31]. Instead of looking at the portability of the tagSNPs, the authors developed an algorithm to utilize tagSNPs to reconstruct un-typed SNPs in other populations. Their results indicate that, proceeding eastward from Africa, the western population in two adjacent populations can generally be used as a reference for its eastern neighbor. The exceptions are populations that are known to have been isolated for many years, such as Samaritans or Pacific Islanders. Interestingly, Paschou et al. [31] found that due to its high genetic diversity, the African-American population is the only one that can be used to predict un-typed SNPs in almost all other populations in the sample.
In addition to studies that treat populations from multiple continental groups, several studies have focused on specific continental groups or populations [32; 33; 34; 35; 36; 37; 38]. These results, summarized in Table 4, suggest that in most cases, tagSNPs selected from the HapMap CEU and CHB+JPT populations can capture more than 80% of SNP variation in European and East Asian populations, respectively. TagSNPs selected from YRI usually capture more SNPs in sub-Saharan populations than tagSNPs from CEU or CHB+JPT. Nevertheless, due to the higher genetic diversity and lower LD in African populations [7; 39; 40; 41], fewer SNPs can be tagged in sub-Saharan African populations compared to European and Asian groups, given the same number of tagSNPs. As a general rule, if the population under consideration belongs to the same continental group as one of the HapMap populations, tagSNPs chosen from that HapMap population will work well (Table 5).
Table 5.
General guideline for tagSNP reference population selection.
| Continental regions | Target Population | Reference Population | Reference |
|---|---|---|---|
| Sub-Saharan Africa | African-American | YRI | [14; 27; 29] |
| Bantu Speaker | YRI | [13; 14; 28] | |
| Biaka Pygmy | YRI | [13; 14; 28] | |
| Mandenka | YRI | [13; 28] | |
| Mbuti Pygmy | YRI | This study; [13; 14; 28] | |
| San | YRI | [13; 28] | |
| Yoruba | YRI | [13; 14; 27; 28] | |
| Ibo | YRI | [14] | |
| Ethiopian Jews | YRI | [14] | |
| Middle East | Bedouin | CEU/YRI | [13; 28] |
| Druze | CEU/YRI | [13; 14; 28] | |
| Mozabite | YRI | [13; 28] | |
| Palestinian | CEU/YRI | [13; 28] | |
| Europe | Adygei | CEU | [13; 14; 28] |
| Australian with European ancestry | CEU | [37] | |
| Basque | CEU | [13; 28] | |
| British | CEU | [25; 30] | |
| Italian | CEU | [13; 28; 32] | |
| Estonian | CEU | [32; 35] | |
| Finn | CEU | [14; 27; 30; 33] | |
| French | CEU | [13; 28] | |
| German | CEU | [32] | |
| Norwegian | CEU | [30] | |
| Orcadian | CEU | [13; 28] | |
| Romanian | CEU | [30] | |
| Russian | CEU | [13; 14; 28] | |
| Sami | CEU | [46] | |
| Sardinian | CEU | [13; 28; 58] | |
| Spanish | CEU | [34] | |
| Central/South Asia | Balochi | CEU | [13; 28] |
| Brahui | CEU | [13; 28] | |
| Burusho | CEU | [13; 28] | |
| Hazara | CEU | [13; 28] | |
| Indian | CEU+CHB +JPT | This study; [47] | |
| Kalash | CEU | [13; 28] | |
| Makrani | CEU | [13; 28] | |
| Pathan | CEU | [13; 28] | |
| Sindhi | CEU | [13; 28] | |
| Uyghur | CEU | [26; 28] | |
| East/Southeast Asia | Cambodian | CHB+JPT | [13; 14; 28] |
| Han Chinese | CHB+JPT | [13; 14; 26; 27; 28] | |
| Northern Chinese (Daur, Hezhen, Mongola, Oroquen, Tu, Xibo) | CHB+JPT | [28] | |
| Southern Chinese (Ami, Atayal, Dai, Lahu, Miao, Naxi, Taiwanese, Tujia, She, Wa, Yi, Zhang) | CHB+JPT | [26; 28] | |
| Hakka | CHB+JPT | [14] | |
| Japanese | CHB+JPT | [13; 14; 27; 28] | |
| Korean | CHB+JPT | [38; 56] | |
| Yakut | CHB+JPT | [13; 14; 28] | |
| Filipino | CHB/JPT | [57] | |
| Thai | CHB+JPT | [55] | |
| Oceania | Melanesian | CHB+JPT | [13; 28] |
| Papuan | CHB+JPT | [13; 28] | |
| Native Hawaiian | CEU | [29] | |
| Micronesians | CEU/CHB/JPT | [14; 42] | |
| America | Colombian | CHB+JPT | [13; 28] |
| Karitiana | CHB+JPT | [13; 14; 28] | |
| Latino | CEU | [29] | |
| Maya | CEU | [13; 14; 28] | |
| Pima | CHB+JPT | [13; 14; 28] | |
| Surui | CHB+JPT | [13; 14; 28] |
In some cases, study samples do not correspond well to a HapMap continental group, such as populations in the Middle East or America. To test the HapMap tagSNP transferability in these populations, we examined a South Indian tribal population sample as a representative. Our results indicate that a combination of tagSNPs selected from CEU and CHB+JPT capture more than 95% of SNPs in the Indian population. This supports the use of HapMap populations as references for populations whose geographic regions are not represented in the HapMap samples, albeit with higher genotyping cost.
A number of other studies showed that using the geographically nearest reference population or a combination of adjacent populations as a reference usually gives the best results for these populations (Table 4) [13; 14; 28; 29; 42]. Specifically, HapMap YRI and/or CEU provide good portability for Middle East populations. TagSNPs selected from CEU have a better capture rate for populations from Central and South Asian regions than CHB+JPT. In Oceania, the HapMap CHB+JPT population can serve as a good reference for Papuans, Melanesians, Micronesians and Native Hawaiians. The HapMap CHB+JPT population can also be used as a reference for many Native American populations. It is noteworthy that, due in part to recent admixture between Native American and European populations, HapMap CEU sometimes serves as a better reference than CHB+JPT for Native American populations [28; 29] (Table 5).
For comparison with the HapMap populations, we have focused here on continental population groups. However, because genetic variation is often distributed in a clinal fashion, continents are not always the optimal units for grouping populations [43]. For example, West Asian populations may be genetically more similar to the HapMap CEU than the CHB+JPT samples. Recently, the International HapMap Consortium has proposed to extensively genotype and sequence samples from seven additional populations of diverse origins [11]. The additional information in these populations will improve tagSNP performance in populations that are not well represented by the three HapMap groups.
Because they may exhibit reduced genetic and environmental heterogeneity, isolated populations are thought to have a number of advantages when searching for genes related to complex diseases [44]. To gauge the portability and tagging efficiency of HapMap tagSNPs to isolated populations, we evaluated the tagSNP transferability in African Mbuti Pygmies. Genetically, Mbuti Pygmies are distinct from other African populations [45] and are often identified as a separate population from other Africans in genetic structure analyses [18; 19]. Previous analyses have shown that the Mbuti Pygmy sample used here is genetically similar to the much smaller Mbuti Pygmy sample included in the CEPH Diversity Panel [18; 19]. The Fst value of 4% between YRI and Mbuti Pygmies, obtained in this study, confirms a substantial genetic difference between these populations. Nevertheless, YRI still serves as a sufficient reference population in terms of tagSNP selection, yielding a capture rate of more than 90%, albeit with a low tagging efficiency (1.21 per tagSNP capture rate).
Other studies of isolated populations have shown varying degrees of transferability. Paschou et al. [31] found that in populations isolated for many years, like Samaritans or Pacific Islanders, genotypes cannot be reconstructed faithfully from tagSNPs selected from populations within the same continent. However, tagSNPs selected from African-Americans can better predict un-typed SNPs in these populations [31]. Johansson et al. [46] investigated the transferability of HapMap tagSNPs in the Sami population of northern Europe. When tagSNPs were selected from CEU with _r_2 > 0.8, only about 70% of the Sami SNPs were tagged, a percentage similar to the capture rate realized with the same number of randomly selected SNPs in the Sami. The low capture rate in this study may be caused by the difference in allele-frequency distributions in the two populations, since the untagged SNPs in Sami have significantly lower heterozygosity and minor allele frequencies compared to the tagged SNPs. Roy et al. [47] showed that tagSNPs selected with _r_2 > 0.8 from every population (including Europeans) can capture 70% to 100% of haplotype diversity in other populations, with the exception of Manipuri Brahmin. However, the small data set size (a single region of ~20kb containing ~20 SNPs) and sample size (e.g. 11 Manipuri Brahmin individuals) in this study does not permit generalization of their results.
Collectively, these results indicate that the portability of tagSNPs for isolated populations varies among populations and regions. In some cases, only half of the variation in a target population can be captured. In such situations, several strategies have been proposed to improve tagSNP performance. For example, a combined set of tagSNPs (“cosmopolitan tagSNPs”) from multiple populations can be used to increase tag capture rates in distinct populations [27; 48]. Another approach is to increase the tagSNP selection stringency (e.g. selecting tagSNPs using _r_2 = 0.9 instead of 0.8 as the threshold). A drawback of these approaches is that more tagSNPs have to be genotyped, lowering the tagging efficiency. Another strategy is to use populations other than the HapMap samples. Because closely related populations generally yield better tagging efficiency, Fst can be calculated among populations to determine which known population should serve as the best reference population [14; 26]. In some cases, using a genetically diverse population (e.g. African-Americans) as a reference may improve the performance of tagSNPs [31]. Lastly, if no appropriate reference population has been surveyed, a small number of individuals from the target population can be sequenced in the regions of interest, and tagSNPs can be selected specifically for that population [12; 13; 14].
There are several potential pitfalls when using HapMap populations as references. First, the HapMap project is designed for the optimal capture of common variants in populations [9]. As a result, the allele frequency distribution of HapMap SNPs is skewed toward intermediate frequencies. Rare variants are poorly represented and may not be tagged by tagSNPs selected from HapMap populations [31; 48]. Also, tagSNPs are likely to miss other types of variants, including insertion/deletion polymorphisms and structural variants, which are not included in the HapMap project [9]. An investigation of a ~30kb deletion polymorphism in the APOBEC gene region [49] showed that, despite the presence of the deletion in nearly 40% of the world’s population, no suitable tagSNPs could be selected for this variant from the HapMap Phase I data. Therefore, if the SNP allele frequency distribution in the target population differs markedly from that of the HapMap populations, or a study involves indels or rare variants, caution is needed when using HapMap tagSNPs. In addition, tagSNP transferability is also expected to vary across genomic regions. The stochastic nature of genome evolution and a number of genomic factors can influence variation in LD patterns, and thus tagSNP transferability. In any case, a good understanding of the genetic background, migration history, and allele frequency distribution of the target population will help in the tagSNP selection process.
With the rapid development of sequencing and genotyping technologies and ever-decreasing cost, more and more researchers are using microarray-based whole genome SNP genotyping or even re-sequencing of target regions for association studies. Nevertheless, the whole-genome approach is still expensive, particularly when many thousands of cases and controls are needed to detect alleles with small effects [6]. Therefore, a detailed understanding of population history and the transferability of tagSNPs will remain an important component of human genetic studies for years to come.
Materials and methods
Genomic regions and SNPs
Fourteen genomic regions on eight chromosomes were genotyped. Each region is about 50kb in length and non-coding SNPs were selected in each region to cover the region with a density of 5kb/SNP on average. Table 2 describes the position and properties (e.g. gene content) of the fourteen regions. These regions were initially selected to examine the effect of recently fixed Alu elements on homologous recombination. Extensive analyses revealed that the Alu elements had little or no effect on the local recombination rate (D.J. Witherspoon et. al., unpublished data). The SNPs were genotyped in a total of 351 individuals. The human population samples used for this study have been described previously [19; 50]. After genotyping, 26 individuals lacking genotypes at more than 50% of the typed loci were excluded from the subsequent analysis. The final dataset was composed of genotypes from 325 individuals with a missing data rate of 2.8%. All SNPs were genotyped using ABI SNaPshot multiplex system (Applied Biosystems, Foster City, CA). The SNP rs numbers and genotypes in each individual are shown in Supplemental Table 1. SNP loci that deviated strongly from Hardy-Weinberg equilibrium (rs508897, chi-square test, p<0.000001 in Africa), or with missing genotypes in one HapMap population (rs2311717), or SNPs that are fixed in any population (nine total) were removed before the analysis. The final number of SNPs used in each analysis is shown in Table 3.
HapMap genotypes for all of our selected SNPs were obtained from the HapMap website (release 16c.1 of phase I, June 2005). These SNPs were genotyped in 209 unrelated individuals (60 Yoruba, 60 Utah residents with northern and western European ancestry and 89 East Asians of Chinese and Japanese descent.).
Data analysis
Fst estimates between populations were calculated by the method described by Weir and Cockerham [51]. When population differentiation is weak, this method could result in negative Fst values due to sampling errors. In this case, the Fst value was rounded to zero. Measures of LD between pairs of SNP loci (_r_2 and _D_′) were calculated by Haploview (http://www.broad.mit.edu/mpg/haploview), using the confidence-interval method which accept un-phased genotypes as input [52]. TagSNPs were selected from each HapMap population using the Tagger program [24] in Haploview with the pairwise and aggressive tagging options. We selected the most commonly used standard (_r_2 >= 0.8 between tag- and tagged-SNPs as both selecting and evaluating thresholds) to evaluate tagSNP transferability. That is, tagSNPs were selected from each HapMap population so that 100% of the polymorphic SNPs that we genotyped in each region would be captured with _r_2 >= 0.8 in that population. These sets of tagSNPs were then evaluated in each of our continental groups to determine the SNP capture rate: the percentage of SNPs captured at _r_2 >= 0.8 when using a pairwise tagging algorithm.
Supplementary Material
01
02
Acknowledgments
The authors thank the two anonymous reviewers for their constructive and valuable comments. We would also like to thank Elizabeth Marchani for her useful comments during the preparation of this manuscript. This work was supported by grants from the National Science Foundation (BCS-0218370), and National Institutes of Health (GM-59290 and HL-070048).
Footnotes
Publisher's Disclaimer: This is a PDF file of an unedited manuscript that has been accepted for publication. As a service to our customers we are providing this early version of the manuscript. The manuscript will undergo copyediting, typesetting, and review of the resulting proof before it is published in its final citable form. Please note that during the production process errors may be discovered which could affect the content, and all legal disclaimers that apply to the journal pertain.
References
- 1.Hästbacka J, de la Chapelle A, Mahtani MM, Clines G, Reeve-Daly MP, Daly M, Hamilton BA, et al. The diastrophic dysplasia gene encodes a novel sulfate transporter: positional cloning by fine-structure linkage disequilibrium mapping. Cell. 1994;78:1073–1087. doi: 10.1016/0092-8674(94)90281-x. [DOI] [PubMed] [Google Scholar]
- 2.Puffenberger EG, Kauffman ER, Bolk S, Matise TC, Washington SS, Angrist M, Weissenbach J, et al. Identity-by-descent and association mapping of a recessive gene for Hirschsprung disease on human chromosome 13q22. Hum Molec Genet. 1994;8:1217–1225. doi: 10.1093/hmg/3.8.1217. [DOI] [PubMed] [Google Scholar]
- 3.Feder JN, Gnirke A, Thomas W, Tsuchihashi Z, Ruddy DA, Basava A, Dormishian F, Domingo R, Jr, Ellis MC, Fullan A, Hinton LM, Jones NL, Kimmel BE, Kronmal GS, Lauer P, Lee VK, Loeb DB, Mapa FA, McClelland E, Meyer NC, Mintier GA, Moeller N, Moore T, Morikang E, Wolff RK, et al. A novel MHC class I-like gene is mutated in patients with hereditary haemochromatosis. Nat Genet. 1996;13:399–408. doi: 10.1038/ng0896-399. [DOI] [PubMed] [Google Scholar]
- 4.Jorde LB. Linkage disequilibrium and the search for complex disease genes. Genome Res. 2000;10:1435–44. doi: 10.1101/gr.144500. [DOI] [PubMed] [Google Scholar]
- 5.Klein RJ, Zeiss C, Chew EY, Tsai J-Y, Sackler RS, Haynes C, Henning AK, SanGiovanni JP, Mane SM, Mayne ST, Bracken MB, Ferris FL, Ott J, Barnstable C, Hoh J. Complement Factor H Polymorphism in Age-Related Macular Degeneration. Science. 2005;308:385–389. doi: 10.1126/science.1109557. [DOI] [PMC free article] [PubMed] [Google Scholar]
- 6.Wellcome Trust Case Control Consortium. Genome-wide association study of 14,000 cases of seven common diseases and 3,000 shared controls. Nature. 2007;447:661–78. doi: 10.1038/nature05911. [DOI] [PMC free article] [PubMed] [Google Scholar]
- 7.Reich DE, Cargill M, Bolk S, Ireland J, Sabeti PC, Richter DJ, Lavery T, Kouyoumjian R, Farhadian SF, Ward R, Lander ES. Linkage disequilibrium in the human genome. Nature. 2001;411:199–204. doi: 10.1038/35075590. [DOI] [PubMed] [Google Scholar]
- 8.Johnson GC, Esposito L, Barratt BJ, Smith AN, Heward J, Di Genova G, Ueda H, Cordell HJ, Eaves IA, Dudbridge F, Twells RC, Payne F, Hughes W, Nutland S, Stevens H, Carr P, Tuomilehto-Wolf E, Tuomilehto J, Gough SC, Clayton DG, Todd JA. Haplotype tagging for the identification of common disease genes. Nat Genet. 2001;29:233–7. doi: 10.1038/ng1001-233. [DOI] [PubMed] [Google Scholar]
- 9.Altshuler D, Brooks LD, Chakravarti A, Collins FS, Daly MJ, Donnelly P. A haplotype map of the human genome. Nature. 2005;437:1299–320. doi: 10.1038/nature04226. [DOI] [PMC free article] [PubMed] [Google Scholar]
- 10.International HapMap Consortium. The International HapMap Project. Nature. 2003;426:789–96. doi: 10.1038/nature02168. [DOI] [PubMed] [Google Scholar]
- 11.Frazer KA, Ballinger DG, Cox DR, Hinds DA, Stuve LL, Gibbs RA, Belmont JW, Boudreau A, Hardenbol P, Leal SM, Pasternak S, Wheeler DA, Willis TD, Yu F, Yang H, Zeng C, Gao Y, Hu H, Hu W, Li C, Lin W, Liu S, Pan H, Tang X, Wang J, Wang W, Yu J, Zhang B, Zhang Q, Zhao H, Zhao H, Zhou J, Gabriel SB, Barry R, Blumenstiel B, Camargo A, Defelice M, Faggart M, Goyette M, Gupta S, Moore J, Nguyen H, Onofrio RC, Parkin M, Roy J, Stahl E, Winchester E, Ziaugra L, Altshuler D, Shen Y, Yao Z, Huang W, Chu X, He Y, Jin L, Liu Y, Shen Y, Sun W, Wang H, Wang Y, Wang Y, Xiong X, Xu L, Waye MM, Tsui SK, Xue H, Wong JT, Galver LM, Fan JB, Gunderson K, Murray SS, Oliphant AR, Chee MS, Montpetit A, Chagnon F, Ferretti V, Leboeuf M, Olivier JF, Phillips MS, Roumy S, Sallee C, Verner A, Hudson TJ, Kwok PY, Cai D, Koboldt DC, Miller RD, Pawlikowska L, Taillon-Miller P, Xiao M, Tsui LC, Mak W, Song YQ, Tam PK, Nakamura Y, Kawaguchi T, Kitamoto T, Morizono T, Nagashima A, Ohnishi Y, et al. A second generation human haplotype map of over 3.1 million SNPs. Nature. 2007;449:851–61. doi: 10.1038/nature06258. [DOI] [PMC free article] [PubMed] [Google Scholar]
- 12.Pritchard JK, Przeworski M. Linkage disequilibrium in humans: models and data. Am J Hum Genet. 2001;69:1–14. doi: 10.1086/321275. [DOI] [PMC free article] [PubMed] [Google Scholar]
- 13.Gonzalez-Neira A, Ke X, Lao O, Calafell F, Navarro A, Comas D, Cann H, Bumpstead S, Ghori J, Hunt S, Deloukas P, Dunham I, Cardon LR, Bertranpetit J. The portability of tagSNPs across populations: a worldwide survey. Genome Res. 2006;16:323–30. doi: 10.1101/gr.4138406. [DOI] [PMC free article] [PubMed] [Google Scholar]
- 14.Gu S, Pakstis AJ, Li H, Speed WC, Kidd JR, Kidd KK. Significant variation in haplotype block structure but conservation in tagSNP patterns among global populations. Eur J Hum Genet. 2007;15:302–12. doi: 10.1038/sj.ejhg.5201751. [DOI] [PubMed] [Google Scholar]
- 15.Thompson D, Stram D, Goldgar D, Witte JS. Haplotype tagging single nucleotide polymorphisms and association studies. Hum Hered. 2003;56:48–55. doi: 10.1159/000073732. [DOI] [PubMed] [Google Scholar]
- 16.Carlson CS, Eberle MA, Rieder MJ, Yi Q, Kruglyak L, Nickerson DA. Selecting a maximally informative set of single-nucleotide polymorphisms for association analyses using linkage disequilibrium. Am J Hum Genet. 2004;74:106–20. doi: 10.1086/381000. [DOI] [PMC free article] [PubMed] [Google Scholar]
- 17.Weale ME, Depondt C, Macdonald SJ, Smith A, Lai PS, Shorvon SD, Wood NW, Goldstein DB. Selection and evaluation of tagging SNPs in the neuronal-sodium-channel gene SCN1A: implications for linkage-disequilibrium gene mapping. Am J Hum Genet. 2003;73:551–65. doi: 10.1086/378098. [DOI] [PMC free article] [PubMed] [Google Scholar]
- 18.Bamshad MJ, Wooding S, Watkins WS, Ostler CT, Batzer MA, Jorde LB. Human population genetic structure and inference of group membership. Am J Hum Genet. 2003;72:578–89. doi: 10.1086/368061. [DOI] [PMC free article] [PubMed] [Google Scholar]
- 19.Watkins WS, Rogers AR, Ostler CT, Bamshad MJ, Brassington AE, Carroll ML, Nguyen SV, Walker JA, Batzer MA, Jorde LB. Genetic variation among world populations: inferences from 100 Alu insertion polymorphisms. Genome Res. 2003;13:1607–1618. doi: 10.1101/gr.894603. [DOI] [PMC free article] [PubMed] [Google Scholar]
- 20.Evans DM, Cardon LR. A Comparison of Linkage Disequilibrium Patterns and Estimated Population Recombination Rates across Multiple Populations. Am J Hum Genet. 2005;76:681–7. doi: 10.1086/429274. [DOI] [PMC free article] [PubMed] [Google Scholar]
- 21.Smith AV, Thomas DJ, Munro HM, Abecasis GR. Sequence features in regions of weak and strong linkage disequilibrium. Genome Res. 2005;15:1519–34. doi: 10.1101/gr.4421405. [DOI] [PMC free article] [PubMed] [Google Scholar]
- 22.Nordborg M, Tavare S. Linkage disequilibrium: what history has to tell us. Trends Genet. 2002;18:83–90. doi: 10.1016/s0168-9525(02)02557-x. [DOI] [PubMed] [Google Scholar]
- 23.Vishwanathan H, Deepa E, Cordaux R, Stoneking M, Usha Rani MV, Majumder PP. Genetic structure and affinities among tribal populations of southern India: a study of 24 autosomal DNA markers. Ann Human Genet. 2004;68:128–138. doi: 10.1046/j.1529-8817.2003.00083.x. [DOI] [PubMed] [Google Scholar]
- 24.de Bakker PI, Yelensky R, Pe’er I, Gabriel SB, Daly MJ, Altshuler D. Efficiency and power in genetic association studies. Nat Genet. 2005;37:1217–23. doi: 10.1038/ng1669. [DOI] [PubMed] [Google Scholar]
- 25.Ke X, Durrant C, Morris AP, Hunt S, Bentley DR, Deloukas P, Cardon LR. Efficiency and consistency of haplotype tagging of dense SNP maps in multiple samples. Hum Mol Genet. 2004;13:2557–65. doi: 10.1093/hmg/ddh294. [DOI] [PubMed] [Google Scholar]
- 26.Huang W, He Y, Wang H, Wang Y, Liu Y, Wang Y, Chu X, Wang Y, Xu L, Shen Y, Xiong X, Li H, Wen B, Qian J, Yuan W, Zhang C, Wang Y, Jiang H, Zhao G, Chen Z, Jin L. Linkage disequilibrium sharing and haplotype-tagged SNP portability between populations. Proc Natl Acad Sci U S A. 2006;103:1418–21. doi: 10.1073/pnas.0510360103. [DOI] [PMC free article] [PubMed] [Google Scholar]
- 27.de Bakker PI, Burtt NP, Graham RR, Guiducci C, Yelensky R, Drake JA, Bersaglieri T, Penney KL, Butler J, Young S, Onofrio RC, Lyon HN, Stram DO, Haiman CA, Freedman ML, Zhu X, Cooper R, Groop L, Kolonel LN, Henderson BE, Daly MJ, Hirschhorn JN, Altshuler D. Transferability of tag SNPs in genetic association studies in multiple populations. Nat Genet. 2006;38:1298–1303. doi: 10.1038/ng1899. [DOI] [PubMed] [Google Scholar]
- 28.Conrad DF, Jakobsson M, Coop G, Wen X, Wall JD, Rosenberg NA, Pritchard JK. A worldwide survey of haplotype variation and linkage disequilibrium in the human genome. Nat Genet. 2006;38:1251–60. doi: 10.1038/ng1911. [DOI] [PubMed] [Google Scholar]
- 29.de Bakker PI, Graham RR, Altshuler D, Henderson BE, Haiman CA. Transferability of tag SNPs to capture common genetic variation in DNA repair genes across multiple populations. Pac Symp Biocomput. 2006:478–86. [PubMed] [Google Scholar]
- 30.Nejentsev S, Godfrey L, Snook H, Rance H, Nutland S, Walker NM, Lam AC, Guja C, Ionescu-Tirgoviste C, Undlien DE, Ronningen KS, Tuomilehto-Wolf E, Tuomilehto J, Newport MJ, Clayton DG, Todd JA. Comparative high-resolution analysis of linkage disequilibrium and tag single nucleotide polymorphisms between populations in the vitamin D receptor gene. Hum Mol Genet. 2004;13:1633–9. doi: 10.1093/hmg/ddh169. [DOI] [PubMed] [Google Scholar]
- 31.Paschou P, Mahoney MW, Javed A, Kidd JR, Pakstis AJ, Gu S, Kidd KK, Drineas P. Intra- and interpopulation genotype reconstruction from tagging SNPs. Genome Res. 2007;17:96–107. doi: 10.1101/gr.5741407. [DOI] [PMC free article] [PubMed] [Google Scholar]
- 32.Mueller JC, Lohmussaar E, Magi R, Remm M, Bettecken T, Lichtner P, Biskup S, Illig T, Pfeufer A, Luedemann J, Schreiber S, Pramstaller P, Pichler I, Romeo G, Gaddi A, Testa A, Wichmann HE, Metspalu A, Meitinger T. Linkage disequilibrium patterns and tagSNP transferability among European populations. Am J Hum Genet. 2005;76:387–98. doi: 10.1086/427925. [DOI] [PMC free article] [PubMed] [Google Scholar]
- 33.Willer CJ, Scott LJ, Bonnycastle LL, Jackson AU, Chines P, Pruim R, Bark CW, Tsai YY, Pugh EW, Doheny KF, Kinnunen L, Mohlke KL, Valle TT, Bergman RN, Tuomilehto J, Collins FS, Boehnke M. Tag SNP selection for Finnish individuals based on the CEPH Utah HapMap database. Genet Epidemiol. 2006;30:180–90. doi: 10.1002/gepi.20131. [DOI] [PubMed] [Google Scholar]
- 34.Ribas G, Gonzalez-Neira A, Salas A, Milne RL, Vega A, Carracedo B, Gonzalez E, Barroso E, Fernandez LP, Yankilevich P, Robledo M, Carracedo A, Benitez J. Evaluating HapMap SNP data transferability in a large-scale genotyping project involving 175 cancer-associated genes. Hum Genet. 2006;118:669–79. doi: 10.1007/s00439-005-0094-9. [DOI] [PubMed] [Google Scholar]
- 35.Montpetit A, Nelis M, Laflamme P, Magi R, Ke X, Remm M, Cardon L, Hudson TJ, Metspalu A. An Evaluation of the Performance of Tag SNPs Derived from HapMap in a Caucasian Population. PLoS Genet. 2006;2:e27. doi: 10.1371/journal.pgen.0020027. [DOI] [PMC free article] [PubMed] [Google Scholar]
- 36.Smith EM, Wang X, Littrell J, Eckert J, Cole R, Kissebah AH, Olivier M. Comparison of linkage disequilibrium patterns between the HapMap CEPH samples and a family-based cohort of Northern European descent. Genomics. 2006;88:407–14. doi: 10.1016/j.ygeno.2006.04.004. [DOI] [PMC free article] [PubMed] [Google Scholar]
- 37.Stankovich J, Cox CJ, Tan RB, Montgomery DS, Huxtable SJ, Rubio JP, Ehm MG, Johnson L, Butzkueven H, Kilpatrick TJ, Speed TP, Roses AD, Bahlo M, Foote SJ. On the utility of data from the International HapMap Project for Australian association studies. Hum Genet. 2006;119:220–2. doi: 10.1007/s00439-005-0120-y. [DOI] [PubMed] [Google Scholar]
- 38.Lim J, Kim YJ, Yoon Y, Kim SO, Kang H, Park J, Han AR, Han B, Oh B, Kimm K, Yoon B, Song K. Comparative study of the linkage disequilibrium of an ENCODE region, chromosome 7p15, in Korean, Japanese, and Han Chinese samples. Genomics. 2006;87:392–8. doi: 10.1016/j.ygeno.2005.11.002. [DOI] [PubMed] [Google Scholar]
- 39.Gabriel SB, Schaffner SF, Nguyen H, Moore JM, Roy J, Blumenstiel B, Higgins J, DeFelice M, Lochner A, Faggart M, Liu-Cordero SN, Rotimi C, Adeyemo A, Cooper R, Ward R, Lander ES, Daly MJ, Altshuler D. The structure of haplotype blocks in the human genome. Science. 2002;296:2225–9. doi: 10.1126/science.1069424. [DOI] [PubMed] [Google Scholar]
- 40.Wall JD, Pritchard JK. Haplotype blocks and linkage disequilibrium in the human genome. Nat Rev Genet. 2003;4:587–97. doi: 10.1038/nrg1123. [DOI] [PubMed] [Google Scholar]
- 41.Tishkoff SA, Kidd KK. Implications of biogeography of human populations for ‘race’ and medicine. Nat Genet. 2004;36:S21–7. doi: 10.1038/ng1438. [DOI] [PubMed] [Google Scholar]
- 42.Bonnen PE, Pe’er I, Plenge RM, Salit J, Lowe JK, Shapero MH, Lifton RP, Breslow JL, Daly MJ, Reich DE, Jones KW, Stoffel M, Altshuler D, Friedman JM. Evaluating potential for whole-genome studies in Kosrae, an isolated population in Micronesia. Nat Genet. 2006;38:214–7. doi: 10.1038/ng1712. [DOI] [PubMed] [Google Scholar]
- 43.Rosenberg NA, Mahajan S, Ramachandran S, Zhao C, Pritchard JK, Feldman MW. Clines, clusters, and the effect of study design on the inference of human population structure. PLoS Genet. 2005;1:e70. doi: 10.1371/journal.pgen.0010070. [DOI] [PMC free article] [PubMed] [Google Scholar]
- 44.Bourgain C, Genin E. Complex trait mapping in isolated populations: Are specific statistical methods required? Eur J Hum Genet. 2005;13:698–706. doi: 10.1038/sj.ejhg.5201400. [DOI] [PubMed] [Google Scholar]
- 45.Rosenberg NA, Pritchard JK, Weber JL, Cann HM, Kidd KK, Zhivotovsky LA, Feldman MW. Genetic Structure of Human Populations. Science. 2002;298:2381–2385. doi: 10.1126/science.1078311. [DOI] [PubMed] [Google Scholar]
- 46.Johansson A, Vavruch-Nilsson V, Cox DR, Frazer KA, Gyllensten U. Evaluation of the SNP tagging approach in an independent population sample-array-based SNP discovery in Sami. Hum Genet. 2007 doi: 10.1007/s00439-007-0379-2. [DOI] [PubMed] [Google Scholar]
- 47.Roy NS, Farheen S, Roy N, Sengupta S, Majumder PP. Portability of Tag SNPs Across Isolated Population Groups: An Example from India. Ann Hum Genet. 2007 doi: 10.1111/j.1469-1809.2006.00383.x. [DOI] [PubMed] [Google Scholar]
- 48.Xu Z, Kaplan NL, Taylor JA. Tag SNP selection for candidate gene association studies using HapMap and gene resequencing data. Eur J Hum Genet. 2007 doi: 10.1038/sj.ejhg.5201875. [DOI] [PubMed] [Google Scholar]
- 49.Kidd JM, Newman TL, Tuzun E, Kaul R, Eichler EE. Population stratification of a common APOBEC gene deletion polymorphism. PLoS Genet. 2007;3:e63. doi: 10.1371/journal.pgen.0030063. [DOI] [PMC free article] [PubMed] [Google Scholar]
- 50.Witherspoon DJ, Marchani EE, Watkins WS, Ostler CT, Wooding SP, Anders BA, Fowlkes JD, Boissinot S, Furano AV, Ray DA, Rogers AR, Batzer MA, Jorde LB. Human population genetic structure and diversity inferred from polymorphic L1(LINE-1) and Alu insertions. Hum Hered. 2006;62:30–46. doi: 10.1159/000095851. [DOI] [PubMed] [Google Scholar]
- 51.Weir BS, Cockerham CC. Estimating F-statistics for the analysis of population structur. Evolution. 1984;38:1358–1370. doi: 10.1111/j.1558-5646.1984.tb05657.x. [DOI] [PubMed] [Google Scholar]
- 52.Barrett JC, Fry B, Maller J, Daly MJ. Haploview: analysis and visualization of LD and haplotype maps. Bioinformatics. 2005;21:263–5. doi: 10.1093/bioinformatics/bth457. [DOI] [PubMed] [Google Scholar]
- 53.Ramirez-Soriano A, Lao O, Soldevila M, Calafell F, Bertranpetit J, Comas D. Haplotype tagging efficiency in worldwide populations in CTLA4 gene. Genes Immun. 2005;6:646–57. doi: 10.1038/sj.gene.6364251. [DOI] [PubMed] [Google Scholar]
- 54.Tenesa A, Dunlop MG. Validity of tagging SNPs across populations for association studies. Eur J Hum Genet. 2006;14:357–63. doi: 10.1038/sj.ejhg.5201554. [DOI] [PubMed] [Google Scholar]
- 55.Mahasirimongkol S, Chantratita W, Promso S, Pasomsab E, Jinawath N, Jongjaroenprasert W, Lulitanond V, Krittayapoositpot P, Tongsima S, Sawanpanyalert P, Kamatani N, Nakamura Y, Sura T. Similarity of the allele frequency and linkage disequilibrium pattern of single nucleotide polymorphisms in drug-related gene loci between Thai and northern East Asian populations: implications for tagging SNP selection in Thais. J Hum Genet. 2006;51:896–904. doi: 10.1007/s10038-006-0041-1. [DOI] [PubMed] [Google Scholar]
- 56.Yoo YK, Ke X, Hong S, Jang HY, Park K, Kim S, Ahn T, Lee YD, Song O, Rho NY, Lee MS, Lee YS, Kim J, Kim YJ, Yang JM, Song K, Kimm K, Weir B, Cardon LR, Lee JE, Hwang JJ. Fine-scale map of encyclopedia of DNA elements regions in the Korean population. Genetics. 2006;174:491–7. doi: 10.1534/genetics.105.052225. [DOI] [PMC free article] [PubMed] [Google Scholar]
- 57.Marvelle AF, Lange LA, Qin L, Wang Y, Lange EM, Adair LS, Mohlke KL. Comparison of ENCODE region SNPs between Cebu Filipino and Asian HapMap samples. J Hum Genet. 2007;52:729–37. doi: 10.1007/s10038-007-0175-9. [DOI] [PubMed] [Google Scholar]
- 58.Angius A, Hyland FC, Persico I, Pirastu N, Woodage T, Pirastu M, De la Vega FM. Patterns of linkage disequilibrium between SNPs in a Sardinian population isolate and the selection of markers for association studies. Hum Hered. 2008;65:9–22. doi: 10.1159/000106058. [DOI] [PubMed] [Google Scholar]
Associated Data
This section collects any data citations, data availability statements, or supplementary materials included in this article.
Supplementary Materials
01
02