The interplay of structure and dynamics: Insights from a survey of HIV-1 Reverse Transcriptase Crystal Structures (original) (raw)
. Author manuscript; available in PMC: 2014 Oct 1.
Published in final edited form as: Proteins. 2013 Aug 16;81(10):1792–1801. doi: 10.1002/prot.24325
Abstract
HIV-1 reverse transcriptase is a critical drug target for HIV treatment, and understanding the exact mechanisms of its function and inhibition would significantly accelerate the development of new anti-HIV drugs. It is well known that structure plays a critical role in protein function, but for reverse transcriptase, structural information has proven to be insufficient – despite enormous effort – to explain the mechanism of inhibition and drug resistance of non-nucleoside reverse transcriptase inhibitors. We hypothesize that the missing link is dynamics, information about the motions of the system. However, many of the techniques that give the best information about dynamics, such as solution NMR and molecular dynamics simulations, cannot be easily applied to a protein as large as reverse transcriptase. As an alternative, we combine elastic network modeling with simultaneous hierarchical clustering of structural and dynamic data. We present an extensive survey of the dynamics of reverse transcriptase bound to a variety of ligands and with a number of mutations, revealing a novel mechanism for drug resistance to non-nucleoside reverse transcriptase inhibitors. Hydrophobic core mutations restore active-state motion to multiple functionally significant regions of HIV-1 RT. This model arises out of a combination of structural and dynamic information, rather than exclusively from one or the other.
Keywords: Elastic network model, allostery, reverse transcriptase inhibition, protein–drug interactions, structure-function
Introduction
HIV-1 reverse transcriptase (RT) has long been a major target for anti-HIV therapies. Understanding its function and inhibition is important for designing new inhibitors. Moreover, there is a huge amount of structural information available: there are over 100 crystal structures, including native and mutant proteins with various ligands bound. RT is a multifunctional enzyme that turns single-strand viral RNA into double stranded DNA, giving it a crucial role in viral infectivity. The structure of RT is a heterodimer with a larger 66 kDa subunit (p66), consisting of a polymerase domain, which in turn contains several subdomains: the fingers, palm, thumb, and connection subdomains, as well as an RNase H domain (Figure 1). The smaller 51 kDa subunit (p51) has the same N-terminal sequence as p66 but lacks the RNase H domain 1. The p66 subunit is thought to contain all of the functionally important features of RT, while p51 is thought to provide stability and aid in allosteric communication across the protein 1; 2; 3; 4.
Figure 1.

The structure of HIV-1 RT containing the larger subunit (p66) has a polymerase domain consisting of a fingers (blue), palm (red), thumb (green), and connection (orange) subdomain and an RNase H (purple) domain. The smaller subunit (p51) has the same N-terminal sequence as p66 (gray), but lacks the RNase H domain. (b) The NNRTI binding pocket with the NNRTI (cyan, spheres) and drug resistant mutants shown in spheres colored by if they are hydrophobic core mutations (purple) or entry blocker mutations (orange). (c) The change in the position of the thumb subdomain depending on which ligand RT is bound to: unliganded (red; 1DLO), DNA-bound (blue; 1N5Y), or NNRTI bound (yellow; 1VRT) 54.
There are three classes of inhibitors to RT: Nucleoside/Nucleotide Reverse Transcriptase Inhibitors (NRTI/NtRTI), Non-Nucleoside Reverse Transcriptase Inhibitors (NNRTI), and RNase H inhibitors (RI). NRTIs are converted to nucleotide analogs in the body, but lack a 3′-OH, which allows them to act as chain terminators 5. NtRTIs behave in the same fashion as NRTIs but don’t require the conversion step in the body. NNRTIs are small molecules that bind to a pocket inside the palm subdomain of p66 and allosterically inhibit all polymerase activity and polymerase-dependent RNase H activity; surprisingly, they accelerate polymerase-dependent RNase H activity 6; 7; 8. They function by preventing the DNA-bound protein from forming an active complex with dNTP in order to continue chain elongation 9. NNRTIs are divided into three generations, with each generation better able to form stable hydrogen bonds and hydrophobic interactions with the drug binding pocket 10. RIs are the newest class of RT inhibitors, small molecules that bind 50 Å away from the RNase H active site, near the polymerase active site 11. There are currently 16 RT inhibitors approved for clinical use, including 9 NRTIs, 2 NtRTIs, and 6 NNRTIs. At this time, there are no clinically approved RIs 12; 13.
There are thought to be three types of NNRTI resistance mutations: entrance, deformation, and hydrophobic core mutations. Entrance mutations (K103N, K101E) are thought to block drug entry into the binding pocket 14; 15. Deformation mutations (L100I, G190S) change the shape of the drug binding pocket, making binding unfavorable 16; 17. Hydrophobic core mutations (V108I, Y181C, Y188C) interrupt ring stacking interactions with the drug, conveying resistance, presumably by reducing the binding affinity by eliminating hydrophobic interactions between the NNRTI and the hydrophobic core of the binding pocket. The primary difference between structures with an NNRTI bound to wild type and hydrophobic core mutants is a subtle rotation of β-9 and β-11 with respect to the other β-sheet that makes up the drug binding pocket (β-12-13–14) 16; 18; 19; 20. The exact mechanism of these allosteric NNRTI-resistance mutations is particularly mysterious.
Exploring the mechanism of RT inhibition and drug resistance has spawned a wealth of crystallographic information. Recently, there have been many attempts to employ clustering or other methods to survey this crystallographic data, focusing either on the shape of the NNRTI, the binding pocket residues, or B-factors 21; 22; 23. All of these methods elucidate the structural differences between RT bound to various ligands, but to date there is no method that can correctly predict the functional state of the protein (e.g. inhibited, active, etc.) based solely on the crystal structure. Surveying a large number of crystal structures and determining meaningful information from them, particularly in a quantitative way, remains a major challenge. This arises from the fact that each crystal structure contains an enormous amount of information, but paradoxically, structural data alone is not always sufficient to determine a protein’s function. Thus, figuring out precisely which differences between closely related structures are important (and why) remains an unsolved problem. Given the challenges inherent in exploring these issues experimentally, computational approaches are extremely attractive. The obvious first choice would be to use all-atom molecular dynamics, since this is the gold standard for biomolecular simulation. Unfortunately, these kinds of calculations are very expensive to perform, and for a system as large as RT would likely require multiple microseconds of sampling to achieve even a semblance of statistical convergence 24; 25. In the present context, where we wish to tease out subtle differences between a large number of similar structures, these statistical errors would almost certainly swamp out the desired signal. As a result, we instead turn to more approximate (and thus less expensive) modeling techniques.
Elastic network modeling, particularly using the anisotropic network model (ANM), is a powerful tool for quickly probing the local protein energy landscape and extracting the coherent motions available to the system 26; 27. This model works particularly well on systems that are too large to be characterized by all-atom molecular dynamics, allowing the investigation of the mechanistic properties of the protein, the location of active sites, and allosteric causes of drug resistance. ANMs have been applied to proteins such as HIV-1 Protease, as well as complex and large systems such as the entire microtubule complex 28; 29; 30; 31. Furthermore, we previously showed that the motions predicted by ANMs compare well with long molecular dynamics trajectories, despite the simplifying assumptions built into the methodology 25; 32. By surveying both the structure and the dynamics of a set of proteins, we are able to elucidate functionally important structural changes.
Here, we report that NNRTI binding shifts both the structure and dynamics of RT, and that hydrophobic core mutations restore the motions of the active sites and dNTP binding site to those of the uninhibited structure. Apparently similar protein structures can have very different dynamic fingerprints, so clustering by both structure and dynamics is uniquely valuable for understanding protein function.
Methods
X-ray Structure Selection and Analysis
Crystallographic data were obtained from the Protein Data Bank 33. All unliganded, DNA, RNA, and ATP bound X-ray structures were initially selected, along with all X-ray structures of HIV-1 RT bound to the first generation NNRTI Nevirapine, the second generation NNRTI Efavirenz, and the third generation NNRTIs Etravirine, Rilpivirine, and Lersivirine. We aligned the sequences and structures of these molecules, and identified regions that were absent in some structures. We the excluded those X-ray structures with significant regions of unresolved structure since our analysis require that the various structural models contain an identical number of atoms. We then removed extraneous regions from the remaining structures leaving a consensus sequence to analyze. Table S1 shows the sequences of all structures used in this study, where ‘-’ represents missing sequence. However, regions of removed sequence were taken into account by using vibrational subset analysis (VSA) 34 (see the following section for additional details).
Of the original 54 X-ray structures considered, 2 (3HVT and 1LWC) were excluded due to excessive missing sequence coverage. The remaining 52 structures were aligned and residues were removed until all 52 structures had the same set of missing sequence (Table S1). The side chains of the remaining residues were removed, and all calculations were performed using the Cα atoms. Anisotropic Network Modeling was then performed on all 52 structures using vibrational subset analysis (VSA) to model in all removed sequences, and the resulting eigenvalues and eigenvectors were saved. This resulted in a final data set containing 2 strains of HIV-RT, spanning multiple crystallographic space groups (Table S2) 26; 34.
Anisotropic Network Modeling
An ANM represents the protein as a network of beads connected by springs, typically each bead representing the position of a Cα. The potential energy between the _i_th and _j_th Cα in the network is given by Hooke’s Law:
where dijo=(xio-xjo)2+(yio-yjo)2+(zio-zjo)2 is the distance between atoms i and j in the reference structure, and Γ_ij_ is the spring constant 25; 26. The reference structure is by definition the minimum energy structure, since V ≥ 0, and is only 0 at d = do. The spring constant is defined as Γ_ij_ = 1 within a cutoff distance of 15 Å and 0 beyond it. Using this connection rule, a Hessian matrix of the potential is constructed. This yields a 3N × 3N matrix, where N is the number of nodes in the network. When diagonalized, this matrix returns eigenvalues (λi) and eigenvectors (ν⃗i) corresponding to the vibrational modes of the protein. The eigenvectors are the directions of motion, with each associated eigenvalue corresponding to the frequency of that motion. Since the protein is modeled as a harmonic system, this frequency is inversely proportional to the amplitude of motion, meaning that the largest-scale motions will be those with the lowest frequencies. The 6 lowest frequency modes, corresponding to rigid body translation and rotation, are ignored for all subsequent analysis.
Not all structures have the same atoms resolved, but the results of the eigendecompositions can only be readily compared when the matrix dimensions are identical. To avoid excluding available information, we applied a recently developed variation of ANMs, vibrational subsystem analysis (VSA) to account for the extra residues. VSA partitions the Hessian matrix into an environment and a subsystem 34. Here the subsystem is our consensus residues, which are diagonalized as in ANM. The environment is comprised of the extra residues, which get diagonalized separately. The fluctuations of the environment are integrated out, leaving only the environment’s effect on the subsystem. This allows us to analyze the vibrational modes of a subset of amino acids in p66, and model in the parts of the sequence that are not common to all structures.
Covariance complement
We compared the ANM profiles of various p66 conformations to each other using a modified version of the covariance overlap, called the covariance complement 25; 35.
| CA,B=∑iNmodes(1λiA+1λiB)-2∑iNmodes∑jNmodes1λiAλjB-(v→iA•v→jB)2∑iNmodes(1λiA+1λiB) | (2) |
|---|
where λiA and ν→iA are the _i_th eigenvalue and eigenvector of structure A, and λiB and ν→iB are the _j_th eigenvalue and eigenvector of structure B. The covariance complement is 0 when the two ANM eigeinsets are the same, and 1 when they are completely orthogonal. In contrast to other methods for comparing results of ANMs, such as the subset overlap, the covariance overlap and covariance complement directly take the eigenvalue spectrum – the relative importance of specific mode – into account.
Clustering
Agglomerative hierarchical clustering using average linkage was employed to classify X-ray structures by the ratio of their RMSD to covariance complement 36. This takes advantage of the fact that structures with like functions to the reference structure show a linear relationship between RMSD and covariance complement with the line having a y-intercept of 0 (Figure 2). Three clusters were formed corresponding to an Active, Pre-active, and Inactive state.
Figure 2.

The covariance complement and RMSD of all 52 structures compared to (a) wild type RT bound to DNA (1N6Q), and (b) unliganded RT (1DLO). Points are shaped and colored by the ligand and mutations: NNRTI (black pluses), RT bound to DNA (light blue triangles), RNA (dark blue triangle), unliganded (red stars), entry blocker mutants bound to susceptible NNRTI (orange Xs), and hydrophobic core mutants bound to susceptible NNRTI (purple Xs). The best fit line to either all DNA-bound RT (a) or unliganded RT (b) is shown in gray. Structures that show a linear relationship between RMSD and covariance complement tend to show similar functional abilities, while proteins which form off diagonal clusters tend to have different functional abilities. This is true even for very different structures (DNA-bound and unliganded) 54; 55.
Covariance Matrices
To probe differences in motion within and between clusters of proteins, we computed the inter-residue covariance matrix for the first 50 modes of all proteins 37:
| CMij=∑l=150UilUjlλl(∑m=150UimUimλm)12(∑n=150UjnUjnλn)12, | (4) |
|---|
where CMi, j is the covariance between the ith and jth residue, Ul i, and λl are the eigenvectors and eigenvalue of the lth mode. This matrix tracks the degree to which the motions of various portions of the protein are related; a value of 1 indicates that the two residues move as a rigid body, 0 means they’re independent, and −1 indicates anti-correlated movement. Since we surveyed 52 proteins in total, we need to further condense the data for interpretation.
Accordingly, we calculated the matrix of standard deviations of all CMs in a cluster (or between clusters); this reveals regions of the protein where motion differs either within that cluster, or between cluster, and gives a value of 0 where the inter-residue motion is unchanged. We then applied a Fisher transformation to the covariance matrix:
to account for the fact that covariances are not normally distributed 38. Because the Fisher transform is unbounded, we assigned covariance matrix values greater ±0.99 a z-score of ±2.5. We then performed a Welches t-test on every element of the resulting matrix of z-scores, and compared the resulting patterns for variations within and between clusters. 39.
Computational Analysis
Anisotropic network modeling and covariance complement calculations were performed using the LOOS software package 40. All clustering was performed using Cluster 3.0 36. Computations were performed on the University of Rochester research linux cluster.
Results
Structural Comparisons
The Covariance Complement [Eq. (2)] quantifies the similarity between the motions predicted for two structures, while RMSD quantifies their structural similarity. The Covariance Complement and RMSD were calculated between each X-ray structure in the set. Given that in an ENM, the dynamics are uniquely determined by the structure, it is not surprising that the two quantities show significant correlation. In Figure 2, we plotted CC vs. RMSD for unliganded [1DLO, Figure 2 (a)] and DNA bound [1N6Q, Figure 2(b)] reverse transcriptase (RT). Structures capable of the same function tend to show a linear relationship between Covariance Complement and RMSD, while structures that are not capable of the same function are found off the line. Surprisingly, this rule holds even when the structures differ significantly. For example, the RMSD between 1DLO and 1RTJ (both unliganded RT structures) is 5.00 Å, but when all of the unliganded structures are plotted, they can be fit linearly with R2 = .9934 [Figure 2 (a), black line]. All wild type RT structures bound to non-nucleoside reverse transcriptase inhibitors (NNRTIs) deviate significantly from a linear relationship; this holds true regardless whether an unliganded structure or a DNA-bound RT structure is used as reference. All structures with a function similar to the reference structure fall on a line with a y-intercept of 0.
Clustering
Because linear variation of RMSD with Covariance Complement is a signature of functional commomality, we focus on the ratio of the two quantities. Specifically, we computed the ratio of RMSD to Covariance Complement for all pairs of structures, and performed agglomerative hierarchical clustering on the resulting matrix. The procedure produced three main clusters of structures, which we label “active”, “inactive”, and “pre-active”. The clustering is shown in Figure 3 and Table I lists all 52 RT structures and which cluster they fall into. The active cluster contains all RT structures bound to DNA except for 3V81, which is bound to both DNA and an NNRTI. The inactive cluster contains all structures where there is an NNRTI bound to an RT it can inhibit. In addition, this cluster contains all of the structures of proteins with entry blocker drug resistance mutations bound to either 1st or 2nd generation NNRTIs. The pre-active cluster contains all unliganded RT structures and hydrophobic core mutants bound to either 1st or 2nd generation NNRTIs, as well as RNA-bound RT, and 1st generation NNRTI-bound RT with the K103N mutation, a particularly potent entry blocker mutation 12; 41.
Figure 3.
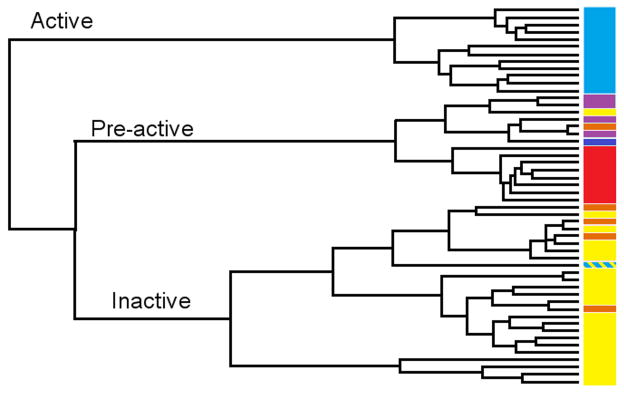
Agglomerative hierarchical clustering was employed on the ratio of covariance complement to RMSD, forming an active, pre-active, and inactive cluster. The resulting clusters are colored by their ligand: NNRTI-bound drug inhibited mutants (black), 1st/2nd Generation NNRTI-bound hydrophobic core mutants (purple), 1st/2nd Generation NNRTI-bound entry blocker mutants (orange), DNA (light blue), RNA (dark blue), and unliganded (red). The sole structure bound to both DNA and NNRTIs is striped black and light blue.
Table I.
Ratio Clustering
| Cluster | # | Ligand | PDB ID |
|---|---|---|---|
| Active | 12 | DNA or DNA+NRTI | 1R0A, 1N6Q, 1T03, 1N5Y, 3KLH, 1T05, 3JSM, 2HMI, 1J5O, 3KLG, 3KLE, 3KLF |
| Pre-active | 15 | Unliganded, ATP, RNA, NVP, or EFZ | 1S1X, 1JKH, 1LWF, 1JLF, 1FKP, 1JLB, 1RTJ, 1HVU, 1QE1, 2IAJ, 1HMV, 3KLI, 1DLO, 1HQE, 3DLK |
| Inactive | 25 | EVZ, NPV, NPV+DNA, NPV+RI, ERT, LVR, or RIP | 1FKO, 1LWE, 1S1U, 1LW0, 2HND, 2HNY, 1FK9, 1VRT, 3V81, 2WON, 2WOM, 3LP0, 3LP1, 1IKW, 1IKV, 3M8P, 3MED, 3MEC, 3MEE, 3MEG, 3QIP, 1SV5, 2ZE2, 2ZD1, 3BGR |
Inter-Cluster Structural Differences
We first compared the structural variations between the structures in the 3 clusters, to see if there is a simple explanation for their classification. The structures in the active cluster are very similar, with an RMSD of 1.68 Å between the two least similar structures. The inactive cluster is also fairly self-similar, with a maximum RMSD of 3.20 Å. By contrast, the pre-active cluster is far more diverse with a maximum RMSD of 5.63 Å. The variations within each cluster are not evenly distributed throughout the structure; rather, the change primarily comes in the positioning of the thumb subdomain. The pre-active cluster in particular shows the thumb subdomain in two major conformations [Figure 1 (c)], an unliganded position and a NNRTI-bound position; if one breaks the pre-active cluster into subclusters based on thumb position the maximum RMSD drops to 1.55 Å for the NNRTI-bound thumb position and 2.08 Å for the Unliganded thumb position.
A common feature of all pre-active structures is a rotation of the β-sheet consisting of strand 12, 13, and 14 (β-12-13-14) relative to the inactive cluster’s structures [Figure 4 (c)]. This rotation is subtle in the drug resistance mutants, but this sheet is the platform upon which the thumb subdomain rests, and the subtle rotation leads to a marked change in the positioning of the thumb subdomain, shifting it away from the connection subdomain in the NNRTI-bound drug resistant mutants [Figure 4 (b)]. This rigid-body motion of the thumb subdomain significantly changes inter-domain contacts, resulting in heterogeneity in the predicted dynamics. Figure 4 (a) shows all residues that form 5 or more additional contacts in structures in the inactive cluster versus the pre-active structures. Unsurprisingly, most of these residues fall along the interface between the thumb and connection subdomains of p66. Moreover, all of these residues are part of an experimentally determined network of allosteric tightening 4. This shows how a subtle change in the positioning of a single subdomain can have radical effects on the predicted dynamics.
Figure 4.

The structure of RT colored by the difference in contacts in the connectivity matrix (Γ_ij_) between the pre-active to the inactive cluster. (b) shows the shift in the thumbs position between two structures in the NNRTI-bound pre-active cluster (red) and two structures from the NNRTI inactive cluster (yellow). The thumb subdomain rotates away from the connection subdomain. (c) shows a the subtle rotation in β-12-13-14 which forms half of the drug binding pocket 20; 56; 57; 58.
Inter-residue Correlations
Having established the main structural change accounting for the difference in dynamics and function between the clusters, we next sought to identify specific residues whose dynamics change between functional states. To do so, we looked at the motions predicted for each residue, in the form of the inter-residue covariance map (see Methods); in short, these maps describe the degree to which two residues’ motions are related to each other. These maps were computed for each structure, and were used to compare the variation within a cluster to the variation between clusters. As discussed in the Methods, we identified the specific residues (or sets of residues) whose behavior differs significantly between clusters. This method allows us to identify regions where the overall nature of the motion changes, for instance from correlated motion (blue on the graph, indicating rigid body motion) to uncorrelated (white) or anti-correlated (red, where the regions move in opposing directions).
In the pre-active cluster, the fingers and palm subdomain movements are correlated with those of the thumb subdomain and RNase H domain. By contrast, in the inactive cluster the fingers and palm subdomain moves as a rigid unit, and the thumb subdomain motions are correlated with the connection subdomain and the RNase H domain (Figure 5).
Figure 5.
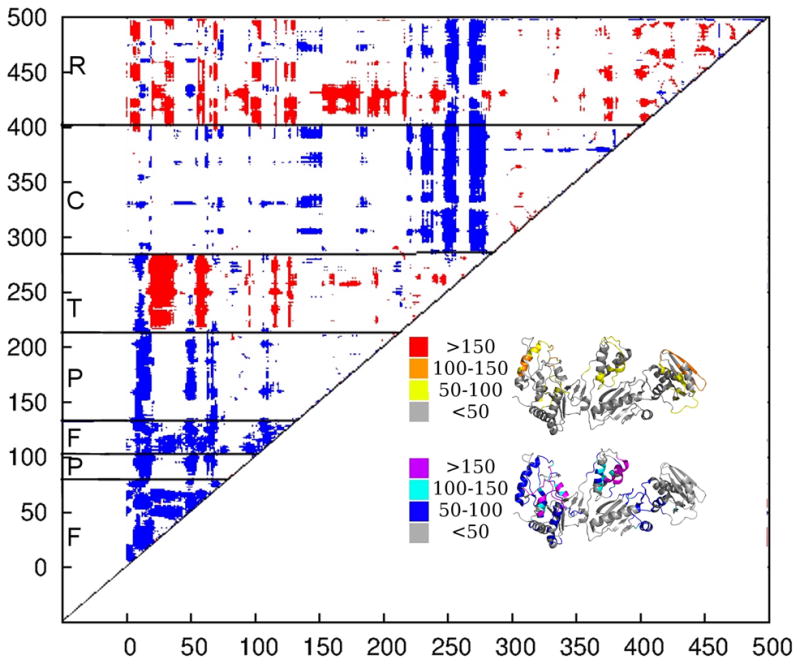
We calculated a matrix of significant differences between the inter-residue correlations of the inactive and pre-active cluster according to the Welch’s T-test. Residue pairs showing a significant difference between the pre-active and inactive cluster are colored. This difference can be more correlated (red) or more anti-correlated (blue) fashion. The residues showing a strong difference in their inter-residue correlation tend to be regions of the protein which begin moving differently with regards to the rest of the structure. The number of residues changing their motion with respect to a single residue mapped onto the structure of p66. The structure is colored by whether residues become more correlated moving from the inactive to the pre-active cluster (yellow, orange, red), or more anti-correlated (blue, cyan, purple) 39.
The covariance maps for the pre-active and active clusters are largely similar. In the active cluster, the thumb subdomain is weakly correlated with the connection subdomain and RNase H domain, but otherwise shows a similar inter-residue correlation. Inhibition radically changes the predicted dynamics compared to both the active and pre-active clusters: compared to active cluster, the inactive polymerase domain moves in a rigidly correlated manner (Figure S1).
The hydrophobic core mutants in the pre-active cluster and the structures in the inactive clusters are structurally similar, with average pairwise RMSDs of 1.49 Å. To probe the differences in dynamics between the hydrophobic core mutants in the pre-active and inactive clusters, the unliganded structures were removed from the pre-active cluster and the clusters were compared again. It is clear that the NNRTI binding site moves differently in the new sub-clusters, accompanied by significant differences in the internal motion of the thumb and connection subdomain and the RNase H domain, restoring the hydrophobic core mutant structures to active-like internal motions. Additionally, in the hydrophobic core mutant structures, the thumb subdomain moves in a more correlated fashion with respect to the RNase H domain, again like the active cluster (Figure S2).
Discussion
In order to understand the function of RT, including how inhibition and drug resistance works, it is first necessary to understand both the native structure and the native dynamics. It has long been accepted that flexibility plays a crucial role in the proper function of RNA polymerases 42; 43, and there have been many attempts to explain the inhibition of HIV-1 RT by NNRTIs through changes in its molecular motions 3; 44; 45; 46. Our results suggest that simple flexibility is not the sole determinant for protein function; rather, it is the subtle interplay of structure and specific motions that control function. This is shown by the marked structural similarity of dynamics in the fingers and palm subdomains of the hydrophobic core mutants and the unliganded structures.
It is also seen in the similarities between the dynamics of the thumb and RNase H domain of the hydrophobic core mutants and the active cluster. This change in predicted dynamics is caused by a structural change in the drug binding site. The loss of the hydrophobic interaction between the NNRTI and Y188 causes T229 to reorient, triggering a subtle rotation in β-12-13-1420. This β-sheet is the platform upon which the thumb rests, so even a small rotation leads to a much larger displacement of the thumb away from the connection subdomain (Figure 4). This motion breaks several contacts in the model, which reflects the breaking of several van der Waals contacts in the structure. The ability of such a simple model of motion to correctly predict the functional state from the structure suggests that the change in the predicted dynamics plays a vital role in the ability of the hydrophobic core mutants to offer resistances against 1st and 2nd generation NNRTIs. The hydrophobic core mutants were crystallized under inhibiting concentrations of NNRTI, suggesting that the shift in dynamics alone in not enough to convey full drug resistance 16; 20; 47; 48. The answer can be found in the dynamics of the p51 subunit. These results break cleanly into three groups with the unliganded, active-cluster structures, and the NNRTI bound structures and the 1RTJ unliganded structure forming their own clusters (Figure S3). The p51 subunit is required for RT activity, and is necessary to propagate NNRTI-induced structural rigidification49. This suggests that p51 has a dynamic role (in addition to its structural role) in activity and NNRTI binding disrupts this process. The structural change from the inactive to the active p51 subunit is very small (~1.2 Å), suggesting that when an NNRTI comes off, the conformational change to the active p51 conformation can occur rapidly. This could also explain why a single non-NNRTI resistant mutant clustered with the pre-active cluster. This structure contains a trio of nucleoside reverse transcriptase inhibitor mutants that have been shown to increase the resistance of certain combinations of NNRTI-resistant mutations50. This further suggests that a reduction in drug binding efficiency is required alongside the change in dynamics.
Our work reveals two groups of drug-resistant mutations by their effect on the dynamics of HIV-1 RT. These groups of mutations compare well with current theory of drug resistance 12. The first group (V108I, Y181C, Y188C) all feature mutations located deep within the hydrophobic core of the NNRTI-binding pocket, and are thought to cause drug resistance via a loss of an interaction with aromatic rings 1; 19; 20; 51; 52. Our model predicts these mutations perturb the internal motions of the thumb subdomain and the RNase H domain of HIV-1 RT, restoring active state movement, without significantly affecting the structure. Also in this group is one of the most potent of the drug resistance mutations, K103N bound to the 1st generation NNRTI Nevriapine. However, all efavirenz-bound structures fall within the inactive cluster along with a wild-type structure bound to efavirenz. The fact that K103N falls within multiple clusters means that it cannot be conclusively stated whether it has an allosteric mechanism for resistance.
On the other hand, K101E and L100I have essentially no effect on the structure of inhibited HIV-1 RT compared to wild type. These mutations, along with K103N, are thought to make NNRTI binding unfavorable by either changing the shape of the binding pocket or blocking the inhibitor’s entrance into the binding pocket 14; 15; 16. The present work appears to validate this idea, showing that the protein assumes an inhibited structure and dynamics upon binding of inhibitor.
Recently, a mechanism for NNRTI inhibition was proposed based on crystallographic data of HIV-1 RT bound to both the 1st general inhibitor Nevriapine and DNA 9. This model states that binding Nevriapine displaces the primer grip of HIV-1 RT and, when combined with the hyper-extended thumb conformation, moves the DNA away from the polymerase active site. At the same time, inhibitor binding distorts the dNTP binding site and shifts the relative position of the RNAse H and polymerase active sites. As a result, the post-translation complex of the DNA-bound protein is bound to a catalytically inactive state 9. This DNA-NNRTI complex shows dynamics nearly indistinguishable from that of other inhibited structures, strongly suggesting a dynamic component to the mispositioning of the DNA in the polymerase active sight.
The structural changes caused by the Y188C, Y181C, and V108I mutations correspond to a previously discovered allosteric network4. This network appears via both dynamic and structural analysis, suggesting that the allosteric coupling of this network is encoded in the 3-dimensional structure of the protein, and furthermore that perturbing other regions of this network causes global changes in the structure of the protein. This can be seen in the case of the RNase H inhibitors, which bind in the network but are distant from the NNRTI binding site, and shift the structure of nevirapine-bound K103N protein from the pre-active cluster to the inactive cluster (Figure 3, Table I).
There have been many previous investigations using various types of molecular modeling to study HIV-1 RT. Previous studies using elastic network modeling showed that NNRTI binding changed RT’s global motions 3; 45; 53. This work suggested that the change in the relative motion of the fingers and thumb subdomain in the first mode caused inhibition. It also suggests that changes in the overall topology of a protein have marked affects on its activity and ability to bind ligands. Here, we consider both structure and dynamics must be considered: a survey of many different structures of both wild type and drug resistant mutants suggests that it is both the change in thumb domain motion and the relative thumb position that causes inhibition, rather than the change in motion alone. On the other hand, in elastic network model calculations there is no input other than the structure – geometry is destiny – so cannot consider dynamics without structure.
Conclusion
The present work surveys the wealth of structural information available for RT, combining direct structural analysis with modeling of the complex’s dynamics, using a simple harmonic model. This reveals a wealth of previously hidden details about allosteric interactions due to ligand and mutations. We propose a new model of NNRTI drug resistance whereby mutations to the hydrophobic core of the drug binding pocket cause dynamic changes across the protein, restoring proper thumb and RNase H domain motions, and alter the motion of the polymerase domain to a more unliganded-like motion. This reveals ANM as a powerful bioinformatics tool for quickly probing the dynamics of known protein structures, allowing us to find novel allosteric interactions to compliment and inform experiments.
Supplementary Material
Supp Data S1
Acknowledgments
We are grateful to the Center for Integrated Research Computing at the University of Rochester for providing the necessary computing systems and personnel to enable the research presented in this manuscript. We would also like to thank Dr. Tod Romo for help using LOOS and performing the ENM calculations, and Dr. Ivet Bahar and Dr. Carrie Dykes for advice in the preparation of the manuscript. This research was supported by the NIAID/NIH grants T32AI083206, HHSN272201000055C, P30 AI078498, GM068411, and GM095496 (AG).
References
- 1.Kohlstaedt LA, Wang J, Friedman JM, Rice PA, Steitz TA. Crystal structure at 3.5 A resolution of HIV-1 reverse transcriptase complexed with an inhibitor. Science. 1992;256:1783–90. doi: 10.1126/science.1377403. [DOI] [PubMed] [Google Scholar]
- 2.Boyer PL, Ferris AL, Clark P, Whitmer J, Frank P, Tantillo C, Arnold E, Hughes SH. Mutational analysis of the fingers and palm subdomains of human immunodeficiency virus type-1 (HIV-1) reverse transcriptase. J Mol Biol. 1994;243:472–83. doi: 10.1006/jmbi.1994.1673. [DOI] [PubMed] [Google Scholar]
- 3.Bahar I, Erman B, Jernigan RL, Atilgan AR, Covell DG. Collective motions in HIV-1 reverse transcriptase: examination of flexibility and enzyme function. J Mol Biol. 1999;285:1023–37. doi: 10.1006/jmbi.1998.2371. [DOI] [PubMed] [Google Scholar]
- 4.Seckler JM, Barkley MD, Wintrode PL. Allosteric suppression of HIV-1 reverse transcriptase structural dynamics upon inhibitor binding. Biophys J. 2011;100:144–53. doi: 10.1016/j.bpj.2010.11.004. [DOI] [PMC free article] [PubMed] [Google Scholar]
- 5.Perno CF, Yarchoan R, Cooney DA, Hartman NR, Gartner S, Popovic M, Hao Z, Gerrard TL, Wilson YA, Johns DG, et al. Inhibition of human immunodeficiency virus (HIV-1/HTLV-IIIBa-L) replication in fresh and cultured human peripheral blood monocytes/macrophages by azidothymidine and related 2′,3′-dideoxynucleosides. J Exp Med. 1988;168:1111–25. doi: 10.1084/jem.168.3.1111. [DOI] [PMC free article] [PubMed] [Google Scholar]
- 6.Shaw-Reid CA, Feuston B, Munshi V, Getty K, Krueger J, Hazuda DJ, Parniak MA, Miller MD, Lewis D. Dissecting the effects of DNA polymerase and ribonuclease H inhibitor combinations on HIV-1 reverse-transcriptase activities. Biochemistry. 2005;44:1595–606. doi: 10.1021/bi0486740. [DOI] [PubMed] [Google Scholar]
- 7.Hang JQ, Li Y, Yang Y, Cammack N, Mirzadegan T, Klumpp K. Substrate-dependent inhibition or stimulation of HIV RNase H activity by non-nucleoside reverse transcriptase inhibitors (NNRTIs) Biochem Biophys Res Commun. 2007;352:341–50. doi: 10.1016/j.bbrc.2006.11.018. [DOI] [PubMed] [Google Scholar]
- 8.Radzio J, Sluis-Cremer N. Efavirenz accelerates HIV-1 reverse transcriptase ribonuclease H cleavage, leading to diminished zidovudine excision. Mol Pharmacol. 2008;73:601–6. doi: 10.1124/mol.107.038596. [DOI] [PubMed] [Google Scholar]
- 9.Das K, Martinez SE, Bauman JD, Arnold E. HIV-1 reverse transcriptase complex with DNA and nevirapine reveals non-nucleoside inhibition mechanism. Nat Struct Mol Biol. 2012;19:253–9. doi: 10.1038/nsmb.2223. [DOI] [PMC free article] [PubMed] [Google Scholar]
- 10.Ren J, Stammers DK. Structural basis for drug resistance mechanisms for non-nucleoside inhibitors of HIV reverse transcriptase. Virus Res. 2008;134:157–70. doi: 10.1016/j.virusres.2007.12.018. [DOI] [PubMed] [Google Scholar]
- 11.Himmel DM, Sarafianos SG, Dharmasena S, Hossain MM, McCoy-Simandle K, Ilina T, Clark AD, Jr, Knight JL, Julias JG, Clark PK, Krogh-Jespersen K, Levy RM, Hughes SH, Parniak MA, Arnold E. HIV-1 reverse transcriptase structure with RNase H inhibitor dihydroxy benzoyl naphthyl hydrazone bound at a novel site. ACS Chem Biol. 2006;1:702–12. doi: 10.1021/cb600303y. [DOI] [PMC free article] [PubMed] [Google Scholar]
- 12.Sarafianos SG, Marchand B, Das K, Himmel DM, Parniak MA, Hughes SH, Arnold E. Structure and function of HIV-1 reverse transcriptase: molecular mechanisms of polymerization and inhibition. J Mol Biol. 2009;385:693–713. doi: 10.1016/j.jmb.2008.10.071. [DOI] [PMC free article] [PubMed] [Google Scholar]
- 13.Miller CD, Crain J, Tran B, Patel N. Rilpivirine: a new addition to the anti-HIV-1 armamentarium. Drugs Today (Barc) 2011;47:5–15. doi: 10.1358/dot.2011.47.1.1583188. [DOI] [PubMed] [Google Scholar]
- 14.Hsiou Y, Ding J, Das K, Clark AD, Jr, Boyer PL, Lewi P, Janssen PA, Kleim JP, Rosner M, Hughes SH, Arnold E. The Lys103Asn mutation of HIV-1 RT: a novel mechanism of drug resistance. J Mol Biol. 2001;309:437–45. doi: 10.1006/jmbi.2001.4648. [DOI] [PubMed] [Google Scholar]
- 15.Ren J, Nichols CE, Chamberlain PP, Weaver KL, Short SA, Chan JH, Kleim JP, Stammers DK. Relationship of potency and resilience to drug resistant mutations for GW420867X revealed by crystal structures of inhibitor complexes for wild-type, Leu100Ile, Lys101Glu, and Tyr188Cys mutant HIV-1 reverse transcriptases. J Med Chem. 2007;50:2301–9. doi: 10.1021/jm061117m. [DOI] [PubMed] [Google Scholar]
- 16.Ren J, Nichols CE, Chamberlain PP, Weaver KL, Short SA, Stammers DK. Crystal structures of HIV-1 reverse transcriptases mutated at codons 100, 106 and 108 and mechanisms of resistance to non-nucleoside inhibitors. J Mol Biol. 2004;336:569–78. doi: 10.1016/j.jmb.2003.12.055. [DOI] [PubMed] [Google Scholar]
- 17.Sarafianos SG, Das K, Hughes SH, Arnold E. Taking aim at a moving target: designing drugs to inhibit drug-resistant HIV-1 reverse transcriptases. Curr Opin Struct Biol. 2004;14:716–30. doi: 10.1016/j.sbi.2004.10.013. [DOI] [PubMed] [Google Scholar]
- 18.Hsiou Y, Das K, Ding J, Clark AD, Jr, Kleim JP, Rosner M, Winkler I, Riess G, Hughes SH, Arnold E. Structures of Tyr188Leu mutant and wild-type HIV-1 reverse transcriptase complexed with the non-nucleoside inhibitor HBY 097: inhibitor flexibility is a useful design feature for reducing drug resistance. J Mol Biol. 1998;284:313–23. doi: 10.1006/jmbi.1998.2171. [DOI] [PubMed] [Google Scholar]
- 19.Ren J, Esnouf R, Hopkins A, Ross C, Jones Y, Stammers D, Stuart D. The structure of HIV-1 reverse transcriptase complexed with 9-chloro-TIBO: lessons for inhibitor design. Structure. 1995;3:915–26. doi: 10.1016/S0969-2126(01)00226-X. [DOI] [PubMed] [Google Scholar]
- 20.Ren J, Nichols C, Bird L, Chamberlain P, Weaver K, Short S, Stuart DI, Stammers DK. Structural mechanisms of drug resistance for mutations at codons 181 and 188 in HIV-1 reverse transcriptase and the improved resilience of second generation non-nucleoside inhibitors. J Mol Biol. 2001;312:795–805. doi: 10.1006/jmbi.2001.4988. [DOI] [PubMed] [Google Scholar]
- 21.O’Brien SE, Brown DG, Mills JE, Phillips C, Morris G. Computational tools for the analysis and visualization of multiple protein-ligand complexes. J Mol Graph Model. 2005;24:186–94. doi: 10.1016/j.jmgm.2005.08.003. [DOI] [PubMed] [Google Scholar]
- 22.Paris KA, Haq O, Felts AK, Das K, Arnold E, Levy RM. Conformational landscape of the human immunodeficiency virus type 1 reverse transcriptase non-nucleoside inhibitor binding pocket: lessons for inhibitor design from a cluster analysis of many crystal structures. J Med Chem. 2009;52:6413–20. doi: 10.1021/jm900854h. [DOI] [PMC free article] [PubMed] [Google Scholar]
- 23.van Westen GJ, Wegner JK, Bender A, Ijzerman AP, van Vlijmen HW. Mining protein dynamics from sets of crystal structures using “consensus structures”. Protein Sci. 2010;19:742–52. doi: 10.1002/pro.350. [DOI] [PMC free article] [PubMed] [Google Scholar]
- 24.Grossfield A, Zuckerman DM. Quantifying uncertainty and sampling quality in biomolecular simulations. Annu Rep Comput Chem. 2009;5:23–48. doi: 10.1016/S1574-1400(09)00502-7. [DOI] [PMC free article] [PubMed] [Google Scholar]
- 25.Romo TD, Grossfield A. Validating and improving elastic network models with molecular dynamics simulations. Proteins. 2011;79:23–34. doi: 10.1002/prot.22855. [DOI] [PubMed] [Google Scholar]
- 26.Atilgan AR, Durell SR, Jernigan RL, Demirel MC, Keskin O, Bahar I. Anisotropy of fluctuation dynamics of proteins with an elastic network model. Biophys J. 2001;80:505–15. doi: 10.1016/S0006-3495(01)76033-X. [DOI] [PMC free article] [PubMed] [Google Scholar]
- 27.Temiz NA, Meirovitch E, Bahar I. Escherichia coli adenylate kinase dynamics: comparison of elastic network model modes with mode-coupling (15)N-NMR relaxation data. Proteins. 2004;57:468–80. doi: 10.1002/prot.20226. [DOI] [PMC free article] [PubMed] [Google Scholar]
- 28.Deriu MA, Soncini M, Orsi M, Patel M, Essex JW, Montevecchi FM, Redaelli A. Anisotropic elastic network modeling of entire microtubules. Biophys J. 2010;99:2190–9. doi: 10.1016/j.bpj.2010.06.070. [DOI] [PMC free article] [PubMed] [Google Scholar]
- 29.Keskin O, Durell SR, Bahar I, Jernigan RL, Covell DG. Relating molecular flexibility to function: a case study of tubulin. Biophys J. 2002;83:663–80. doi: 10.1016/S0006-3495(02)75199-0. [DOI] [PMC free article] [PubMed] [Google Scholar]
- 30.Mao Y. Dynamical basis for drug resistance of HIV-1 protease. BMC Struct Biol. 2011;11:31. doi: 10.1186/1472-6807-11-31. [DOI] [PMC free article] [PubMed] [Google Scholar]
- 31.Wang Y, Rader AJ, Bahar I, Jernigan RL. Global ribosome motions revealed with elastic network model. J Struct Biol. 2004;147:302–14. doi: 10.1016/j.jsb.2004.01.005. [DOI] [PubMed] [Google Scholar]
- 32.Leioatts N, Romo TD, Grossfield A. Elastic Network Models are Robust to Variations in Formalism. J Chem Theory Comput. 2012;8:2424–2434. doi: 10.1021/ct3000316. [DOI] [PMC free article] [PubMed] [Google Scholar]
- 33.Bernstein FC, Koetzle TF, Williams GJ, Meyer EF, Jr, Brice MD, Rodgers JR, Kennard O, Shimanouchi T, Tasumi M. The Protein Data Bank: a computer-based archival file for macromolecular structures. J Mol Biol. 1977;112:535–42. doi: 10.1016/s0022-2836(77)80200-3. [DOI] [PubMed] [Google Scholar]
- 34.Woodcock HL, Zheng W, Ghysels A, Shao Y, Kong J, Brooks BR. Vibrational subsystem analysis: A method for probing free energies and correlations in the harmonic limit. J Chem Phys. 2008;129:214109. doi: 10.1063/1.3013558. [DOI] [PMC free article] [PubMed] [Google Scholar]
- 35.Hess B. Convergence of sampling in protein simulations. Phys Rev E Stat Nonlin Soft Matter Phys. 2002;65:031910. doi: 10.1103/PhysRevE.65.031910. [DOI] [PubMed] [Google Scholar]
- 36.Eisen MB, Spellman PT, Brown PO, Botstein D. Cluster analysis and display of genome-wide expression patterns. Proc Natl Acad Sci U S A. 1998;95:14863–8. doi: 10.1073/pnas.95.25.14863. [DOI] [PMC free article] [PubMed] [Google Scholar]
- 37.Van Wynsberghe AW, Cui Q. Interpreting correlated motions using normal mode analysis. Structure. 2006;14:1647–53. doi: 10.1016/j.str.2006.09.003. [DOI] [PubMed] [Google Scholar]
- 38.Fisher RA. Frequency distribution of the values of the correlation coefficient in samples of an indefinitely large population. Biometrika. 1915;10:507–521. [Google Scholar]
- 39.Welch BL. The generalisation of student’s problems when several different population variances are involved. Biometrika. 1947;34:28–35. doi: 10.1093/biomet/34.1-2.28. [DOI] [PubMed] [Google Scholar]
- 40.Romo TD, Grossfield A. LOOS: an extensible platform for the structural analysis of simulations. Conf Proc IEEE Eng Med Biol Soc. 2009;2009:2332–5. doi: 10.1109/IEMBS.2009.5335065. [DOI] [PubMed] [Google Scholar]
- 41.Kurle SN, Gangakhedkar RR, Sen S, Hayatnagarkar SS, Tripathy SP, Paranjape RS. Emergence of NNRTI drug resistance mutations after single-dose nevirapine exposure in HIV type 1 subtype C-infected infants in India. AIDS Res Hum Retroviruses. 2007;23:682–5. doi: 10.1089/aid.2006.0167. [DOI] [PubMed] [Google Scholar]
- 42.Steitz TA. Visualizing polynucleotide polymerase machines at work. EMBO J. 2006;25:3458–68. doi: 10.1038/sj.emboj.7601211. [DOI] [PMC free article] [PubMed] [Google Scholar]
- 43.Svetlov V, Nudler E. Macromolecular micromovements: how RNA polymerase translocates. Curr Opin Struct Biol. 2009;19:701–7. doi: 10.1016/j.sbi.2009.10.002. [DOI] [PMC free article] [PubMed] [Google Scholar]
- 44.Shen L, Shen J, Luo X, Cheng F, Xu Y, Chen K, Arnold E, Ding J, Jiang H. Steered molecular dynamics simulation on the binding of NNRTI to HIV-1 RT. Biophys J. 2003;84:3547–63. doi: 10.1016/S0006-3495(03)75088-7. [DOI] [PMC free article] [PubMed] [Google Scholar]
- 45.Temiz NA, Bahar I. Inhibitor binding alters the directions of domain motions in HIV-1 reverse transcriptase. Proteins. 2002;49:61–70. doi: 10.1002/prot.10183. [DOI] [PubMed] [Google Scholar]
- 46.Zhou Z, Madrid M, Evanseck JD, Madura JD. Effect of a bound non-nucleoside RT inhibitor on the dynamics of wild-type and mutant HIV-1 reverse transcriptase. J Am Chem Soc. 2005;127:17253–60. doi: 10.1021/ja053973d. [DOI] [PubMed] [Google Scholar]
- 47.Chamberlain PP, Ren J, Nichols CE, Douglas L, Lennerstrand J, Larder BA, Stuart DI, Stammers DK. Crystal structures of Zidovudine- or Lamivudine-resistant human immunodeficiency virus type 1 reverse transcriptases containing mutations at codons 41, 184, and 215. J Virol. 2002;76:10015–9. doi: 10.1128/JVI.76.19.10015-10019.2002. [DOI] [PMC free article] [PubMed] [Google Scholar]
- 48.Ren J, Milton J, Weaver KL, Short SA, Stuart DI, Stammers DK. Structural basis for the resilience of efavirenz (DMP-266) to drug resistance mutations in HIV-1 reverse transcriptase. Structure. 2000;8:1089–94. doi: 10.1016/s0969-2126(00)00513-x. [DOI] [PubMed] [Google Scholar]
- 49.Braz VA, Holladay LA, Barkley MD. Efavirenz binding to HIV-1 reverse transcriptase monomers and dimers. Biochemistry. 2010;49:601–10. doi: 10.1021/bi901579y. [DOI] [PMC free article] [PubMed] [Google Scholar]
- 50.Wang J, Liang H, Bacheler L, Wu H, Deriziotis K, Demeter LM, Dykes C. The non-nucleoside reverse transcriptase inhibitor efavirenz stimulates replication of human immunodeficiency virus type 1 harboring certain non-nucleoside resistance mutations. Virology. 2010;402:228–37. doi: 10.1016/j.virol.2010.03.018. [DOI] [PMC free article] [PubMed] [Google Scholar]
- 51.Das K, Clark AD, Jr, Lewi PJ, Heeres J, De Jonge MR, Koymans LM, Vinkers HM, Daeyaert F, Ludovici DW, Kukla MJ, De Corte B, Kavash RW, Ho CY, Ye H, Lichtenstein MA, Andries K, Pauwels R, De Bethune MP, Boyer PL, Clark P, Hughes SH, Janssen PA, Arnold E. Roles of conformational and positional adaptability in structure-based design of TMC125-R165335 (etravirine) and related non-nucleoside reverse transcriptase inhibitors that are highly potent and effective against wild-type and drug-resistant HIV-1 variants. J Med Chem. 2004;47:2550–60. doi: 10.1021/jm030558s. [DOI] [PubMed] [Google Scholar]
- 52.Das K, Ding J, Hsiou Y, Clark AD, Jr, Moereels H, Koymans L, Andries K, Pauwels R, Janssen PA, Boyer PL, Clark P, Smith RH, Jr, Kroeger Smith MB, Michejda CJ, Hughes SH, Arnold E. Crystal structures of 8-Cl and 9-Cl TIBO complexed with wild-type HIV-1 RT and 8-Cl TIBO complexed with the Tyr181Cys HIV-1 RT drug-resistant mutant. J Mol Biol. 1996;264:1085–100. doi: 10.1006/jmbi.1996.0698. [DOI] [PubMed] [Google Scholar]
- 53.Bakan A, Bahar I. The intrinsic dynamics of enzymes plays a dominant role in determining the structural changes induced upon inhibitor binding. Proc Natl Acad Sci U S A. 2009;106:14349–54. doi: 10.1073/pnas.0904214106. [DOI] [PMC free article] [PubMed] [Google Scholar]
- 54.Hsiou Y, Ding J, Das K, Clark AD, Jr, Hughes SH, Arnold E. Structure of unliganded HIV-1 reverse transcriptase at 2.7 A resolution: implications of conformational changes for polymerization and inhibition mechanisms. Structure. 1996;4:853–60. doi: 10.1016/s0969-2126(96)00091-3. [DOI] [PubMed] [Google Scholar]
- 55.Sarafianos SG, Clark AD, Jr, Das K, Tuske S, Birktoft JJ, Ilankumaran P, Ramesha AR, Sayer JM, Jerina DM, Boyer PL, Hughes SH, Arnold E. Structures of HIV-1 reverse transcriptase with pre- and post-translocation AZTMP-terminated DNA. EMBO J. 2002;21:6614–24. doi: 10.1093/emboj/cdf637. [DOI] [PMC free article] [PubMed] [Google Scholar]
- 56.Esnouf R, Ren J, Ross C, Jones Y, Stammers D, Stuart D. Mechanism of inhibition of HIV-1 reverse transcriptase by non-nucleoside inhibitors. Nat Struct Biol. 1995;2:303–8. doi: 10.1038/nsb0495-303. [DOI] [PubMed] [Google Scholar]
- 57.Ren J, Esnouf R, Garman E, Somers D, Ross C, Kirby I, Keeling J, Darby G, Jones Y, Stuart D, et al. High resolution structures of HIV-1 RT from four RT-inhibitor complexes. Nat Struct Biol. 1995;2:293–302. doi: 10.1038/nsb0495-293. [DOI] [PubMed] [Google Scholar]
- 58.Lindberg J, Sigurdsson S, Lowgren S, Andersson HO, Sahlberg C, Noreen R, Fridborg K, Zhang H, Unge T. Structural basis for the inhibitory efficacy of efavirenz (DMP-266), MSC194 and PNU142721 towards the HIV-1 RT K103N mutant. Eur J Biochem. 2002;269:1670–7. doi: 10.1046/j.1432-1327.2002.02811.x. [DOI] [PubMed] [Google Scholar]
Associated Data
This section collects any data citations, data availability statements, or supplementary materials included in this article.
Supplementary Materials
Supp Data S1