Hippo kinases LATS1/2 control human breast cell fate via crosstalk with ERα (original) (raw)
. Author manuscript; available in PMC: 2019 Sep 4.
Published in final edited form as: Nature. 2017 Jan 9;541(7638):541–545. doi: 10.1038/nature20829
Abstract
Cell fate perturbations underlie many human diseases, including breast cancer1,2. Unfortunately, the regulation of breast cell fate remains largely elusive. The mammary gland epithelium consists of differentiated luminal epithelial and basal myoepithelial cells, as well as undifferentiated stem cells and more restricted progenitors3,4. Breast cancer originates from this epithelium but the molecular mechanisms underlying breast epithelial hierarchy remain ill-defined. Using a high-content confocal image-based shRNA screen for tumor suppressors regulating breast cell fate, we have discovered that ablation of the Hippo kinases large tumor suppressors (LATS) 1 and 25,6, promotes the luminal phenotype and increases the number of bipotent and luminal progenitors, the proposed cell-of-origin of most human breast cancers. Mechanistically, we revealed a crosstalk between Hippo and ERα signaling. In the presence of LATS, ERα was targeted for ubiquitination and Ddb1–cullin4-associated-factor 1 (DCAF1)-dependent proteasomal degradation. Absence of LATS stabilized ERα and the Hippo effectors YAP/TAZ, which in concert control breast cell fate via intrinsic and paracrine mechanisms. Our findings reveal a novel non-canonical (i.e., YAP/TAZ-independent) effect of LATS in the regulation of human breast cell fate.
Keywords: LATS1, LATS2, Hippo, ERα, cell fate, YAP, TAZ, breast, c-KIT, luminal progenitor, breast cancer
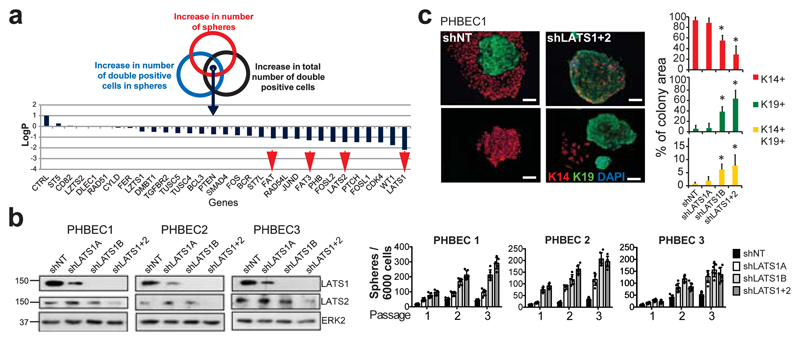
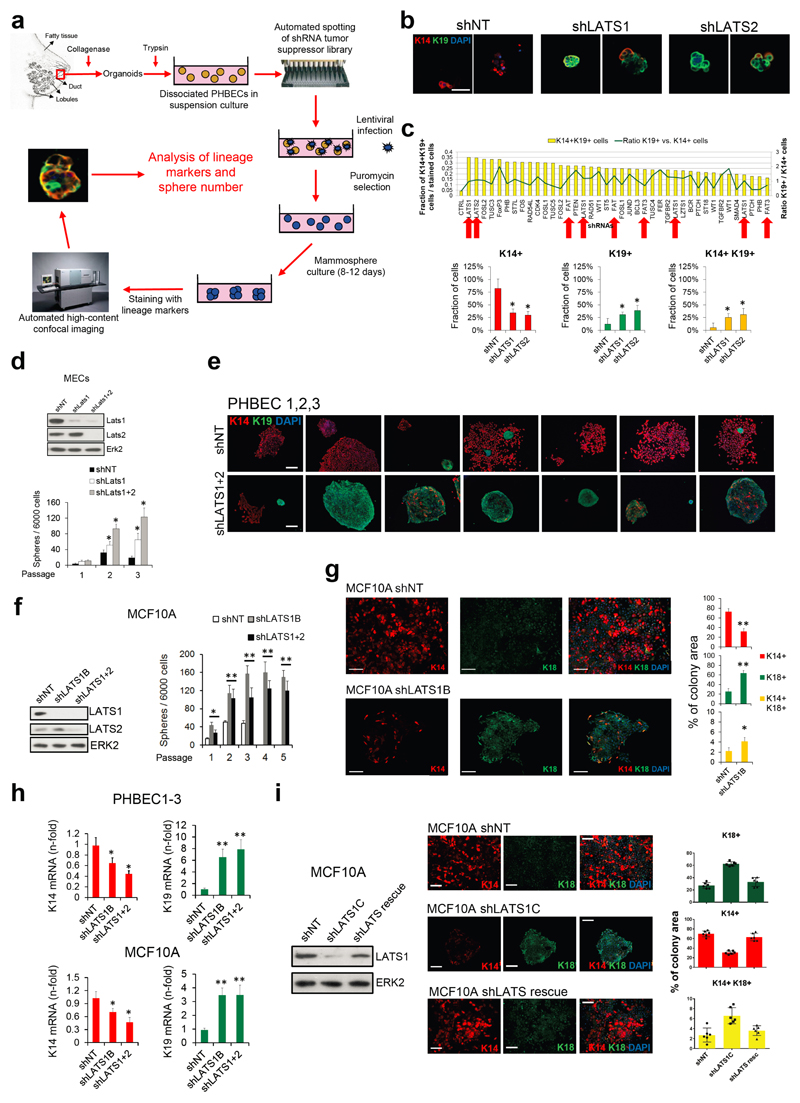
We have developed a high-content image-based shRNA screen (Supplementary Table 1, Extended Data Fig. 1a) to identify regulators of breast epithelial cell fate. We cultured unpassaged primary human breast epithelial cells (PHBECs) as non-adherent mammospheres that are enriched in stem/progenitor cells7, infected them with a tumor suppressor shRNA library, and quantified the number and size of spheres and the fractions of basal K14-positive, luminal K19-positive, and K14/K19 double-positive progenitor cells8 in the spheres (Extended Data Fig. 1b, Supplementary Table 2). shRNAs targeting regulators of the Hippo pathway (LATS1, LATS2, FAT1, FAT3) scored high in increasing sphere formation and the number of K14/K19 double-positive cells (Fig. 1a, Supplementary Table 3).
Figure 1. Ablation of LATS increases sphere formation and the fractions of progenitor and luminal cells.
a, Schematic and bar graph showing RSA parameters and average log-transformed _P_-values of the 30 most significant genes. Arrows indicate members of the Hippo pathway. b, Knockdown of LATS increases sphere formation over several passages. Immunoblots showing knockdown efficiency and bar graphs showing sphere formation of three different PHBECs. shNT: non-targeting shRNA control; shLATS1A, shLATS1B: shRNAs targeting LATS1; shLATS1+2: shRNA targeting LATS1 and LATS2. Data are means ± s.d. (n = 3 experimental replicates (er), 2 technical replicates (tr)). c, Inhibition of LATS decreases the fraction of basal cells and increases the fractions of luminal and double-positive cells. Representative immunofluorescence images (left panels) and quantifications (right panels) of PHBEC1 shNT and shLATS1+2 colonies stained with antibodies against K14 (red) and K19 (green). Data are means ± s.d. (n = 3 biological replicates (br), each 2 er and 2 tr), Scale bars = 50 µm. For source data of main figures see the supplementary information files. *P<0.05.
shRNAs targeting these genes increased the fractions of double-positive and luminal K19-positive cells (Extended Data Fig. 1b, c and Supplementary Tables 2, 3). In the human breast, K14/K19 not only mark bipotent cells but also luminal progenitors4,9,10, which also exhibit high sphere formation capacities and were suggested to harbor the cell-of-origin of most breast cancers9,11. LATS knockdown increased self-renewal capacity of human and mouse primary unpassaged mammary cells, and yielded a higher number of K19-positive and K14/K19 double-positive PHBECs but fewer K14-positive cells than in controls (Fig. 1b, c, Extended Data Fig. 1d, e). Similarly, LATS knockdown in MCF10A cells enhanced self-renewal, decreased the number of K14-positive cells and increased the number of K18-positive and K14/K18-positive cells (Extended Data Fig. 1f-h). LATS1 cDNA introduction to MCF10A cells expressing an shRNA targeting LATS1 3´UTR (shLATS1C) reverted the phenotype of LATS knockdown and excluded potential off-target effects (Extended Data Fig. 1i).
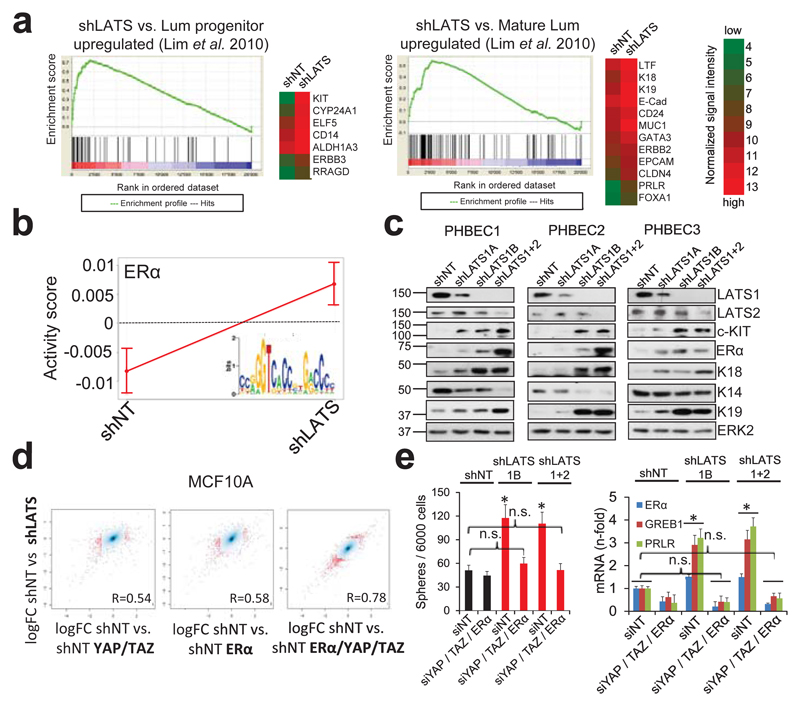
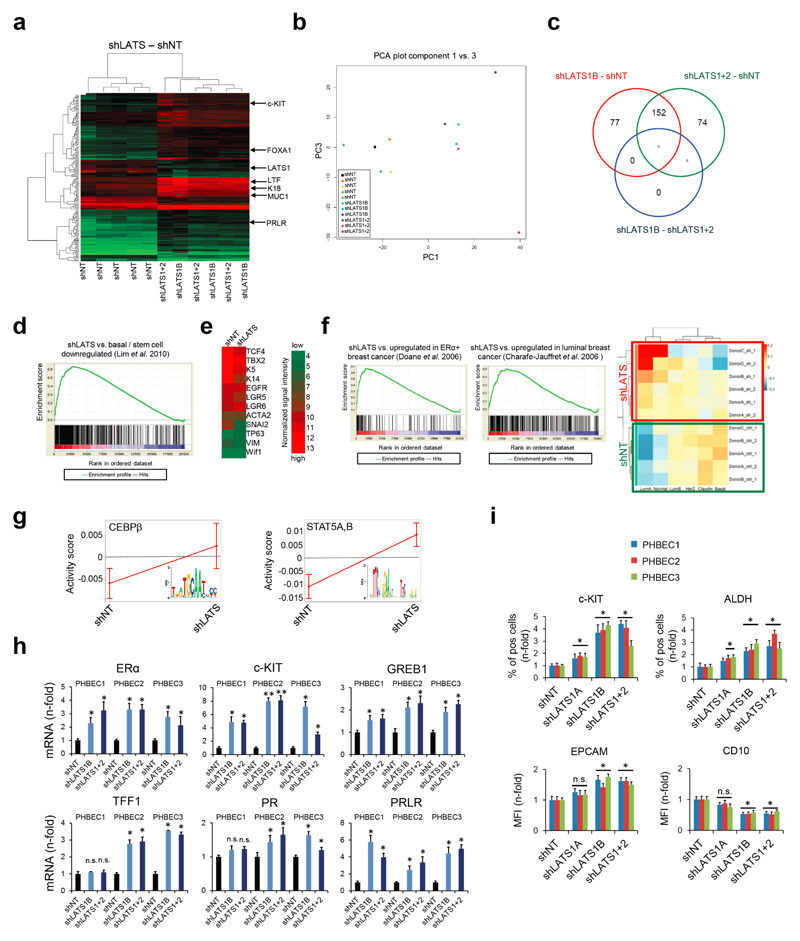
Characterization of the effects of LATS on global gene expression and breast lineage profiles revealed that the PHBECs shLATS samples clustered together irrespective of donor identity, overlapped with previously published profiles of normal luminal breast progenitor and mature luminal cells12, and were enriched for genes that are downregulated in normal basal breast cells and in genes associated with ERα-positive breast cancers13,14 (Fig. 2a, Extended Data Fig. 2a-f, Supplementary Table 4).
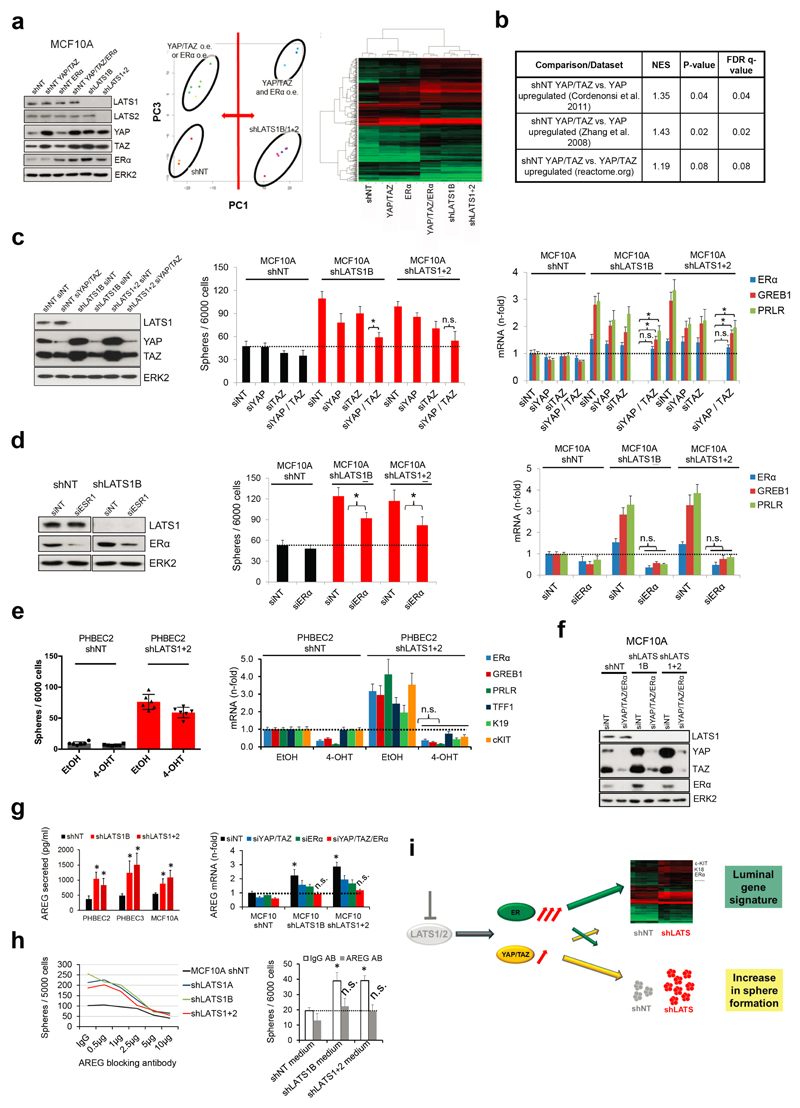
Figure 2. LATS depletion changes cell fate through activation of ERα and YAP/TAZ.
a, GSEA of shLATS PHBECs showing enrichment for luminal progenitor (left) and mature luminal (right) gene sets and correspondent heatmaps with average normalized expression values. Normalized enrichment scores (NES) are 2.28 and 1.9 and false discovery rates (FDR) are <0.0001, _P_<0.0001, respectively. **b,** Integrated System for Motif Activity Response Analysis (ISMARA) of shLATS PHBECs showing high ERα activity (_n_ = 5, Z-value 1.97, _P_ <0.001). **c,** Removal of LATS increases markers of luminal differentiated and luminal progenitor lineages. **d,** Simultaneous activation of ERα and YAP/TAZ signaling is required to phenocopy the transcriptional profile of shLATS cells. Scatterplots of whole transcriptome analysis of shNT, shNT with enforced YAP/TAZ and/or ERα expression, and shLATS in MCF10A cells. R, Spearman’s correlation coefficient. Cut-off for differentially regulated genes (in red): adjusted _P_-value <0.01, fold change >2.0, expression values >4, n = 3 er. e, Combined inhibition of YAP/TAZ and ERα fully reverts the phenotype of shLATS in MCF10A cells (sphere formation, left panel; RQ-PCR, right panel). Data are means ± s.d. (n = 6 er). *P<0.05.
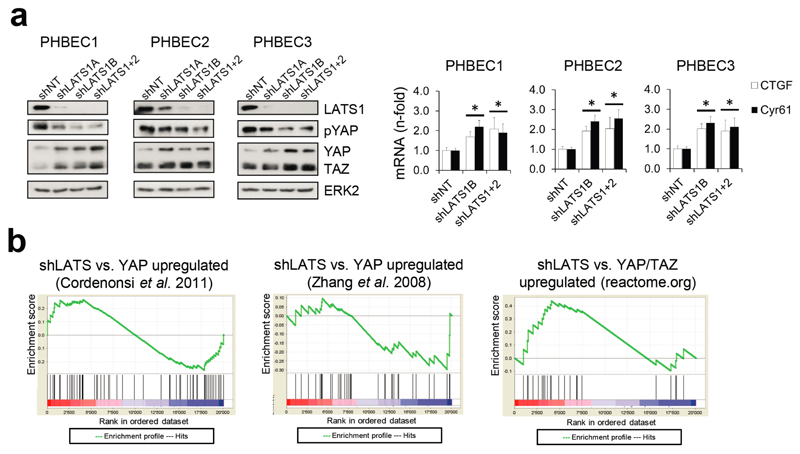
It has been shown that LATS ablation stabilizes the transcriptional co-activators YAP/TAZ that have been reported to promote basal lineage commitment in breast development15,16, and to induce epithelial-to-mesenchymal transition, the cancer stem cell phenotype, and tumor progression17–20. Our finding that LATS knockdown promotes a luminal phenotype seems paradoxical in the light of the reported effects of YAP/TAZ. To clarify this paradox and identify transcription factors that direct PHBECs lacking LATS towards a luminal phenotype, we used a computational method to model transcription factor activity (ISMARA)21. Activities of ERα and other luminal regulators22 were higher in shLATS than in shNT PHBECs (Fig. 2b, Extended Data Fig. 2g). The mRNAs of ERα, c-KIT (a marker for luminal progenitors9,11,23) and of several ERα-targets were upregulated upon LATS removal (Extended Data Fig. 2h). LATS knockdown also increased luminal and luminal progenitor markers and slightly decreased basal markers at the protein level (Fig. 2c, Extended Data Fig. 2i). LATS knockdown decreased phosphorylation of the YAP-Ser127-inhibitory site and increased YAP/TAZ protein levels. Surprisingly, this stabilization of YAP/TAZ upon LATS removal only modestly upregulated the YAP/TAZ-downstream targets CTGF and Cyr61, and we found no enrichment of YAP/TAZ-driven gene sets when the shLATS PHBEC expression profile was overlapped with datasets of YAP/TAZ targets19,24,25 (Extended Data Fig. 3a, b).
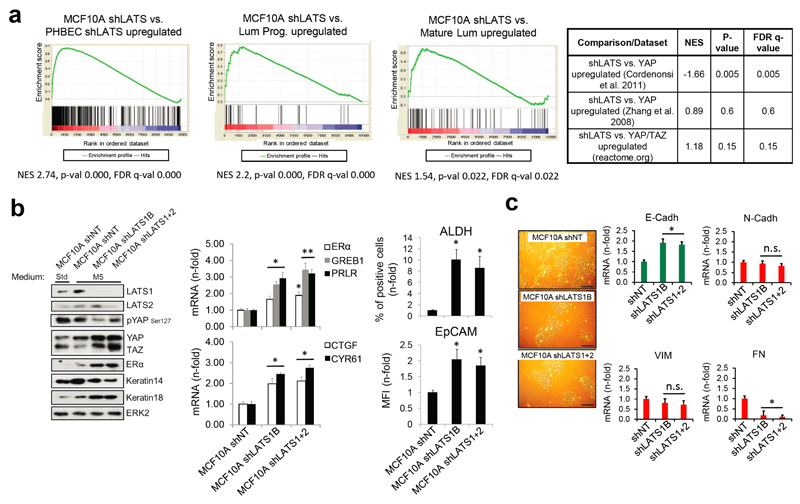
Next, we assessed the relative contribution of the two activated signaling branches, the canonical YAP/TAZ, and the non-canonical ERα to the activation of the luminal gene signature and the increase in sphere formation in cells lacking LATS. Ablation of LATS1/2 in MCF10A recapitulated the effects observed with PHBECs, regarding both the global transcriptome and the phenotype of the cells (Extended Data Fig. 4a-c; Extended Data Fig. 1f,g; Supplementary Table 5). The transient overexpression of YAP/TAZ and/or ERα to levels comparable to the shLATS cells revealed that activation of both signaling pathways is required to phenocopy the effects of LATS ablation. Exogenous expression of only YAP/TAZ enriched for YAP/TAZ signatures, which validated this approach (Fig. 2d; Extended Data Fig. 5a, b). Next, we inhibited endogenous YAP/TAZ and ERα in MCF10A shNT and shLATS cells using siRNA and assessed effects on luminal markers and sphere formation. While sphere formation capacity was almost fully reversed by siYAP/TAZ, this knockdown only partially reduced induction of luminal markers in shLATS cells. Inhibition of ERα, on the other hand, only partially reversed the enhanced sphere formation capacity of shLATS cells but fully abrogated the upregulation of luminal markers (Extended Data Fig. 5c, d, e). Notably, ablation of both YAP/TAZ and ERα signaling in shLATS cells fully reversed the increase in sphere formation capacity and the expression of luminal markers (Fig. 2e, Extended Data Fig. 5f).
Amphiregulin (AREG) is regulated by both ERα and YAP/TAZ26. AREG secretion increased in shLATS cells and depletion of both YAP/TAZ and ERα reduced AREG mRNA levels in shLATS cells to the levels of shNT controls (Extended Data Fig. 5g). An antibody blocking AREG decreased sphere formation capacity in shLATS relative to shNT cells. Conditioned media from LATS-knockdown cultures enhanced the number of spheres formed by MCF10A cells, an effect that was prevented by the AREG-blocking antibody (Extended Data Fig. 5h). Thus ERα mainly enhances the expression of luminal markers and contributes via AREG to increase sphere formation. In turn, YAP/TAZ mostly increases sphere formation and contributes partially to the increase in luminal markers (Extended Data Fig. 5i).
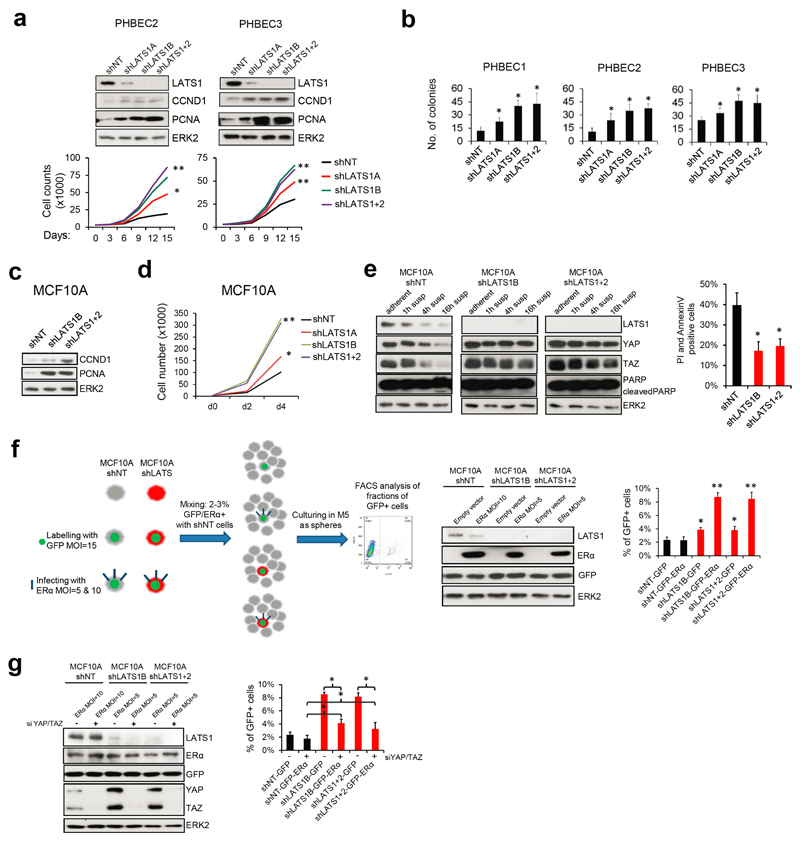
As expected, LATS knockdown increased proliferation and survival27 (Extended Data Fig. 6a-e). Hence, the increased luminal phenotype in total breast epithelial cells lacking LATS could result from expansion of the luminal ERα-positive cells. In co-cultures of labeled cells expressing ERα and/or LATS in suspension, ERα-positive cells lacking LATS outcompeted the other cells, an effect that was reversed by depletion of YAP/TAZ (Extended Data Fig. 6f, g). This suggested a YAP/TAZ-dependent expansion of ERα-positive cells in the absence of LATS.
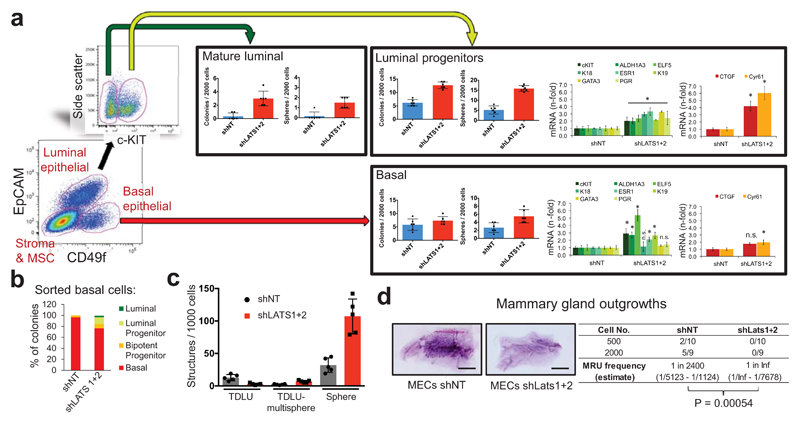
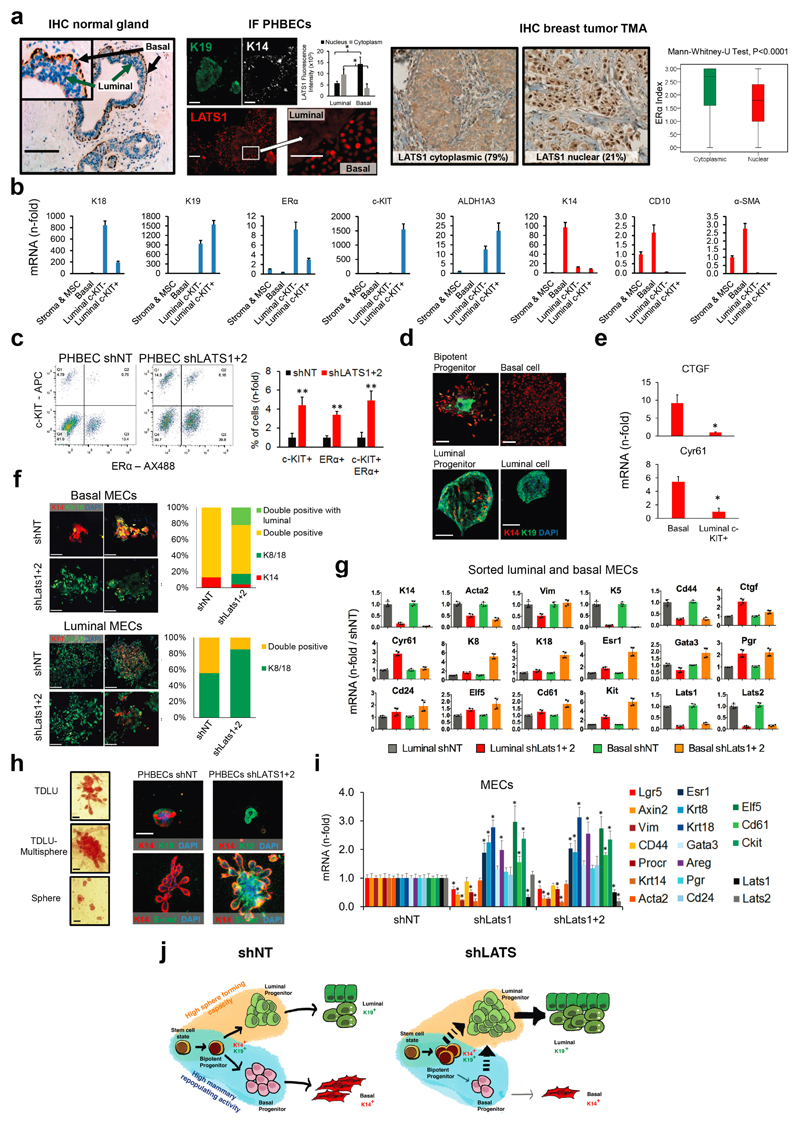
Surprisingly, analysis of LATS1 expression in normal breast tissue, PHBECs, or breast tumors revealed that LATS1 is mostly nuclear in basal cells and cytoplasmic in luminal cells (Extended Data Fig. 7a). We investigated the effects of LATS in FACS-sorted subpopulations9 (Fig. 3a, Extended Data Fig. 7b). LATS ablation in luminal mature and progenitor cells enhanced sphere and colony formation (Fig. 3a), in line with the observed increase in the fraction of these subpopulations (Extended Data Fig. 7c). While loss of LATS in basal cells had no effect on sphere or colony numbers, the number of luminal (K19+), bipotent and luminal progenitor (K14+/K19+)-derived colonies increased. Control basal cells only yielded basal and bipotent progenitor-derived colonies (Fig. 3b, Extended Data Fig. 7d). Depletion of LATS in luminal progenitor cells, where it is mostly cytoplasmic, upregulated markers for mature luminal cells and induced YAP/TAZ activity. Loss of LATS in basal cells, where it is mostly nuclear, upregulated markers of luminal progenitor and mature luminal cells; there was only a slight increase in YAP/TAZ downstream targets, which were already expressed at higher levels than in luminal cells (Fig. 3a and Extended Data Fig. 7e)15,16. These subpopulation-specific effects of LATS removal were also observed in FACS-sorted subpopulations of mouse mammary cells (Extended Data Fig. 7f, g).
Figure 3. Different effects of LATS in luminal and basal breast cells.
a, FACS sorting scheme of breast epithelial cell subpopulations based on EpCAM and CD49f (left panel). Bar graphs showing increased sphere and colony formation upon LATS depletion in c-KIT+ luminal progenitors and c-KIT- mature luminal cells Data are means ± s.d. (n = 3 er, 2 tr). RQ-PCR analysis showing upregulation of mature luminal genes and YAP/TAZ targets in c-KIT+ cells, and upregulation of luminal progenitor genes in basal cells (right panel). Data are means ± s.d. (n = 2 br with each 3 er). *P<0.05. b, Basal cells acquire a luminal phenotype upon removal of LATS. Quantification of colony phenotypes formed by basal shNT and shLATS PHBECs based on K14/K19 expression. Data are means ± s.d. (n = 2 br with each 3 er, 2 tr). c, shLATS cells form 3D structures resembling the phenotype of a luminal progenitor-rich population of cells. Quantification of 3D structures formed by shLATS PHBECs in collagen gels. Data are means ± s.d. (n = 5 er). d, Representative pictures and table with number of outgrowths in cleared-fat-pad transplantation of shNT and shLATS MECs. Scale bars = 500 µm, Inf, infinity, MRU, mammary repopulating unit.
In an assay quantifying the regenerative potential of PHBECs ex vivo28, shLATS cells seeded on floating collagen gels formed more multisphere-like terminal-ductal lobular units (TDLUs) and spheres, which originate from luminal progenitors, than the controls, but fewer TDLUs, which arise from the basal compartment (Fig. 3c and Extended Data Fig. 7h). Next, we ablated Lats1/2 in primary mouse epithelial cells and injected different cell numbers into cleared mammary fat pads. Notably, cells depleted of Lats formed no outgrowths (Fig. 3d). Transcriptional profiling of the cells prior to injection revealed higher levels of luminal and luminal progenitor markers and lower levels of basal and mouse mammary stem cell activity markers in shLats cells (Extended Data Fig. 7i).
Our results show that LATS ablation in breast epithelial cells expands luminal and bipotent progenitors and enhances differentiation along the luminal lineage at the expense of basal progenitors and basal cells. This results in a population of cells with high sphere forming capacity, low mammary repopulating activity, and a luminal phenotype (Extended Data Fig. 7j).
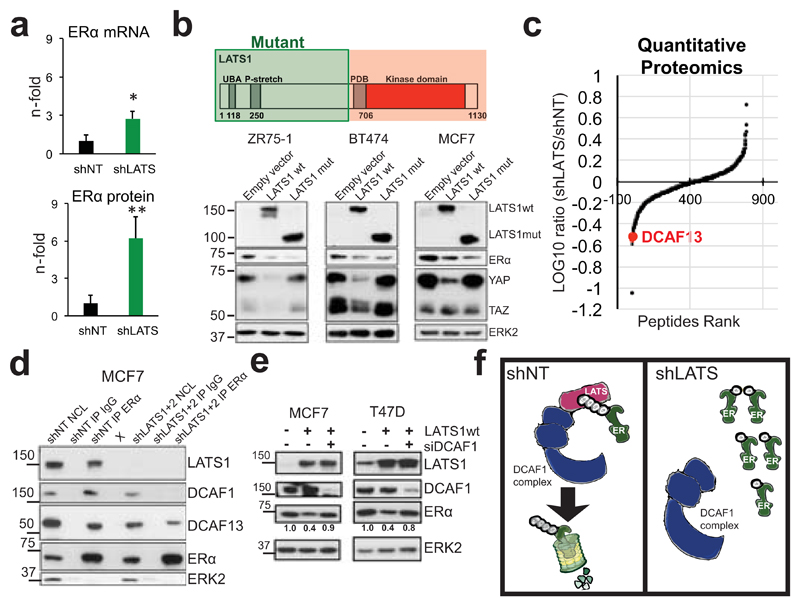
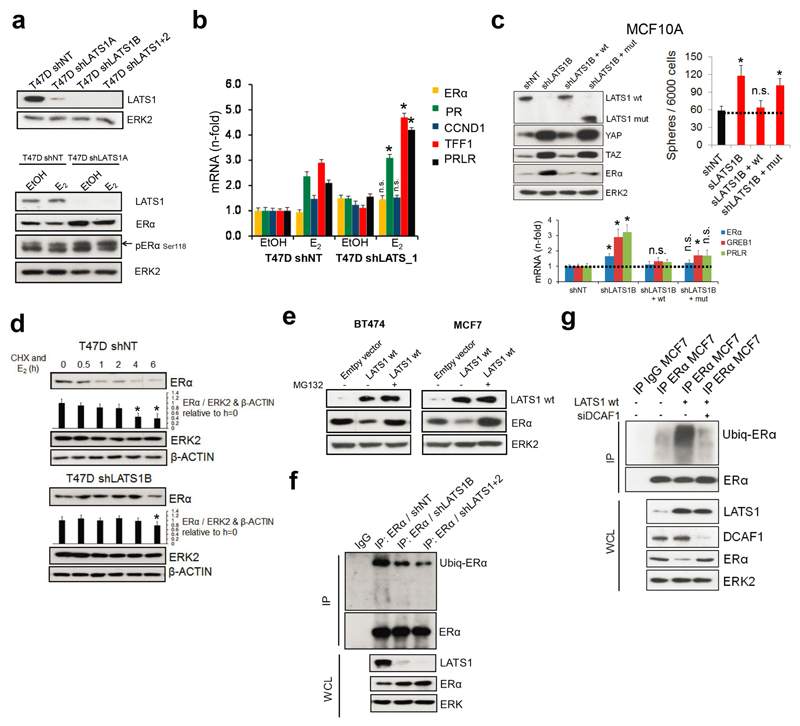
The pronounced upregulation of ERα protein upon removal of LATS contrasts with a modest increase in ERα mRNA (Fig. 4a), which prompted us to address whether LATS regulates ERα protein levels directly. We used luminal human breast cancer cells because they express ERα endogenously and are amenable to experimental manipulation. Removal of LATS upregulated ERα protein and target genes. Expression of LATS1 either full-length or lacking the kinase domain decreased ERα levels and rescued the upregulation of luminal genes in shLATS cells (Fig. 4b and Extended Data Fig. 8a-c), suggesting that the kinase activity of LATS1 is dispensable for ERα regulation. Following inhibition of translation, LATS knockdown increased the half-life of ERα protein upon stimulation with estrogen and this effect was dependent on proteasomal degradation of ERα (Extended Data Fig. 8d, e). Given that ubiquitination of ERα precedes its proteasomal degradation and that the LATS1 mutant that exhibited downregulation of ERα protein contains an N-terminal ubiquitin-associated domain, we tested whether ubiquitination of ERα is reduced in the absence of LATS and found this to be the case (Extended Data Fig. 8f).
Figure 4. LATS targets ERα to ubiquitin-mediated proteasomal degradation via DCAF1.
a, Quantification of ESR1 mRNA (RQ-PCR) and ERα protein levels (immunoblotting) in PHBECs, MFC10A cells and MECs in the presence or absence of LATS. Data are means ± s.d. (n = 4 br, each 2 er), *P <0.05, **P<0.01. b, Downregulation of ERα is independent of LATS kinase activity. Immunoblots of cell lysates from three ERα+ cell lines transfected with LATS1 full-length wild type cDNA (wt) or a truncated, kinase-dead cDNA (mut; top scheme). c, Scatter plot of peptides interacting with ERα in the presence or absence of LATS as measured by quantitative proteomics in MCF7 cells. d, LATS deficiency reduces DCAF1/13-ERα interaction. Immunoblots of nuclear cell lysates (NCL) and of immunoprecipitations (IP) with anti-ERα or IgG ctrl antibodies. X: empty well. e, DCAF1 is necessary for LATS-mediated ERα degradation. Immunoblots of cells transfected with LATS wt and/or siRNA DCAF1. f, Scheme depicting the complex formed between LATS, DCAF1 and ERα that results in ERα degradation.
To delineate the mechanism by which LATS degrades ERα, we performed ERα IPs followed by quantitative proteomics. The ubiquitin ligase substrate receptor DCAF13, a member of the DDB1 and CUL4-associated factors (DCAF) protein family, declined in ERα IPs from cells lacking LATS (Fig. 4c and Supplementary Table 5). DCAF1 has recently been shown to interact with LATS129 and our co-immunoprecipitation experiments revealed a protein complex consisting of LATS1, DCAF1, DCAF13 and ERα (Fig. 4d). Notably, DCAF13 expression was reduced and DCAF1 was completely absent in ERα complexes from cells lacking LATS; depletion of DCAF1 in cells exogenously expressing LATS1 prevented ubiquitination and degradation of ERα (Extended Data Fig. 8g, Fig. 4d,e). These findings suggest that LATS1-dependent degradation of ERα requires the presence of DCAF1 and support a model in which the N-terminal domains of LATS1 act as an adaptor bringing together a complex containing LATS1, ERα and DCAF1 (Fig. 4f).
Lastly, analysis of human primary breast tumors and cell lines revealed barely detectable LATS1 protein expression, which correlated negatively with ERα levels in primary tumors, and LATS1 protein was low or not detected in 75% of basal and in all luminal breast cancer lines compared with MCF10A cells (Extended Data Fig. 9a). This is in line with the effects of LATS1 on downregulation of ERα levels we discovered in normal mammary cells.
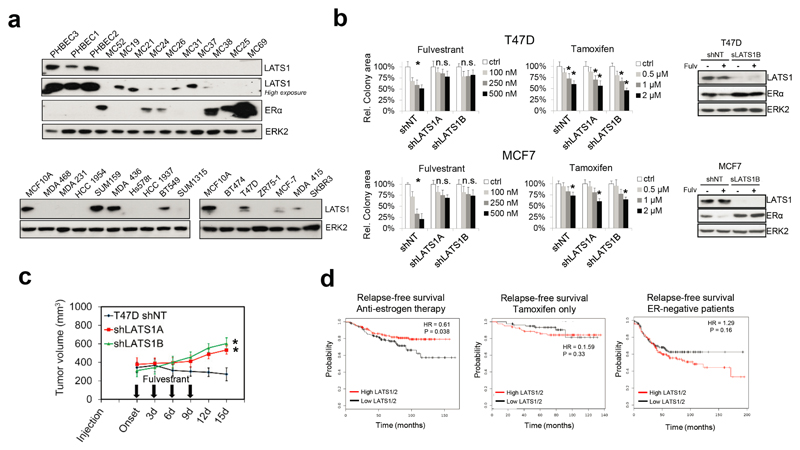
Next, we addressed whether loss of LATS affects proliferation, tumor growth, or treatment response in ERα-positive breast cancer models. Downregulation of LATS in T47D and MCF7 cells reduced sensitivity to fulvestrant but had no effect on untreated or tamoxifen-treated cells. Consistently, fulvestrant failed to degrade ERα or to reduce the tumor growth of cancer cells lacking LATS (Extended Data Fig. 9b, c). These findings suggest that loss of LATS in luminal breast cancer models stabilizes ERα and results in resistance to treatments targeting the downregulation of ERα. Analysis of publically available datasets30 revealed that low expression of LATS1/2 is associated with reduced relapse-free survival of breast cancer patients treated with anti-estrogen therapy but not of patients treated with tamoxifen only. The opposite trend was observed in ERα-negative patients, where higher levels of LATS1/2 tended to result in lower relapse-free survival (Extended Data Fig. 9d), possibly by contributing to lower ERα levels and consequently higher aggressiveness of the disease.
The Hippo tumor suppressor pathway is a universal governor of organ size and controls cell fate. The effects of upstream LATS that phosphorylate and inhibit the canonical Hippo pathway transcriptional co-activators YAP/TAZ have remained unclear, as has the question of whether these kinases regulate other pathways. Here we report that LATS controls cell fate in the normal breast by differential effects in luminal and basal cells and reveal non-canonical crosstalk between the Hippo pathway and ERα signaling (Extended Data Fig. 10). We discovered that removal of LATS results in an expansion of mature luminal cells, a decrease in basal cells, and an increase in bipotent and luminal progenitor cells. Deletion of LATS in basal cells drives a luminal phenotype possibly by differentiation of bipotent cells or transdifferentiation of basal progenitors (Extended Data Fig. 7j).
The fact that lack of LATS results in YAP/TAZ stabilization but promotes breast luminal phenotype may seem paradoxical in the light of previous studies showing that YAP/TAZ expression is associated with a basal fate15,16 and challenges the view that inactivation of Hippo signaling systematically enhances stemness19,27. Unlike previous studies that overexpressed YAP/TAZ, we inactivated Hippo signaling by ablating the upstream kinase LATS. This results in both ERα and YAP/TAZ stabilization and, thus, resolves this apparent paradox. Indeed, the net result of ERα and YAP/TAZ stabilization after LATS knockdown promotes luminal differentiation and depletes mammary repopulating capacity. This provides a cell-autonomous explanation for the previously observed lack of mammary glands in Lats1 knockout mice31.
Our findings of non-canonical crosstalk between Hippo and ERα signaling may have far-reaching implications beyond the mammary gland as estrogen signaling is important for almost all tissues32. Testing the effects of organ-specific deletions of Hippo-pathway components are warranted and may shed light on how this newly discovered crosstalk with estrogen signaling affects cell plasticity and development in a wide variety of tissues.
Online Methods
Primary human cell culture
For the 3D breast cell fate screen, breast tissues were collected from women undergoing reduction mammoplasties and handled and maintained according to protocols approved by the GNF Biomedical Institutional Review Board. To isolate single PHBECs, primary breast tissues were mechanically dissociated and digested in serum-free mammary epithelial growth media (MEGM, Lonza) containing 200–300 U/ml collagenase (Worthington), treated with 0.25% trypsin for 1–2 min, 1× red blood cell lysis buffer for 3 min, and then filtered through cell strainers. The dissociated single PHBECs were cultured to generate mammospheres in modified serum-free MEGM media supplemented with 20 ng/ml bFGF (Invitrogen), 20 ng/ml EGF (Invitrogen), 0.5× B27 (Invitrogen), 4 µg/ml heparin (Sigma), 2 mM glutamine (Invitrogen), 5 µg/ml insulin (Sigma), and 10−6 M hydrocortisone (StemCell Technologies). Bovine pituitary extract was excluded from the MEGM kit.
For all the follow-up experiments, fresh reduction mammoplasty tissue samples obtained with appropriate informed consent were used to isolate PHBECs according to previously published protocols33–35. Approval for culture of reduction mammoplasty tissue was granted by the Ethics Commission Beider Basel (EKBB). Breast epithelial cells were cultured in M5 medium which we have previously shown to allow the propagation of undifferentiated epithelial precursor cells in suspension and their differentiation along the two breast epithelial lineages33. M5 medium comprises 50% M199 medium (ANIMED/Bioconcept), 50% F12 (SIGMA) supplemented with 20 ng/ml EGF (PeproTech DE), 1x B-27 (Invitrogen/GIBCO), 1 nM 17-β-estradiol, 57 µM β-mercaptoethanol, 15 mM Hepes (SIGMA), and 1x penicillin/streptomycin (Invitrogen/GIBCO). M5 was used for all experiments with PHBECs. Modified polystyrene culture plates (BD, Falcon Primaria) were used for monolayer colony formation and differentiation assays of PHBECs. Five hundred to 2000 cells were seeded per well in 6-well plates and grown in M5 medium for 7-10 days prior to fixation or lysis. For 3D sphere formation assays, 2’000-10’000 cells / ml were grown in ultra-low attachment (ULA) dishes (Corning) for 6-10 days. For floating collagen gel assays 28, single-cell suspensions were quickly mixed with neutralizing solution and acidified rat tail collagen I (Corning) was added, to a final concentration of 1.3 mg/ml. The gel mixture was plated into siloxane-coated 24-well plates at a density of 2x10⁴ cells / gel. After polymerization of the gel, medium with supplements was added and gels were detached from the well. Cells were initially cultured for 5 days in mammary epithelial cell growth medium (MECGM, PromoCell) supplemented with 1% pen/strep (Invitrogen), 0.5% FCS (Pan Biotech), 3 µM Y-27632 (Biomol) and 10 µM forskolin (Biomol). The medium was replaced with M5 medium for the following 7 days of culture. All primary cells were cultured at 37°C in a humidified 5% CO2, 5% O2 controlled incubator.
3D breast cell fate screen
PHBECs were plated at a cell density of 3’000 cells per well in a 384-well plate. After 24 h, the PHBECs were spin-transduced at 1’800 rpm for 1 hour with lentivirus carrying a tumor suppressor shRNA library targeting 77 genes, each represented by 3-5 different shRNAs (Supplementary Table 1). The PHBECs were selected 24 h after transduction by 0.4 µg/ml puromycin. After 10 days of culture (at day 13), the PHBEC-derived mammospheres were fixed in ice-cold MeOH for immunofluorescence staining and high-content confocal imaging. Anti-K14 (Abcam, LL002, IgG3) and anti-K19 (Abcam, A53-B/A2, IgG2a) were used as primary antibodies (at day 13), and Alexa Fluor 488-anti-mouse IgG3 and Alexa Fluor 633-anti-mouse IgG2a were used as secondary antibodies (at day 14). The automated “bottle valve” dispenser at GNF was used for media/reagent addition and removal via aspiration.
High-content confocal imaging and RSA analysis
Mammospheres were examined in a 384-well plate by immunofluorescence staining and high-content confocal imaging using an Opera High Content Screening System (PerkinElmer). The plate was imaged at a resolution of 20x and three optical sections separated by 30 µm were collected. Optical sectioning was optimized to avoid collecting identical cells in different optical sections. In each well, 63 fields were collected for three different Z-sections (total 189 images/well). A custom analysis using Acapella was performed on the images and the analysis was as follows: 1) Assembly of the different image planes (collate the different images into a single image); 2) Detection of cell nuclei using DAPI staining in each plane; 3) Detection of cell boundaries using low level DAPI fluorescence; 4) Detection of individual spheres as a group of cells in 3D (i.e., cells in different planes are associated to the containing sphere object); 5) Association of cells from different planes to a given 3D sphere; 6) Classification of cells as K14 and/or K19 positive/negative into each sphere (and across each plane); 7) Calculation and output of sphere and cellular statistics (e.g., number, area, fraction of K14/K19 positive, etc.). In the downstream analysis, only spheres with more than 20 cells were selected for processing. The features extracted from the image data were then processed using redundant shRNA activity analysis (RSA), which allows computation of statistical scores that model the probability of a gene 'hit' based on the collective activities of multiple shRNAs per gene36. In particular, the number of spheres and the fraction of K14/K19 double-positive cells present in the spheres or in total cells were selected as biologically meaningful features. The genes were then ranked based on the RSA scores. RSA P values were calculated from the activity of the different shRNAs and the reproducibility of these activities across the multiple shRNAs available for each gene.
Lentiviral vectors, lentivirus production and infection
For human LATS knockdown, the following TRC pLKO clones (Sigma) were used: LATS1A = NM_004690.x-2666s1c1, LATS1B = NM_004690.x-3614s1c1, LATS1+2 = NM_014572.x-2894s1c1, LATS1C = NM_004690.x-4412s1c1 and the MISSION Non-Target shRNA Control Vector SHC002 (shNT). For mouse Lats knockdown, Lats1 = NM_010690.1-878s21c1 and Lats2 = NM_015771.2-660s21c1 were used (both Sigma). For the competition experiment, GFP- and ERα-expressing lentiviral vectors were cloned as described37. Lentiviruses were produced by PEI transfection of 293 T cells as described33,38. The titer of each lentiviral batch was determined on PHBECs, FvB MECs or MCF10A cells. Primary human and mouse cells were infected in suspension for 8 h or overnight, respectively. Cell lines were infected overnight in the presence of hexamethrine bromide (8 µg/mL). Infections were performed at a multiplicity of infection of 5-10 viral particles per cell. Selection with 1.25-1.5 µg/ml puromycin was applied 48 h after infection.
Animal and unsorted MECs experiments
Female SCID/beige and SCID/NOD (Jackson Labs) and FvB mouse colonies were maintained in the animal facility of the Friedrich Miescher Institute for Biomedical Research in accordance with Swiss guidelines on animal experimentation. Experiments were performed in accordance with the Swiss animal welfare ordinance and approved by the cantonal veterinary office of Basel Stadt. For preparations of single mammary cell suspensions, mammary glands were dissected and intra-mammary lymph nodes removed. To obtain mammary organoids, mammary glands were processed as described previously39. To obtain single mammary epithelial cells, organoids were washed in serum-free Leibowitz L15-medium (Gibco) and digested with Hyclone HyQTase (Thermo Scientific). Single cells were washed, filtered through a 40 µm cell strainer (BD Falcon) and counted. Mammosphere cultures were performed as described previously40. Freshly digested MECs were plated at 20,000 cells per ml in 6-well ultra-low attachment plates (Falcon) in DMEM/F12 medium (Gibco) supplemented with 5 µg/ml insulin, 0.5 µg/ml hydrocortisone, 2% B27 (Invitrogen), 20 ng/ml EGF and bFGF (BD Biosciences) and cholera toxin (Sigma), and cultured at 37 ºC in 5% CO2. After 6-7 days, mammospheres were collected, counted, dissociated into single cells using HYQtase (Gibco) and re-seeded. For limiting dilution transplantation, shNT and shLats1+2 second passage spheres were dissociated, resuspended in PBS plus 2% FCS with 25% Basement Membrane Matrix (growth factor reduced; BD, 356230) and injected in 20-ml aliquots into inguinal glands of 3-week-old FVB females that had been cleared of endogenous mammary epithelium. Cells from control and from shLats1+2 spheres were injected in the same animal on opposite sides. After 10 weeks, glands of the recipients were removed, spread on a glass slide and fixed in Carnoy`s fixative overnight. Whole-mount staining with carmine alum was performed as previously described41 and scanned with an Epson 1600 Pro scanner. An outgrowth was defined as an epithelial structure composed of ducts arising from a central point with lobules and/or terminal end buds. Frequencies of mammary-repopulating units between different conditions were calculated and statistically compared using the Extreme Limiting Dilution Analysis (ELDA)42 online tool (http://bioinf.wehi.edu.au/software/elda/). For orthotopic engraftment of breast cancer cell lines, 2 x 10⁶ T47D were suspended in a 100-µl mixture of Basement Membrane Matrix Phenol Red-free (BD Biosciences) and PBS 1:1 and injected into the mouse mammary gland 4 of 6-8 weeks old female SCID/beige and SCID/NOD mice. Mice received estrogen-containing drinking water 2 days prior to injection. Tumor-bearing mice were randomized based on tumor volume prior to the initiation of treatment, which started when average tumor volume was at least 250 mm3. Fulvestrant dissolved in sunflower seed oil (both from Sigma) was injected intraperitoneally as indicated. Tumors were measured every 3-4 days with Vernier calipers and tumor volumes calculated by the formula 0.5 x (larger diameter) x (smaller diameter)2. Mice were sacrificed before the maximal tumor volumes permitted as approved by cantonal veterinary office of Basel Stadt (1500 mm3) were reached.
Cell lines and in vitro experiments
All cell lines were from ATCC and cultured according to their protocols, except for the immortalized but untransformed human breast epithelial cell line MCF10A43 which was maintained as previously described44. Cell line identity was confirmed by sequencing and all cell lines were routinely tested for mycoplasma contaminations. For most experiments, MCF10A were cultured in M5 medium and the medium refreshed or replaced every 3 days. Antibody blocking experiments were performed by adding anti-AREG (R&D, MAB262, 0.5-10 µg/ml) or a mouse IgG antibody (R&D, 10 or 2.5 µg/ml) to the medium prior to seeding of the cells or transferring the conditioned medium. Cell viability was measured using the Cell Proliferation Reagent WST-1 (Roche). Colony formation assays were performed by seeding 500-1’000 cells/well in 6-well plates. Cells were allowed to adhere overnight before treatment with inhibitors or solvent as indicated. Colonies were stained after 6-10 days with 0.2% crystal violet in PBS/4% formalin. Colony area was quantified using the Odyssey scanner and software (LICOR) or Image-J (Fiji 64 bit). For sphere formation assays, 4’000 (passage 1) or 1’000 (subsequent passages) MCF10A cells / ml were grown in ultra-low attachment (ULA) dishes (Corning) for 5-7 days. For LATS1 overexpression experiments, the following plasmids were used (addgene.org): LATS1 wt = p2xFlag CMV2 Lats1 (Plasmid #18971), LATS1 mut/kinase-truncated = p2xFlag CMV2 Lats1-N-mutant (Plasmid #18976) as well as the pFlag CMV2 empty vector control. Cells were transiently transfected using Lipofectamine2000 according to the manufacturer’s protocol (Life Technologies).
Transient gene silencing
siRNAs were ordered as RP-HPLC purified duplexes, Silencer Select, from Invitrogen. The siRNA IDs were the following: siYAP s20366 and s20368, siTAZ s13807 and s13806, siERα s4823 and s4825, Silencer Select negative control siRNA No. 1 AM4611. siRNAs against DCAF1 (L-021119-01-0005) and non-targeting controls (D-001810-10-05) were ordered as on Target-plus SMART pools (Dharmacon). Transfections of siRNAs were performed according to the manufacture’s guidelines (DharmaFect 1, Dharmacon).
Compounds and formulations
For the luminal breast cancer subtype, the most commonly used treatments are fulvestrant and tamoxifen45. Fulvestrant, 4-hydroxytamoxifen (4-OHT), tamoxifen (OHT), cycloheximide and MG132 were from Sigma. Fulvestrant and MG-132 were prepared as a 10 mM stock solutions in DMSO and 4-OHT and cycloheximide at 10 mM in ethanol and stored at -20°C. For in vivo studies, fulvestrant was dissolved in sunflower seed oil (Sigma) and injected intraperitoneal as indicated.
Flow cytometry
For sorting of cells from normal breast tissue, organoids were dissociated with HyQtase (HyClone, Thermo Scientific) for 10 min at 37°C and subsequent pipetting. Cells were filtered twice through 40-µm cell strainers (Falcon) to obtain single cells. 106 cells were blocked in M5 medium for 10 min at 4°C with antibodies against human CD16 (FcRIII, Clone 3G8, 1:50) and CD32 (FcRII, Clone FUN-2, 1:100), then washed and labeled in 100 µl M5 medium for 20 min at 4°C with antibodies against human FITC-CD49f (Clone GoH3, 1:25), PerCP/Cy5.5-CD326 (EpCAM, Clone 9C4, 1:25), APC-cKIT (Clone 104D2, 1:20), PE-CD31 (Clone WM59, 1:33), PE-CD45 (Clone HI30, 1:33), and PE-CD235ab (Clone HIR2, 1:33). DAPI (0.2%, Invitrogen) was added (1:250) 2 min before cell sorting. FACS was carried out with a BD FACSAria III (Becton Dickinson) using a 100-µm nozzle. Single cells were gated based on their forward and side-scatter profiles and pulse-width was used to exclude doublets. Dead cells (DAPI bright) and Lin+ cells (CD31+, CD45+ and CD235+) were gated out. For FACS of in vitro cultured cells and cell lines, cells were detached using trypsin-EDTA (cell lines) or HyQTase (PHBECs), resuspended in growth medium and counted. For intracellular FACS analysis of ERα, cells were fixed and permeabilized using the BD Cytofix/Cytoperm kit according to the manufacturer’s protocol (BD Biosciences, Cat. No. 554714) then incubated with anti-ERα (Thermo / Fisher Scientific, clone SP1, 1:50) overnight at 4°C in the dark, followed by staining with a secondary anti-rabbit IgG-AlexaFluor488 (Biolegend) for 15 min at 4°C in the dark prior to washing and analysis. ALDH1 assays were performed according to the manufacturer’s protocol (Stem Cells Technology). For analysis of surface markers, 106 cells were incubated with APC-cKIT (Clone 104D2, 1:20), FITC-CD326/EpCAM (Clone 9C4, 1:25) or APC-CD10 (Clone HI10a, 1:20) for 20 min at 4°C in the dark. All these antibodies were purchased from BioLegend. For Annexin V / propidium iodide staining, 0.5 x 10⁶ cells were washed with cold PBS/5% BSA, resuspended in 70 µl binding buffer and labelled with phycoerythrin (PE)-labelled antibody against Annexin V according to the manufacturer’s protocol (Becton Dickinson). Ten min prior to analysis, propidium iodide (1 mg/ml, Sigma) was added at a final concentration of 1 µg/ml. For all experiments, at least 104 cells per sample were analyzed with a FACScan flow cytometer BD FACSCalibur or BD LSR II SORP (Becton Dickinson). For sorting of cells from normal mouse mammary epithelium, mammary glands were dissected and intra-mammary lymph nodes removed. To obtain mammary organoids, mammary glands were processed as described previously39. To obtain single mammary epithelial cells, organoids were washed in serum-free Leibowitz L15-medium (Gibco) and digested with Hyclone HyQTase (Thermo Scientific). Single cells were washed and filtered through a 40-mm cell strainer (BD Falcon) and counted; 106 cells per ml were stained with the following antibodies: PE-Cy7-CD45 (Biolegend; clone 30-F11), APC-Sca1 (Biolegend; clone E13-161.7), PerCP-Cy5.5-CD24 (Biolegend; clone M1/69), PE-CD49f (BD-Pharmingen) and DAPI (2 mgml21, Invitrogen). FACS was carried out in a BD FACSAria III (Becton Dickinson) using a 100-mm nozzle. Cells were gated based on their forward and sideward-scatter. Pulse-width was used to exclude doublets. DAPI-negative/ CD45-negative cells were then gated for CD24, Sca1 and CD49f subsets. FACS data were analysed using FlowJo (Tree Star). We used CD24 and Sca1 markers to separate basal (CD24lowSca1negative) and luminal (CD24highSca1negative&positive) compartments39,46 and purity of the fractions was assessed by immunofluorescent staining of cytospun single cells for luminal and basal keratins immediately after sorting.
MECs in vitro colony formation assay and immunofluorescent imaging
Freshly sorted cells of each subpopulation (1000-7500 cells) were plated as previously described41. Seven (luminal cells) or 10 (basal cells) days later, the colonies were fixed with acetone/methanol (1:1), washed, blocked with 2.5% normal goat serum and stained with anti-keratin 8/18 (guinea pig, 1:500, Fitzgerald, 20R-CP004), anti-keratin 14 (rabbit, 1:500, Thermo Scientific, Rb9020), DAPI (2 µg / ml, Invitrogen), anti-guinea-pig Alexa Fluor 488 and anti-rabbit Alexa Fluor 647 (1:500, Invitrogen). Images of stained sections were captured using Yokogawa CellVoyager 7000S (CV7000S) high content screening system with a micro-lens enhanced confocal Nipkow spinning disk CSU-W1 scanner unit (10x magnification, NA=0.4) and a sCMOS camera (2560x2160 pixels). Images were stitched using image J software. Colonies were defined as a cluster of more than five cells. Colonies containing more than 20% of keratin 8/18/keratin 14 double-positive cells were defined as ‘double-positive’.
Immunoblotting, immunoprecipitations and mass spectrometry
Cells for immunoblotting and ELISA were lysed with RIPA buffer (50 mM Tris-HCl pH 8, 150 mM NaCl, 1% NP-40, 0.5% sodium deoxycholate, 0.1% SDS), supplemented with 1 × protease inhibitor cocktail (Complete Mini, Roche), 0.2 mM sodium orthovanadate, 20 mM sodium fluoride, and 1 mM phenylmethylsulfonyl fluoride. For ERα immunoprecipitations, nuclear cell lysates (NE-PER™ Nuclear and Cytoplasmic Extraction Reagents, Pierce, 78833, plus 4M UREA) containing 250-500 µg of protein were incubated with 1 µg of antibody and 20–50 µl of protein A-Sepharose beads (Zymed Laboratories) overnight at 4°C. Whole cell lysates, immunoprecipitates or nuclear cell lysates (30-80 µg) were subjected to SDS-PAGE, transferred to PVDF membranes (Immobilon-P, Millipore), and blocked for 1 h at room temperature with 5% milk in PBS-0.1% Tween 20. Membranes were then incubated overnight with antibodies as indicated and exposed to secondary HRP-coupled anti-mouse or -rabbit antibody at 1:5’000–10’000 for 1 h at room temperature. For each of the blots presented, the results shown are representative of at least three independent experiments. The following antibodies were used: LATS1 (Cell Signaling, 9153 and 3477, 1:1’000), LATS2 (Abcam 1:500), LATS2 (Cell Signaling, 13646, 1:500), ERK2 (Santa Cruz, 1:2’000), pYAP (Ser127, Cell Signaling, 1:1’000), YAP/TAZ (Cell Signaling, 1:1’000), CCND1 (Santa Cruz, sc-718, 1:500), PCNA (Cell Signaling, 1:2’000), c-KIT (Cell Signaling, 1:400), ERα (Thermo / Fisher Scientific, clone SP1, 1:500), ERα (Cell Signaling, 8644, 1:500), keratin 18 (K18, Thermo Scientific, MS-142, 1:1’000), keratin 14 (K14, Thermo Scientific, RB-9020, 1:2’000), keratin 19 (K19, Thermo Scientific, MS-198, 1:1’000), BMI-1 (Millipore, 05-637, 1:500), GFP (MBL, LabForceAG, 598), PARP (Cell Signaling, 1:1’000), phosphor-ERα (Ser 118, Santa Cruz, sc-12915), Mono/Poly-ubiquitin antibody (Enzo Life Sciences, clone FK2, BML-PW8810-0100, 1:1’000), DCAF1 (Novus, NBP1- 05953) and DCAF13 (ab83546).
Quantitative analysis of immunoprecipitates was performed using isobaric tagging with the iTRAQ reagent (Applied Biosystems) as described previously47. Briefly, for each analysis four immunoprecipitates were separated by SDS-PAGE on 4–12% NuPage Gels (Invitrogen). After staining with colloidal Coomassie Blue, the four gel lanes were excised in 16 equally sized slices and in-gel digested with a trypsin/Lys-C mix (Promega). The peptide eluates were labeled with iTRAQ reagent, using a different reagent for each lane. After labeling, peptides from corresponding bands of four lanes were pooled, dried and resuspended for LC-MS analysis. LC-MS was performed using an Orbitrap Elite mass spectrometer equipped with an EasyLC 1000 nanoUPLC system. Peptides were loaded on a 2 cm x 100µm trap column (Thermo Easycolumn) and then separated on a homemade 15 cm x 75µm analytical column filled with Magic 3-µm 100-Å C18 AQ (Michrom, Auburn, CA), using a 60 min gradient from 2 -30% acetonitrile in water with 0.1% formic acid at a flow rate of 250 nl/min. Tandem mass spectra were acquired in a data-dependent manner, in which each full scan was followed by sequential CID and HCD MSMS measurements of up to 10 most intense precursors. Mass spectrometry data were analyzed and quantified using Proteome Discoverer 2.1 (Thermo Scientific) using a human UniProt database (release April 2013). Peptide and protein IDs were filtered at a 1% false discovery rate against a reversed database**.**
Immunofluorescence, microscopy and image analysis of human cells
Cells were fixed with ice-cold methanol/acetone (50/50 v/v) for 10 min at room temperature or with paraformaldehyde (4% in PBS) for 15 min at room temperature. Cells in 3D collagen gels were washed with PBS for 10 min, fixed with 4% paraformaldehyde for 15 min, washed with PBS for 10 min, quenched with 0.15 M glycine for 10 min, and washed again with PBS for 10 min. Then, cells were permeabilized with 0.2% Triton-X-100 for 10 min and washed with PBS for 10 min. Cells and cells in collagen gels were blocked with 10% goat serum (Biozol) in 0.1% BSA. The cells or gels were then incubated at 4°C overnight with the following primary antibodies: keratin 14 (RB-9020, 1:4,000), keratin 18 (MS-142, 1:2’000), keratin 19 (MS-198 1:1’000) (Thermo Scientific) or E-cadherin (BD Bioscience, 610181, 1:200). Goat anti-mouse, goat anti-rabbit or goat anti-guinea pig secondary antibodies coupled to Alexa 488, 568 or 633 (Molecular Probes, Invitrogen 1:500) were used for detection. Cell nuclei were stained with 167 ng/ml DAPI (Sigma) for 10 min. For phase-contrast and fluorescence imaging of cells, images were acquired with an inverted microscope (Nikon Eclipse Ti) using a 10× lens (Nikon Plan Fluor, NA 0.3) and a Nikon Ds-Fi camera. Immunofluorescent staining was analyzed with a Zeiss Z1 inverted microscope using a 20× air lens (Zeiss Plan-APOCHROME, NA 0.8) equipped with a motorized Zeiss scanning stage. Axiovision software was used to acquire and stitch images. Confocal images were captured with a LSM-510 confocal microscope (Zeiss) using a 20× air lens (Zeiss Plan-APOCHROME, NA 0.8). Both Zeiss microscopes were equipped with an Axio Cam MRC CCD (6.45 micron). Percentages of covered area in each color channel (PHBEC colony formation) and percentages of positive cells (MCF10A colony formation) were quantified using Image-J (Fiji (64 bit)) software.
Immunohistochemistry
Normal tissue was fixed in 10% NBF (neutral buffered formalin) for 24 h at 4°C, washed with 70% EtOH, embedded in paraffin, and 3-µm sections prepared and processed for hematoxylin and eosin staining and immunohistochemistry. Immunohistochemical staining was performed on formalin-fixed, paraffin-embedded tissue sections using a Bond-maX (Leica) fully automated system with anti-LATS1 (Sigma, HPA031804, 1:20).
Tissue microarrays (TMAs) of primary breast cancer tissue samples from a total of 984 breast cancer patients were selected for this study. The construction of the TMAs and the clinicopathological characteristics of the patient cohort were described before48,49. The cohort comprises samples from the Institute of Surgical Pathology of the University Hospital Zürich that were collected between 1991 and 2011. Clinical data, tumor stage, at least 5 years of follow-up and histopathological parameters such as histological grading, hormone receptor and HER2 status were available for all patients. Presence of local or distant recurrence were available for most patients. Of the 984 primary breast cancer cases on the TMAs, 471 could be interpreted and were available for analysis. Two TMAs were used for this study. The first TMA (ZTMA 21) contained 640 single cores from all three subtypes, which were collected from 1991 to 2004. The second TMA (ZTMA 27) contained 344 single cores, which were collected from 1995 to 2004. This retrospective study on human tissue samples was approved by the Cantonal Ethics Committee of Zurich (KEK-2012-553). Informed consent was not necessary, as the ethical approval completely covered all issues of this retrospective study, and the samples were completely anonymized and de-identified prior to the study. Immunohistochemistry on 4-µm TMA sections was performed using an automated immunohistochemistry platform from Bond (Vision Biosystems, Melbourne, Australia). A rabbit anti-human polyclonal LATS1 antibody (SIGMA, HPA031804) was used at a dilution of 1:50 and pretreatment with CC1 for 44 min. ERα-indices of the cores were calculated by multiplying ERα quantity (0-100%) by ERα intensity (0-3) and cores were grouped into samples with cytoplasmic or nuclear/mixed staining of LATS1.
Gene expression profiles
Total RNA was extracted using the RNeasy Mini Kit according to the manufacturer’s protocol (Qiagen), 100 ng were processed with the Ambion WT Expression Kit (Thermo Fischer Scientific) and 2.75 µg of the resulting cDNA were fragmented and labeled with the Affymetrix GeneChip WT Terminal Labeling and Hybridization kit (Affymetrix). Following hybridization, non-specifically bound nucleotides were removed by washing and specifically bound target detected using a GeneChip Hybridization, Wash and Stain kit and a GeneChip Fluidics Station 450 (Affymetrix). Hybridization was carried out with 2.5 µg of biotinylated target, which was incubated with a GeneChip human Gene 1.0 ST Array (Affymetrix) at 45°C for 16 h. The arrays were scanned using a GeneChip Scanner 3000 7G (Affymetrix) and CEL files acquired using GeneChip Command Console Software (Affymetrix). Arrays were normalized and probeset-level expression values calculated with R/Bioconductor's (v2.15.3/v2.11) 'affy' package using the rma function (www.bioconductor.org). Only probesets being annotated with an Entrez Gene according to the hugene10sttranscriptcluster package were selected using the ‘featureFilter’ function of the genefilter package. Whenever more than one probeset mapped to the same Entrez Gene ID, only the one with the highest IQR was considered. Differential gene expression was determined using linear modeling implemented in the R/Bioconductor package ‘limma’. For general analysis, a cutoff of a linear fold change >= 2 and adjusted P value of =<0.01 (corrected with the Benjamini Hochberg algorithm method) was used. GSEA was performed using the JAVA application from the Broad Institute v2.0 (http://www.broadinstitute.org/gsea). Heatmaps show selected luminal progenitor, mature luminal and basal markers according to (Lim et al., 2010; Shehata et al., 2012; Skibinski et al., 2014).
For analysis of the TCGA data, human breast cancer expression data and corresponding clinical data50 were obtained from https://tcga-data.nci.nih.gov/docs/publications/brca_2012/, corresponding to the November 11, 2011 data freeze that contains 522 tumor samples with clinical annotation. Only genes with an unambiguous association to an ENTREZ gene identifier were used (Bioconductor package org.Hs.eg.db). If multiple microarray probesets were associated to a single gene, an arbitrary one was selected to avoid redundant use of data, resulting in a total number of 18073 genes included in the analysis. Heatmap and clustering of the combined expression data was performed using the function aheatmap() from the R package "NMF"51 on the top 1000 genes ranked by variance across human samples. Samples were compared to human PAM50 tumor subtypes (Normal, LumA, LumB, Her2 and Basal) by calculating Pearson's correlation coefficients of each mouse sample against the averages of all human samples within each subtype. The microarray data from this publication are accessible through http://www.ncbi.nlm.nih.gov/geo/query/acc.cgi?token=kvaxkgywlxgxhax&acc=GSE61297 and http://www.ncbi.nlm.nih.gov/geo/query/acc.cgi?tadrianoken=ifspyeuozlkdlyz&acc=GSE80055.
Integrated System for Motif Activity Response Analysis (ISMARA)
The ISMARA model21 combines knowledge of gene expression levels (measured by microarray) with transcription factor binding sites to answer the question of which transcription factors are driving expression changes. Specifically, log expression levels of all genes present on the microarray were modeled as linear combinations of transcription factor activities. The coefficients of these combinations were determined by the number of transcription-factor binding sites in the proximal promoter regions. For each transcription-factor binding motif m and each sample (microarray) s, the activity Ams with the corresponding error, as well as the significance of activity change of each binding motif were calculated.
RNA preparation and RQ-PCR
Total RNA was extracted using the RNeasy Mini Kit according to the manufacturer’s protocol (Qiagen). One µg of total RNA was transcribed using the Thermo Script RT-PCR System from Invitrogen. PCR and fluorescence detection were performed using the StepOnePlus Sequence Detection System (Applied Biosystems) according to the manufacturer’s protocol in a reaction volume of 20 µl containing 1x TaqMan Universal PCR Master Mix (Applied Biosystems) and 25 ng cDNA. The following probes were used: 1x Taqman Gene Expression Assays (Applied Biosystems) for quantification of GAPDH (Hs02758991_g1), RPLP0 (Hs99999902_m1), CTGF (Hs01026927_g1), Cyr61 (Hs00998500_g1), ESR1 (Hs01046818_m1), c-KIT (Hs00174029_m1), GREB1 (Hs00536409_m1), TFF1 (Hs00907239_m1), PGR (Hs01556702_m1), PRLR (Hs01061477_m1), AREG (Hs00950669_m1), Hprt Mm00446968_m1, Axin2 Mm00443610_m1, Krt14 Mm00516879_m1, Lgr5 Mm00438890_m1, Vim Mm01333430_m1, Krt8 Mm00835759_m1, Krt18 Mm01601702_g1, Gata3 Mm00484683_m1, Elf5 Mm00468732_m1, Esr1 Mm00433149_m1, Pgr Mm00435628_m1, Acta2 Mm01546133_m1, Areg Mm00437583_m1, Procr Mm00440992_m1 and Cd44 Mm01277163_m1. Further, 1x IDT (Integrated DNA technologies) assays were used for quantification of: E-cadherin (Hs.PT.58.3324071), VIM (Hs.PT.58. 38906895), N-cadherin (Hs.PT.58.26024443), fibronectin (FN) (Hs.PT.58.21141138), K18 (Hs.PT.58.38957843g), K19 (Hs.PT.58.3407073), ALDH1A3 (Hs.PT.56a.39201385), K14 (Hs.PT.58.39764207.g), CD10 (Hs.PT.58.38513876.g), ACTA2 (αSMA) (Hs.PT.56a.39662523), Cd61 (Mm.PT.5811401536), c-kit (Mm.PT.56a.33701407), Cd24 (Mm.PT.58.13419747), Ctgf (Mm.PT.58.10039559.gs), Cyr61 (Mm.PT.58.10039559.gs), Lats1 (Mm.PT.58.6017004) and Lats2 (Mm.PT.58.11908933). All measurements were performed in duplicate and the arithmetic mean of the Ct-values used for calculations: target gene mean Ct-values were normalized to the respective housekeeping genes (GAPDH, RPLP0 and Hprt), mean Ct-values (internal reference gene, Ct), and then to the experimental control. The values obtained were exponentiated 2(-ΔΔCt) to be expressed as _n_-fold changes in regulation compared with the experimental control (2(-ΔΔCt) method of relative quantification52.
Statistical analysis
Each value reported represents the mean ± standard deviation (s.d.) of at least three independent biological or experimental replicates. Biological replicates (br) are different donors (e.g., PHBEC1, 2, 3) or cell models (MCF10As, PHBECs, MECs) or mice. Experimental replicates (er) are either independent experiments or individually treated cells (e.g., with compounds, siRNA). Technical replicates (tr) are tests or assays run on the same sample multiple times. Data were tested for normal distribution and Student’s t-tests (if normally distributed) or nonparametric Mann–Whitney U / Wilcoxon-tests were applied unless stated otherwise. To account for multiple comparisons, Tukey HSD and Wilcoxon tests were performed and adjusted P-values are provided. The programs JMP4, JMP9 (SAS, Cary, NC, USA) and SPSS (IBM SPSS Statistics for Windows, Version 19.0. Armonk, NY: IBM Corp) were used for all statistical tests. P <0.05 was considered to be statistically significant.
Extended Data
Extended Data Figure 1. Inhibition of LATS increases sphere formation and the fractions of progenitor and luminal cells.
a, Outline of the screen to assess effects of the inhibition of tumor suppressor genes on PHBEC cell fate. b, Representative immunofluorescence images of PHBEC shNT, shLATS1 and shLATS2 spheres stained for K14 (red) and K19 (green). Scale bars = 50 µm. c, Upper panel: Bar graphs showing fractions of K14+/K19+ (left axis) and curve showing the ratio of K19+ to K14+ (right axis) cells upon inhibition of tumor suppressor genes; the top 50 individual shRNAs are shown. shRNAs targeting components of the Hippo-pathway are indicated by red arrows. Lower panel: Bar graphs representing fractions of K14+, K19+ and K14+K19+ positive cells in spheres. Data are means ± s.d. (n = 5 single shRNAs, 4 er), *P<0.05. d, Inhibition of Lats increases sphere formation in mouse primary mammary epithelial cells (MECs). Immunoblots (upper panel) and bar graph (lower panel) showing sphere formation of shNT and shLats cells. Data are means ± s.d. (n = 25 pooled mice, 6 er), *P<0.05. e, Representative immunofluorescence images of PHBEC shNT and shLATS1+2 colonies stained for K14 (red) and K19 (green). Scale bars = 150 µm. f, Knockdown of LATS enhances sphere formation in MCF10A cells. Immunoblots (left panel) and bar graph (right panel) showing sphere formation of shNT and shLATS cells cultured in M5 medium. Data are means ± s.d. (n = 6 er), *P <0.05, **P <0.01. g, The fraction of K14+ basal cells decreases while the fractions of K18+ luminal and K14+/K18+ progenitor cells increase upon removal of LATS. Representative immunofluorescent images of MCF10A shNT and shLATS colonies stained for K14 and K18 (left panel) and corresponding quantification (right panel). Data are means ± s.d. (n = 6 er), *P <0.05, **P <0.01. Scale bars = 150 µm. h, LATS knockdown increases K19 and decreases K14 mRNA expression in PHBECs and MCF10A cells. Bar graphs showing RQ-PCR analysis of shNT and shLATS. Data are means ± s.d. (n = 3 br each 2 er for PHBECs and 6 er for MCF10As) *P <0.05, **P <0.01. i, Re-expression of wt LATS1 rescues the effects of the knockdown in MCF10A cells. Immunoblots (left panel), representative immunofluorescence pictures (middle panel), and corresponding quantification of shNT and shLATS1C (targeting the 3´UTR) cells which were transfected with either a ctrl or a LATS1 wt cDNA expressing vectors. Data are means ± s.d. (n = 6 er). Scale bars = 200 µm.
Extended Data Figure 2. Inhibition of LATS promotes a luminal phenotype.
a, Heat map derived from hierarchical clustering of the 182 differentially expressed genes between shNT PHBECs (n = 5) and shLATS PHBECs (n = 6). Cut-off: Adjusted _P_-value <0.01, fold change >2.0, expression values >4. Arrows indicate canonical luminal genes as well as LATS1. b, Principal component analysis (PCA) of microarrays performed on shNT and shLATS PHBECs. shNT samples cluster separately from both shLATS1B and shLATS1+2 samples. c, Venn diagram analysis of differentially regulated genes at a low stringency cut-off of P <0.05, 2.0-fold change, expression values >4.0. Both LATS shRNAs show a high degree of overlap when compared to shNT samples and no genes were significantly differentially regulated between the two shRNAs. d, PHBEC shLATS expression profiles are significantly enriched in genes that are downregulated in normal basal breast cells. GSEA with shLATS-specific genes and a gene set of normal basal / stem breast cells. shNT PHBECs (n = 5), shLATS PHBECs (n = 6). Normalized enrichment score (NES) = 2.5, false discovery rate (FDR) <0.0001, P <0.0001. e, shLATS PHBECs express low levels of basal genes. Heatmaps with average normalized expression values of a subset of genes associated with normal basal breast cells. f, Removal of LATS imposes a luminal breast cancer signature to PHBECs. Left panel: GSEA with shLATS-specific genes derived from PHBECs and gene sets of ERα-positive (left) and luminal breast cancer samples (right). shNT PHBECs (n = 5), shLATS PHBECs (n = 6). NES = 2.29 (left) and 1.98 (right), FDR <0.0001, P <0.0001. Right panel: Clustered heatmap showing correlation coefficients between human breast cancer profiles and shNT or shLATS PHBECs. g, Graphs of ISMARA transcription factor activity analysis of shLATS (n = 6) versus shNT (n = 5) PHBECs showing high activity upon removal of LATS for CEBPβ (Z-value = 1.92, P <0.0001) and STAT5A,B (Z-value = 2.184, P <0.01). h, Bar graphs showing RQ-PCR analysis of shNT and shLATS PHBECs. mRNA levels of ERα and c-KIT as well as several canonical ERα target genes are higher in shLATS PHBECs. Data are means ± S.D. (n = 6 er, 2 tr), *P <0.05, **P <0.01. i, Bar graphs representing FACS analysis of PHBECs with LATS knockdown. Markers of luminal progenitors (c-KIT, ALDH activity) and luminal epithelial (EpCAM) cells increased and expression of the basal marker CD10 was reduced upon removal of LATS. Data are means ± s.d. (n = 6 er), *P <0.05.
Extended Data Figure 3. YAP/TAZ are stabilized in shLATS cells but do not impose their canonical signature.
a, YAP/TAZ signaling increases upon removal of LATS. Immunoblots (left panel) and RQ-PCR analysis (right panel) of shNT and shLATS PHBECs. Data are means ± s.d. (n = 6 er), *P <0.05. b, GSEA analysis of the shLATS profiles with datasets in which YAP was overexpressed (left and middle panel) or with a YAP/TAZ gene set derived from reactome.org (right panel). Left panel: NES = 0.84, FDR = 0.726, P = 0.726; middle panel: NES = 0.91, FDR = 0.58, P = 0.58; right panel: NES = 0.1.17, FDR = 0.251, P = 0.251. There was no enrichment of the shLATS PHBEC profile with the published YAP- or YAP/TAZ-driven gene set.
Extended Data Figure 4. LATS-depleted MCF10A cells recapitulate the phenotype of LATS-depleted PHBECs.
a, MCF10A cells lacking LATS are enriched for luminal gene signatures but not for YAP/TAZ-driven gene signatures. GSEA with shLATS MCF10A-specific genes and gene sets of PHBECs lacking LATS (left), luminal progenitor (middle) and mature luminal breast cells (right). Results from enrichment analyses with YAP/TAZ driven gene sets are shown in the table on the right. b, Markers of mature luminal and luminal progenitor cells increased upon removal of LATS, and canonical YAP/TAZ signaling was activated. Immunoblots of lysates (left panel) and bar graphs showing RQ-PCR measurements (middle), and FACS analysis (right) of MCF10A shNT and shLATS cells cultured in standard growth medium (Std) or M5 medium for 4 days. Data are means ± s.d. (n = 6 er, 2 tr), *P <0.05, **P <0.01. c, Left: Representative microscopic bright-field pictures of shNT and shLATS MCF10A cells cultured in M5 medium showing a switch to a cobblestone-like cell morphology in shLATS cells. Scale bars = 150 µm. Right: Bar graphs showing RQ-PCR analysis of MCF10A shNT and shLATS cells. Luminal markers are upregulated, mesenchymal markers are downregulated in MCF10A shLATS cells. Data are means ± s.d. (n = 6 er, 2 tr), *P <0.05.
Extended Data Figure 5. YAP/TAZ and ERα–signaling promote sphere formation and breast luminal phenotype in LATS-depleted cells via intrinsic and paracrine mechanisms.
a, Cells with enforced expression of both YAP/TAZ and ERα phenocopy shLATS cells. Left panel: Immunoblots of shNT, shNT with enforced YAP/TAZ and/or ERα expression and shLATS MCF10A cells. PCA plots (middle) and heat map (right) derived from hierarchical clustering of the differentially expressed genes between shNT, shNT YAP/TAZ, shNT ERα, shNT ERα/YAP/TAZ, shLATS1B and shLATS1+2 MCF10A cells (n = 3 er). Cut-off: Adjusted _P_-value <0.01, fold change >2.0, expression values >4. b, Table with GSEA showing that cells with exogenous YAP/TAZ expression are enriched for YAP/TAZ signatures. c, Immunoblots representing siRNA-mediated depletion of YAP/TAZ in MCF10A shNT and shLATS cells (left panel). Inhibition of YAP/TAZ only partially blocks the induction of luminal markers (RQ-PCR, right panel), but reverts enhanced sphere formation upon LATS knockdown (bar graphs, middle panel). Data are means ± s.d. (n = 8 er), *P <0.05. d, Immunoblots representing siRNA-mediated depletion of ERα in MCF10A shNT and shLATS cells (left panel). Inhibition of ERα blocks the induction of luminal markers (RQ-PCR, right panel) but only slightly reduces the enhanced sphere formation seen upon LATS knockdown (middle panel). Data are means ± s.d. (n = 8 er), *P <0.05. e, Inhibition of ERα by 1 µM 4-Hydroxytamoxifen (4-OHT) in PHBECs blocks the induction of luminal markers (RQ-PCR, left panel) but only slightly reduces the enhanced sphere formation seen upon LATS knockdown (right panel). Data are means ± s.d. (left panel n = 3 er, 2 tr; right panel n = 6 er). f, Immunoblots of MCF10A shNT and shLATS cells in which YAP, TAZ and ERα were depleted by siRNA. g, YAP/TAZ and ERα interact in the upregulation of AREG in cells lacking LATS. Left panel: Bar graphs showing ELISA measurements in PHBECs and MCF10A shNT and shLATS cells. Data are means ± s.d. (n = 8 er), *P <0.05. Right panel: Bar graphs representing RQ-PCR results for MCF10A shNT and shLATS cells in which YAP/TAZ and/or ERα were depleted by siRNA. Data are means ± s.d. (n = 6 er, 2 tr), *P <0.05. h, Left panel: Graphs representing sphere formation of shNT and shLATS MCF10A cells upon addition of increasing amounts of an AREG-blocking antibody (AB) or an IgG control. Data are means (n = 6 er), IC50 values shNT = 8.2 µg, shLATS1 = 4.4 µg (P <0.05), shLATS_2 = 2.6 µg (P <0.05), shLATS_3 = 2.7 µg (P <0.05). Right panel: Bar graphs showing sphere formation of MCF10A cells supplemented with conditioned medium derived from either shNT or shLATS MCF10A 3D cultures. Addition of anti-AREG blocking antibody (2.5 µg/ml) reverted the increase in sphere formation capacity conferred by conditioned medium from shLATS cultures. Data are means ± s.d. (n = 6 er), *P <0.05. i, Graphical summary.
Extended Data Figure 6. Removal of LATS increases proliferation and favors survival of ERα-positive cells.
a, Knockdown of LATS induces markers of proliferation (immunoblots, upper panel) and increases cell numbers of PHBECs (cell counts, lower panel). Data are means ± s.d. (n = 5 er, 2 tr), *P <0.05, **P <0.01. b, Ablation of LATS increases colony forming capacity of PHBECs. Bar graphs representing colony counts of PHBECs in which LATS was knocked down. Data are means ± s.d. (n = 8 er), *P <0.05. c, Knockdown of LATS increases the expression of markers of proliferation. Immunoblots of MCF10A cells with or without LATS cultured in M5 medium. d, Knockdown of LATS increases cell number. Graph representing cell counts of MCF10A shNT and shLATS cells cultured in M5 medium. Data are means (n = 8 er), *P <0.05, **P <0.01. e, shLATS cells in suspension retain high levels of YAP/TAZ and are partially anoikis-resistant. Immunoblots of MCF10A shNT and shLATS cells cultured in suspension for the indicated time points (left panel). Bar graph representing FACS analysis of AnnexinV+/PI+ MCF10A cells after 36 h of suspension culture (right panel). Data are means ± s.d. (n = 8 er), *P <0.05. f, Removal of LATS results in a survival advantage for ERα+ cells. Scheme of the setup of the competition experiment (left panel). Immunoblots of lysates from MCF10A shNT and shLATS cells after lentiviral infection with GFP and ERα or the empty vector control at the beginning of the experiment. MOIs for ERα were adjusted between shNT and shLATS cell lines to assure equal expression of ERα (middle panel). Bar graphs representing FACS analysis of GFP+ cells after 5 days of suspension culture (right panel). Data are means ± s.d. (n = 6 er), *P <0.05, **P <0.01. g, Inhibition of YAP/TAZ partially reverts the competitive advantage of ERα+ shLATS cells. The experimental setup was as in f, but in addition YAP/TAZ were inhibited by siRNA. Immunoblots of lysates of MCF10A shNT and shLATS cells at the beginning of the experiment, infected with GFP and ERα, and transfected with siRNAs against YAP/TAZ, and a non-targeting control (left panel). Bar graph of FACS analysis of GFP+ cells after 5 days of suspension culture (right panel). Data are means ± s.d. (n = 6 er), *P <0.05.
Extended Data Figure 7. Removal of LATS increases the luminal progenitor and mature luminal cell phenotype.
a, LATS is mostly nuclear in basal cells and cytoplasmic in luminal cells. Representative pictures of LATS1 staining (IHC) in normal human breast (left, scale bars = 100 µm), of PHBECs stained (IF) with K19, K14 and LATS1 (middle, scale bars = 150 µm), and of a human breast tumor TMA (right). Bar graphs showing quantification of LATS nuclear and cytoplasmic staining by IF on PHBECs (middle). Data are means ± s.d. (n = 8), *P<0.05. Box plots representing ERα-index of tumors characterized by cytoplasmic or nuclear LATS IHC staining (right). n = 471, P<0.0001. b, Bar graphs showing RQ-PCR analysis of sorted PHBEC subpopulations (n-fold over Stroma and mesenchymal cells (MSC)). Luminal markers are shown in blue, basal markers are shown in red. Data are means ± s.d. (n = 2 br with each 3 er). c, The fractions of mature luminal and luminal progenitor cells increase upon removal of LATS. Left panel: Representative scatter plots of cell-surface / intracellular FACS analysis of PHBECs shNT and shLATS stained with antibodies against c-KIT and ERα. Right panel: Bar graphs showing FACS analysis of shNT and shLATS PHBECs stained with antibodies against c-KIT and ERα. Data are means ± s.d. (n = 2 br with each 3 er), *P <0.05. d, Representative immunofluorescence pictures of colonies formed by breast cell subpopulations. Scale bars = 150 µm. e, YAP/TAZ targets are highly expressed in basal cells. Bar graphs showing RQ-PCR analysis of sorted basal and c-KIT-positive luminal progenitor cells. Data are means ± s.d. (n = 2 br with each 3 er), *P <0.05. f, Sorted basal primary mouse mammary epithelial cells (MECs) acquire a luminal phenotype upon removal of Lats and removal of Lats enhances the luminal phenotype in sorted luminal MECs. Representative immunofluorescent pictures (left) and quantification of the colony phenotype of sorted basal (upper panel) and luminal (lower panel) MECs with and without Lats1 and 2 stained for K14 and K8/18. n = 20 pooled mice, basal shNT n = 46 colonies, basal shLats n = 23 colonies, luminal shNT n = 30 colonies, luminal shLats n = 20 colonies. Scale bars = 200 µm. g, Depletion of Lats in sorted primary MECs increases luminal mature and progenitor markers and decreases basal and mammary stem cell-related markers. Bar graphs showing RQ-PCR analysis, data are means ± s.d. (n = 20 mice pooled, 6 er). h, Cells lacking LATS exhibit a luminal progenitor-like phenotype when grown in 3D collagen gels. Left panel: Representative pictures of TDLU- and sphere-like structures formed by PHBECs on floating collagen. Scale bars = 200 µm. Right panel: Representative immunofluorescence confocal pictures of 3D structures formed by shNT and shLATS PHBECs grown on floating collagen gels, stained for basal (K14) and luminal (K18, E-cadherin) markers. Scale bar = 200 µm. i, Depletion of Lats in primary mouse mammary epithelial cells (MECs) increases luminal mature and progenitor markers and decreases basal and mammary stem cell-related markers. Bar graphs showing RQ-PCR analysis, data are means ± s.d. (n = 25 mice pooled, 6 er), *P <0.05. j, Graphical summary. Depletion of LATS expands luminal and bipotent progenitors and enhances differentiation along the luminal lineage at the expense of basal progenitors and basal cells. This results in a population of cells with high sphere forming capacity, low mammary repopulating activity, and a luminal phenotype.
Extended Data Figure 8. Removal of LATS stabilizes ERα protein.
a, Knockdown of LATS upregulates ERα in luminal breast cancer cells. Immunoblots of lysates of T47D shNT and shLATS cells treated for 6 h with 10 nM estrogen (E2) or ethanol (EtOH). b, Knockdown of LATS upregulates ERα target genes in luminal breast cancer cells. Bar graphs showing RQ-PCR analysis (right panel) of T47D shNT and shLATS cells treated as in (a). Data are means ± s.d. (n = 6 er), *P <0.05. c, Re-expression of the kinase-dead LATS1 mut almost fully rescues ERα-mediated effects of the knockdown in MCF10A cells, but not YAP/TAZ-mediated effects. Immunoblots (upper left panel), bar graphs representing sphere formation (upper right panel) and bar graphs showing RQ-PCR analysis of MCF10A cells with or without LATS cDNAs expressing LATS1 wt or mut sequences. Data are means ± s.d. (n = 6 er), *P <0.05. d, The ERα protein is stabilized in cells lacking LATS. Immunoblots of lysates from T47D shNT and shLATS cells that were treated with 10 µM of the protein translation inhibitor cycloheximide (CHX) and 10 nM of estrogen (E2) for 6 h. Quantification of ERα levels, normalized to loading controls ERK2 and β-ACTIN and expressed relative to the timepoint = 0, is provided as bar graphs below the immunoblots. Data are means ± s.d. (n = 6 er), *P <0.05. e, LATS1 triggers proteasome-dependent downregulation of ERα protein. Immunoblots of lysates from BT474 and MCF7 cells transfected with LATS1 wt cDNA and treated with 20 µM of the proteasome inhibitor MG132 for 6 h. f, Ubiquitination of ERα is reduced in shLATS cells. Immunoblots of MCF7 shNT and shLATS cell lysates subjected to ERα immunoprecipitation and immunoblotting for ubiquitin and ERα (IP: immunoprecipitation, WCL: whole cell lysate). g, LATS1-mediated ubiquitination of ERα is dependent on DCAF1. Immunoblots of lysates from MCF7 cells transfected with LATS1 wt cDNA and siDCAF1 which were subjected to ERα immunoprecipitation and immunoblotting for ubiquitin and ERα (IP: immunoprecipitation, WCL: whole cell lysate).
Extended Data Figure 9. LATS ablation reduces the efficacy of fulvestrant treatment.
a, LATS is downregulated in the majority of human breast cancer samples and cell lines. Immunoblots of PHBECs and primary human breast cancer samples (upper panel), MCF10A cells as well as basal (lower left panel) and luminal (lower right panel) breast cancer cell lines. b, shLATS reduces sensitivity to fulvestrant by preventing ERα degradation. Graphs showing colony areas of T47D (upper panel) and of MCF7 (lower panel) shNT and shLATS cell lines in response to fulvestrant and tamoxifen treatment. Data are means ± s.d. (n = 9 er), *P <0.05. c, shLATS tumors are partially resistant to fulvestrant. Tumor growth curves of T47D shNT- and shLATS-bearing animals treated with 2.5mg/25g of fulvestrant as indicated. Data are means ± s.d. (n = 5 br), *P <0.05. d, Low LATS expression is associated with poor outcome in patients treated with anti-estrogens but not in the tamoxifen-only treated subgroup. Kaplan-Meier analysis of relapse-free survival of n = 643 (left), n = 346 (middle), n = 489 (right) breast cancer patients.
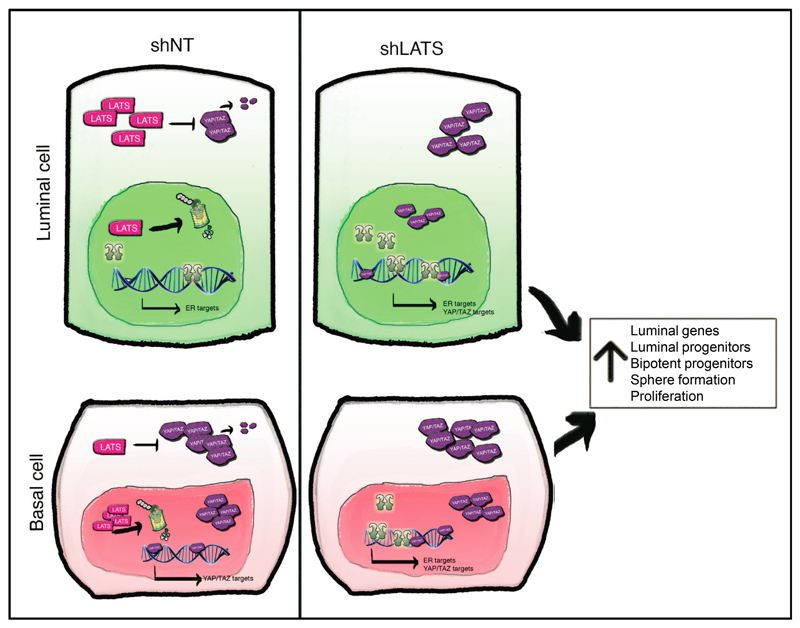
Extended Data Figure 10. Graphical Summary.
Effects of LATS in luminal and basal cells. In luminal cells, LATS is highly expressed in the cytoplasm, where it triggers YAP/TAZ degradation. These cells express high levels of ERα and its target genes. In basal cells, LATS is highly expressed in the nucleus, allowing YAP/TAZ accumulation in the cytoplasm and their translocation to the nucleus, where they activate their targets. Upon depletion of LATS, YAP/TAZ are upregulated in luminal cells with the net results that both ERα and YAP/TAZ target genes are being transcribed. In basal cells, removal of LATS results in stabilization of ERα and the transcription of ERα target genes in addition to the already highly expressed YAP/TAZ target genes. Overall, this results in a cell population characterized by increases in the levels of luminal genes, in the number of luminal and bipotent progenitors, in sphere formation, and proliferation.
Supplementary Material
Supplementary Tables
Supplementary Table Legends
Acknowledgments
We thank members of the Bentires-Alj laboratory for advice and discussions. Patrick Ringenbach, Sylvie Thiebault, and Veronique Lindner (Centre Hospitalier de Mulhouse, Emile Muller) provided mammary tissue. We were supported by FMI and GNF facilities: Stephane Thiry for microarray hybridizations, Hubertus Kohler for FACS analysis, Sandra Bichet for histology, Laurent Gelmant, Raphael Thierry, Katrin Volkmann and Steven Bourke for imaging, Angelica Romero for lentiviral preparations, Buu Tu for automation of the screen, as well as Karina Drumm for animal studies. We thank Thomas Radimerski, Andreas Bauer, Tobias Schmelzle, and Mathias Frederiksen (Novartis) for discussions and reagents. Research in the lab of M.B-A. is supported by the Novartis Research Foundation, the European Research Council, the Swiss National Science Foundation, the Krebsliga Beider Basel, the Swiss Cancer League, the Department of Surgery of the University Hospital of Basel, and the Swiss Initiative for Systems Biology (SystemsX.ch).
Footnotes
The GEO accession numbers for the microarray data reported are GSE61297 and GSE80055.
Author Contributions
A.B., S.D., and S.K. conceived the study, designed and performed experiments, analyzed the data, interpreted the results and wrote the manuscript. J.P.C. performed PHBECs and MECs FACS and imaging, lentiviral infection, cell culture, limiting dilution transplantations, analyzed the data and interpreted the results. H.B. performed IHC and IF experiments, analyzed the data and interpreted the results. D.D.S. and S.K. performed MECs FACS, cell culture, IF and limiting dilution transplantations. K.D.M., D.K. and Z.V. performed and analyzed experiments on archived human breast cancer samples. H.V., A.V. and C.L. performed IP and mass spectrometry experiments and analyzed the data. T.R. and M.B.S. performed microarray data analysis. C.H.S. interpreted 3D collagen assay experiments. G.M.C.B. imaged and analyzed the 3D images data and the resulting screen data. L.J.M. and A.P.O. contributed to the shRNA screen experiment and analysis. V.A.R. conceived the study, designed the experiments, interpreted the results, and revised the manuscript. M.B.A. conceived the study, designed the experiments, interpreted the results, and wrote the manuscript. All authors read and approved the final manuscript.
Competing financial interests
J.P.C, D.D.S., K.D.M., D.K., Z.V., T.R., M.B.S., S.K., C.H.S. and M.B.-A. declare no competing financial interests. A.B., S.D., and H.B. are employees of Roche Pharma AG. S.K. is an employee of Amgen. H.V., A.V., L.M., A.P.O. and G.M.C.B. are employees of Novartis Pharma AG. C.L. is an employee of Actelion. V.A.R. is a full-time employee of Pfizer.
References
- 1.Derynck R, Akhurst RJ. Differentiation plasticity regulated by TGF-beta family proteins in development and disease. Nature cell biology. 2007;9:1000–1004. doi: 10.1038/ncb434. [DOI] [PubMed] [Google Scholar]
- 2.Tong Q, Hotamisligil GS. Developmental biology: cell fate in the mammary gland. Nature. 2007;445:724–726. doi: 10.1038/445724a. [DOI] [PubMed] [Google Scholar]
- 3.Howard BA, Gusterson BA. Human breast development. Journal of mammary gland biology and neoplasia. 2000;5:119–137. doi: 10.1023/a:1026487120779. [DOI] [PubMed] [Google Scholar]
- 4.Petersen OW, Polyak K. Stem cells in the human breast. Cold Spring Harbor perspectives in biology. 2010;2:a003160. doi: 10.1101/cshperspect.a003160. [DOI] [PMC free article] [PubMed] [Google Scholar]
- 5.Halder G, Johnson RL. Hippo signaling: growth control and beyond. Development. 2011;138:9–22. doi: 10.1242/dev.045500. [DOI] [PMC free article] [PubMed] [Google Scholar]
- 6.Zhao B, Li L, Lei Q, Guan KL. The Hippo-YAP pathway in organ size control and tumorigenesis: an updated version. Genes & development. 2010;24:862–874. doi: 10.1101/gad.1909210. [DOI] [PMC free article] [PubMed] [Google Scholar]
- 7.Shaw FL, et al. A detailed mammosphere assay protocol for the quantification of breast stem cell activity. Journal of mammary gland biology and neoplasia. 2012;17:111–117. doi: 10.1007/s10911-012-9255-3. [DOI] [PubMed] [Google Scholar]
- 8.Villadsen R, et al. Evidence for a stem cell hierarchy in the adult human breast. The Journal of cell biology. 2007;177:87–101. doi: 10.1083/jcb.200611114. [DOI] [PMC free article] [PubMed] [Google Scholar]
- 9.Lim E, et al. Aberrant luminal progenitors as the candidate target population for basal tumor development in BRCA1 mutation carriers. Nature medicine. 2009;15:907–913. doi: 10.1038/nm.2000. [DOI] [PubMed] [Google Scholar]
- 10.Santagata S, et al. Taxonomy of breast cancer based on normal cell phenotype predicts outcome. The Journal of clinical investigation. 2014;124:859–870. doi: 10.1172/JCI70941. [DOI] [PMC free article] [PubMed] [Google Scholar]
- 11.Regan JL, et al. c-Kit is required for growth and survival of the cells of origin of Brca1-mutation-associated breast cancer. Oncogene. 2012;31:869–883. doi: 10.1038/onc.2011.289. [DOI] [PubMed] [Google Scholar]
- 12.Lim E, et al. Transcriptome analyses of mouse and human mammary cell subpopulations reveal multiple conserved genes and pathways. Breast cancer research : BCR. 2010;12:R21. doi: 10.1186/bcr2560. [DOI] [PMC free article] [PubMed] [Google Scholar]
- 13.Charafe-Jauffret E, et al. Gene expression profiling of breast cell lines identifies potential new basal markers. Oncogene. 2006;25:2273–2284. doi: 10.1038/sj.onc.1209254. [DOI] [PubMed] [Google Scholar]
- 14.Doane AS, et al. An estrogen receptor-negative breast cancer subset characterized by a hormonally regulated transcriptional program and response to androgen. Oncogene. 2006;25:3994–4008. doi: 10.1038/sj.onc.1209415. [DOI] [PubMed] [Google Scholar]
- 15.Chen Q, et al. A temporal requirement for Hippo signaling in mammary gland differentiation, growth, and tumorigenesis. Genes & development. 2014;28:432–437. doi: 10.1101/gad.233676.113. [DOI] [PMC free article] [PubMed] [Google Scholar]
- 16.Skibinski A, et al. The Hippo transducer TAZ interacts with the SWI/SNF complex to regulate breast epithelial lineage commitment. Cell reports. 2014;6:1059–1072. doi: 10.1016/j.celrep.2014.02.038. [DOI] [PMC free article] [PubMed] [Google Scholar]
- 17.Bhat KP, et al. The transcriptional coactivator TAZ regulates mesenchymal differentiation in malignant glioma. Genes & development. 2011;25:2594–2609. doi: 10.1101/gad.176800.111. [DOI] [PMC free article] [PubMed] [Google Scholar]
- 18.Chen D, et al. LIFR is a breast cancer metastasis suppressor upstream of the Hippo-YAP pathway and a prognostic marker. Nature medicine. 2012;18:1511–1517. doi: 10.1038/nm.2940. [DOI] [PMC free article] [PubMed] [Google Scholar]
- 19.Cordenonsi M, et al. The Hippo transducer TAZ confers cancer stem cell-related traits on breast cancer cells. Cell. 2011;147:759–772. doi: 10.1016/j.cell.2011.09.048. doi:S0092-8674(11)01218-9 [pii] [DOI] [PubMed] [Google Scholar]
- 20.Harvey KF, Zhang X, Thomas DM. The Hippo pathway and human cancer. Nature reviews Cancer. 2013;13:246–257. doi: 10.1038/nrc3458. [DOI] [PubMed] [Google Scholar]
- 21.Balwierz PJ, et al. ISMARA: automated modeling of genomic signals as a democracy of regulatory motifs. Genome research. 2014;24:869–884. doi: 10.1101/gr.169508.113. [DOI] [PMC free article] [PubMed] [Google Scholar]
- 22.Siegel PM, Muller WJ. Transcription factor regulatory networks in mammary epithelial development and tumorigenesis. Oncogene. 2010;29:2753–2759. doi: 10.1038/onc.2010.43. [DOI] [PubMed] [Google Scholar]
- 23.Shehata M, et al. Phenotypic and functional characterization of the luminal cell hierarchy of the mammary gland. Breast cancer research : BCR. 2012;14:R134. doi: 10.1186/bcr3334. [DOI] [PMC free article] [PubMed] [Google Scholar]
- 24.Matthews L, et al. Reactome knowledgebase of human biological pathways and processes. Nucleic acids research. 2009;37:D619–622. doi: 10.1093/nar/gkn863. [DOI] [PMC free article] [PubMed] [Google Scholar]
- 25.Zhang J, Smolen GA, Haber DA. Negative regulation of YAP by LATS1 underscores evolutionary conservation of the Drosophila Hippo pathway. Cancer research. 2008;68:2789–2794. doi: 10.1158/0008-5472.CAN-07-6205. [DOI] [PubMed] [Google Scholar]
- 26.Zhang J, et al. YAP-dependent induction of amphiregulin identifies a non-cell-autonomous component of the Hippo pathway. Nature cell biology. 2009;11:1444–1450. doi: 10.1038/ncb1993. [DOI] [PMC free article] [PubMed] [Google Scholar]
- 27.Varelas X. The Hippo pathway effectors TAZ and YAP in development, homeostasis and disease. Development. 2014;141:1614–1626. doi: 10.1242/dev.102376. [DOI] [PubMed] [Google Scholar]
- 28.Linnemann JR, et al. Quantification of regenerative potential in primary human mammary epithelial cells. Development. 2015;142:3239–3251. doi: 10.1242/dev.123554. [DOI] [PMC free article] [PubMed] [Google Scholar]
- 29.Li W, et al. Merlin/NF2 loss-driven tumorigenesis linked to CRL4(DCAF1)-mediated inhibition of the hippo pathway kinases Lats1 and 2 in the nucleus. Cancer cell. 2014;26:48–60. doi: 10.1016/j.ccr.2014.05.001. [DOI] [PMC free article] [PubMed] [Google Scholar]
- 30.Gyorffy B, Lanczky A, Szallasi Z. Implementing an online tool for genome-wide validation of survival-associated biomarkers in ovarian-cancer using microarray data from 1287 patients. Endocrine-related cancer. 2012;19:197–208. doi: 10.1530/ERC-11-0329. [DOI] [PubMed] [Google Scholar]
- 31.St John MA, et al. Mice deficient of Lats1 develop soft-tissue sarcomas, ovarian tumours and pituitary dysfunction. Nature genetics. 1999;21:182–186. doi: 10.1038/5965. [DOI] [PubMed] [Google Scholar]
- 32.Couse JF, Korach KS. Estrogen receptor null mice: what have we learned and where will they lead us? Endocrine reviews. 1999;20:358–417. doi: 10.1210/edrv.20.3.0370. [DOI] [PubMed] [Google Scholar]
- 33.Duss S, et al. Mesenchymal precursor cells maintain the differentiation and proliferation potentials of breast epithelial cells. Breast cancer research : BCR. 2014;16:R60. doi: 10.1186/bcr3673. [DOI] [PMC free article] [PubMed] [Google Scholar]
- 34.Stampfer M, Hallowes RC, Hackett AJ. Growth of normal human mammary cells in culture. In vitro. 1980;16:415–425. doi: 10.1007/BF02618365. [DOI] [PubMed] [Google Scholar]
- 35.Stingl J, Emerman JT, Eaves CJ. Enzymatic dissociation and culture of normal human mammary tissue to detect progenitor activity. Methods in molecular biology. 2005;290:249–263. doi: 10.1385/1-59259-838-2:249. [DOI] [PubMed] [Google Scholar]
- 36.Konig R, et al. A probability-based approach for the analysis of large-scale RNAi screens. Nature methods. 2007;4:847–849. doi: 10.1038/nmeth1089. [DOI] [PubMed] [Google Scholar]
- 37.Duss S, et al. An oestrogen-dependent model of breast cancer created by transformation of normal human mammary epithelial cells. Breast cancer research : BCR. 2007;9:R38. doi: 10.1186/bcr1734. [DOI] [PMC free article] [PubMed] [Google Scholar]
- 38.Britschgi A, et al. JAK2/STAT5 inhibition circumvents resistance to PI3K/mTOR blockade: a rationale for cotargeting these pathways in metastatic breast cancer. Cancer cell. 2012;22:796–811. doi: 10.1016/j.ccr.2012.10.023. [DOI] [PubMed] [Google Scholar]
- 39.Sleeman KE, Kendrick H, Ashworth A, Isacke CM, Smalley MJ. CD24 staining of mouse mammary gland cells defines luminal epithelial, myoepithelial/basal and non-epithelial cells. Breast cancer research : BCR. 2006;8:R7. doi: 10.1186/bcr1371. [DOI] [PMC free article] [PubMed] [Google Scholar]
- 40.Cicalese A, et al. The tumor suppressor p53 regulates polarity of self-renewing divisions in mammary stem cells. Cell. 2009;138:1083–1095. doi: 10.1016/j.cell.2009.06.048. [DOI] [PubMed] [Google Scholar]
- 41.Meier-Abt F, et al. Parity induces differentiation and reduces Wnt/Notch signaling ratio and proliferation potential of basal stem/progenitor cells isolated from mouse mammary epithelium. Breast cancer research : BCR. 2013;15:R36. doi: 10.1186/bcr3419. [DOI] [PMC free article] [PubMed] [Google Scholar]
- 42.Hu Y, Smyth GK. ELDA: extreme limiting dilution analysis for comparing depleted and enriched populations in stem cell and other assays. Journal of immunological methods. 2009;347:70–78. doi: 10.1016/j.jim.2009.06.008. [DOI] [PubMed] [Google Scholar]
- 43.Soule HD, et al. Isolation and characterization of a spontaneously immortalized human breast epithelial cell line, MCF-10. Cancer research. 1990;50:6075–6086. [PubMed] [Google Scholar]
- 44.Bentires-Alj M, et al. A role for the scaffolding adapter GAB2 in breast cancer. Nature medicine. 2006;12:114–121. doi: 10.1038/nm1341. [DOI] [PubMed] [Google Scholar]
- 45.Ignatiadis M, Sotiriou C. Luminal breast cancer: from biology to treatment. Nature reviews. Clinical oncology. 2013;10:494–506. doi: 10.1038/nrclinonc.2013.124. [DOI] [PubMed] [Google Scholar]
- 46.Koren S, et al. PIK3CA(H1047R) induces multipotency and multi-lineage mammary tumours. Nature. 2015;525:114–118. doi: 10.1038/nature14669. [DOI] [PubMed] [Google Scholar]
- 47.Brauchle M, et al. Protein complex interactor analysis and differential activity of KDM3 subfamily members towards H3K9 methylation. PloS one. 2013;8:e60549. doi: 10.1371/journal.pone.0060549. [DOI] [PMC free article] [PubMed] [Google Scholar]
- 48.Pomp V, et al. Differential expression of epithelial-mesenchymal transition and stem cell markers in intrinsic subtypes of breast cancer. Breast cancer research and treatment. 2015;154:45–55. doi: 10.1007/s10549-015-3598-6. [DOI] [PubMed] [Google Scholar]
- 49.Varga Z, Tubbs RR, Moch H. Concomitant detection of HER2 protein and gene alterations by immunohistochemistry (IHC) and silver enhanced in situ hybridization (SISH) identifies HER2 positive breast cancer with and without gene amplification. PloS one. 2014;9:e105961. doi: 10.1371/journal.pone.0105961. [DOI] [PMC free article] [PubMed] [Google Scholar]
- 50.Cancer Genome Atlas, N. Comprehensive molecular portraits of human breast tumours. Nature. 2012;490:61–70. doi: 10.1038/nature11412. [DOI] [PMC free article] [PubMed] [Google Scholar]
- 51.Gaujoux R, Seoighe C. A flexible R package for nonnegative matrix factorization. BMC bioinformatics. 2010;11:367. doi: 10.1186/1471-2105-11-367. [DOI] [PMC free article] [PubMed] [Google Scholar]
- 52.Livak KJ, Schmittgen TD. Analysis of relative gene expression data using real-time quantitative PCR and the 2(-Delta Delta C(T)) Method. Methods. 2001;25:402–408. doi: 10.1006/meth.2001.1262. [DOI] [PubMed] [Google Scholar]
Associated Data
This section collects any data citations, data availability statements, or supplementary materials included in this article.
Supplementary Materials
Supplementary Tables
Supplementary Table Legends
