Blockade of the granzyme B/perforin pathway through overexpression of the serine protease inhibitor PI-9/SPI-6 constitutes a mechanism for immune escape by tumors - PubMed (original) (raw)
Blockade of the granzyme B/perforin pathway through overexpression of the serine protease inhibitor PI-9/SPI-6 constitutes a mechanism for immune escape by tumors
J P Medema et al. Proc Natl Acad Sci U S A. 2001.
Abstract
The concept for cellular immunotherapy of solid tumors relies heavily on the capacity of class I MHC-restricted cytotoxic T lymphocytes (CTLs) to eliminate tumor cells. However, tumors often have managed to escape from the cytolytic machinery of these effector cells. Therefore, it is very important to chart the mechanisms through which this escape can occur. Target-cell killing by CTLs involves the induction of apoptosis by two major mechanisms: through death receptors and the perforin/granzyme B (GrB) pathway. Whereas tumors previously were shown to exhibit mechanisms for blocking the death receptor pathway, we now demonstrate that they also can resist CTL-mediated killing through interference with the perforin/GrB pathway. This escape mechanism involves expression of the serine protease inhibitor PI-9/SPI-6, which inactivates the apoptotic effector molecule GrB. Expression of PI-9 was observed in a variety of human and murine tumors. Moreover, we show that, indeed, expression results in the resistance of tumor cells to CTL-mediated killing both in vitro and in vivo. Our data reveal that PI-9/SPI-6 is an important parameter determining the success of T cell-based immunotherapeutic modalities against cancer.
Figures
Figure 1
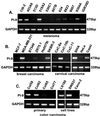
PI-9 is expressed in a subset of human tumors. RNA from human melanoma (A), breast and cervical carcinoma (B), primary colon carcinoma (C Left), and colon carcinoma cell lines (C Right) is isolated, and cDNA is generated. Subsequently, a control PCR for glyceraldehyde-3-phosphate dehydrogenase (GAPDH) (A_–_C Lower) or PI-9 (A_–_C Upper) is performed.
Figure 2
SPI-6 binds GrB and is expressed in a subset of murine tumors. (A) In vitro translated [35S]methionine-labeled SPI-6 was incubated in the absence (−) or presence (+) of purified lysed granules (Left) or in the presence of neutrophil elastase (NE), cathepsin G (CatG), or GrB (Right). Complex formation was detected with the use of a mobility shift in an SDS/PAGE gel. (B) RNA isolated from different murine-tumor lines was used for reverse transcription–PCR. (Bottom) GAPDH PCR for 21, 23, and 25 cycles. (Upper) SPI-6 PCR for 24, 27, and 30 cycles. (C) Western blot analysis of lysates from 0.5 × 10⁶ cells using a peptide-purified rabbit polyclonal antiserum against SPI-6. Please note that the SPI-6 in MFF/SPI-6 migrates at a different mobility because it is tagged with a short sequence derived from the vesicular stomatitis virus (VSV) glycoprotein at the N terminus.
Figure 3
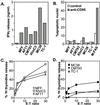
SPI-6 expression is inversely correlated with lysis by CTLs. (A) Cells were incubated with the E1B-specific CTL clone in the presence of the relevant epitope; after 24 hr, the medium was analyzed for IFNγ secreted by the activated CTLs. (B) Cells were treated for 24 hr with crosslinked anti-CD95 and analyzed for DNA fragmentation with the Nicoletti assay (see Materials and Methods). (C and D) Cells were labeled with [3H]thymidine overnight and incubated with an E1B-specific CTL clone in the presence of the relevant epitope. After 6 hr, the remaining label was determined and served as a measure for CTL-induced DNA fragmentation (apoptosis). Note that_C_ and D represent one assay with the same CTL population. E:T ratio, effector-to-target ration.
Figure 4
SPI-6 prevents CTL-induced killing in vitro and_in vivo_. (A) Cells were labeled with [3H]thymidine overnight and incubated with the Moloney murine leukemia virus antigen-specific CTL clone. DNA fragmentation of MFF (▵) or MFF/SPI-6 (●) was determined 6 hr later. To determine the contribution of the perforin pathway, CTLs were preincubated with concanamycin A before the addition of the MFF cells (▴). (B) MFF cells were_in vitro_ labeled with CMTMR (orange fluorescence) and loaded with E1B peptide. MFF/SPI-6 cells, which enhanced green fluorescent protein, were loaded similarly with E1B peptide. MFF and MFF/SPI-6 cells were mixed subsequently at a 1:1 ratio and injected i.p. into nude mice. Mice were then injected i.p. with E1B-specific CTLs or were left untreated. At 24 or 48 hr later, tumor cells were isolated, and the MFF to MFF/SPI-6 ratio was determined from five mice per timepoint (standard deviation is given). The first bar is the ratio of cells that were injected (1:1). (C) One representative FACScan profile is shown per group.
Similar articles
- Antiviral cytokines induce hepatic expression of the granzyme B inhibitors, proteinase inhibitor 9 and serine proteinase inhibitor 6.
Barrie MB, Stout HW, Abougergi MS, Miller BC, Thiele DL. Barrie MB, et al. J Immunol. 2004 May 15;172(10):6453-9. doi: 10.4049/jimmunol.172.10.6453. J Immunol. 2004. PMID: 15128837 - SPI-CI and SPI-6 cooperate in the protection from effector cell-mediated cytotoxicity.
Bots M, Kolfschoten IG, Bres SA, Rademaker MT, de Roo GM, Krüse M, Franken KL, Hahne M, Froelich CJ, Melief CJ, Offringa R, Medema JP. Bots M, et al. Blood. 2005 Feb 1;105(3):1153-61. doi: 10.1182/blood-2004-03-0791. Epub 2004 Sep 28. Blood. 2005. PMID: 15454490 - BCL-2 blocks perforin-induced nuclear translocation of granzymes concomitant with protection against the nuclear events of apoptosis.
Jans DA, Sutton VR, Jans P, Froelich CJ, Trapani JA. Jans DA, et al. J Biol Chem. 1999 Feb 12;274(7):3953-61. doi: 10.1074/jbc.274.7.3953. J Biol Chem. 1999. PMID: 9933585 - Granzymes (lymphocyte serine proteases): characterization with natural and synthetic substrates and inhibitors.
Kam CM, Hudig D, Powers JC. Kam CM, et al. Biochim Biophys Acta. 2000 Mar 7;1477(1-2):307-23. doi: 10.1016/s0167-4838(99)00282-4. Biochim Biophys Acta. 2000. PMID: 10708866 Review.
Cited by
- Granzyme B expression is enhanced in human monocytes by TLR8 agonists and contributes to antibody-dependent cellular cytotoxicity.
Elavazhagan S, Fatehchand K, Santhanam V, Fang H, Ren L, Gautam S, Reader B, Mo X, Cheney C, Briercheck E, Vasilakos JP, Dietsch GN, Hershberg RM, Caligiuri M, Byrd JC, Butchar JP, Tridandapani S. Elavazhagan S, et al. J Immunol. 2015 Mar 15;194(6):2786-95. doi: 10.4049/jimmunol.1402316. Epub 2015 Feb 9. J Immunol. 2015. PMID: 25667415 Free PMC article. - Multiple Myeloma Therapy: Emerging Trends and Challenges.
Dima D, Jiang D, Singh DJ, Hasipek M, Shah HS, Ullah F, Khouri J, Maciejewski JP, Jha BK. Dima D, et al. Cancers (Basel). 2022 Aug 23;14(17):4082. doi: 10.3390/cancers14174082. Cancers (Basel). 2022. PMID: 36077618 Free PMC article. Review. - Engineering universal cells that evade immune detection.
Lanza R, Russell DW, Nagy A. Lanza R, et al. Nat Rev Immunol. 2019 Dec;19(12):723-733. doi: 10.1038/s41577-019-0200-1. Epub 2019 Aug 15. Nat Rev Immunol. 2019. PMID: 31417198 Review. - Serpin B9 controls tumor cell killing by CAR T cells.
Kimman T, Slomp A, Martens A, Grabherr S, Li S, van Diest E, Meeldijk J, Kuball J, Minnema MC, Eldering E, Bovenschen N, Sebestyén Z, Peperzak V. Kimman T, et al. J Immunother Cancer. 2023 Mar;11(3):e006364. doi: 10.1136/jitc-2022-006364. J Immunother Cancer. 2023. PMID: 36931661 Free PMC article. - IFN-γ Rα is a key determinant of CD8+ T cell-mediated tumor elimination or tumor escape and relapse in FVB mouse.
Kmieciak M, Payne KK, Wang XY, Manjili MH. Kmieciak M, et al. PLoS One. 2013 Dec 6;8(12):e82544. doi: 10.1371/journal.pone.0082544. eCollection 2013. PLoS One. 2013. PMID: 24324806 Free PMC article.
References
- Huang A Y, Golumbek P, Ahmadzadeh M, Jaffee E, Pardoll D, Levitsky H. Science. 1994;264:961–965. - PubMed
- Toes R E, Blom R J, van der Voort E, Offringa R, Melief C J, Kast W M. Cancer Res. 1996;56:3782–3787. - PubMed
- Melief C J. Adv Cancer Res. 1992;58:143–175. - PubMed
MeSH terms
Substances
LinkOut - more resources
Full Text Sources
Other Literature Sources
Research Materials
Miscellaneous


