Insulin-like growth factor I controls adhesion strength mediated by alpha5beta1 integrins in motile carcinoma cells - PubMed (original) (raw)
Insulin-like growth factor I controls adhesion strength mediated by alpha5beta1 integrins in motile carcinoma cells
Laura Lynch et al. Mol Biol Cell. 2005 Jan.
Abstract
One of the intriguing questions regarding cell motility concerns the mechanism that makes stationary cells move. Here, we provide the first physical evidence that the onset of breast cancer cell motility in response to insulin-like growth factor I (IGF-I) correlates with lowering of adhesion strength from 2.52 +/- 0.20 to 1.52 +/- 0.13 microdynes/microm2 in cells attached to fibronectin via alpha5beta1 integrin. The adhesion strength depends on the dose of IGF-I and time of IGF-I treatment. Weakening of cell-matrix adhesion is blocked significantly (p < 0.01) by the catalytically inactive IGF-I receptor (IGF-IR) and the phosphoinositide 3-kinase (PI-3 kinase) inhibitor LY-294002, but it is unaffected by mitogen-activated protein kinase kinase inhibitor UO-126 and Src kinase inhibitor PP2. Sustained blockade of Rho-associated kinase (ROCK) with Y-27632 down-regulates adhesion strength in stationary, but not in IGF-I-treated, cells. Jasplakinolide, a drug that prevents actin filament disassembly, counteracts the effect of IGF-I on integrin-mediated cell adhesion. In the absence of growth factor signaling, ROCK supports a strong adhesion via alpha5beta1 integrin, whereas activation of the IGF-IR kinase reduces cell-matrix adhesion through a PI-3K-dependent, but ROCK-independent, mechanism. We propose that disassembly of the actin filaments via PI-3 kinase pathway contributes to weakening of adhesion strength and induction of cell movement. Understanding how cell adhesion and migration are coordinated has an important application in cancer research, developmental biology, and tissue bioengineering.
Figures
Figure 1.
IGF-I induces breast cancer cell motility on various biological substrata. (A) IGF-IR expression levels and signaling in MCF-7-derived cells. Left, cells were stimulated with 100 ng/ml IGF-I for 15 min. Expression of the IGF-IR was compared in MCF-7 cells (parental), MCF-7 cells transfected with pcDNA3 vector (mock), pcDNA3 plasmids encoding the full-length human IGF-IR (WT), and its DK form. Total proteins (50 μg) were resolved by 6% PAGE, blotted with an antibody recognizing the C terminus of the IGF-IR β subunit, stripped, and reprobed with a PY-20 antibody. Total (IGF-IR) and phosphorylated (pIGF-IR) levels of the receptor are shown. Right, mock, WT, and DK cells were stimulated with 100 ng/ml IGF-I for indicated times. Total (ERK1/2 and Akt) and phosphorylated (pERK1/2 and pAkt) levels of ERK1/2 and Akt were assessed in the whole cellular extracts resolved by 12% PAGE; IGF-IR levels were assessed in the immunoprecipitates resolved by 6% PAGE and probed with IGF-IR (IGF-IR) and PY-20 (pIGF-IR) antibodies (see Materials and Methods). Molecular weight markers are shown in kilodaltons. Note, IGF-I-induced phosphorylation of IGF-IR, and its downstream targets Akt and ERK1/2 MAP kinases, was enhanced in WT cells compared with mock MCF-7 cells; in DK cells, IGF-I-induced signaling events were completely blocked. (B and C) Phase-contrast micrographs of WT (B) and DK (C) cells plated on glass coverslips coated with collagen (100 μg/ml), laminin (10 μg/ml), and fibronectin (10 μg/ml). Left, cells incubated in serum-free medium overnight. Right, serum-starved cells treated with 100 ng/ml IGF-I for 1 h. 100% of the WT cells developed motile phenotype in response to IGF-I. Arrows in B point at the leading edge of lamellipodia in moving cells. Bar, 10 μm.
Figure 2.
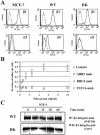
α5 and β1 integrin expression in MCF-7-derived cells. (A) Flow cytometry for MCF-7 parental cell line, WT cells overexpressing wild-type human IGF-IR, and DK cells expressing kinase inactive IGF-IR. Cells were treated with primary antibodies for β1 (mouse anti-human TS2/16) and α5 (mouse anti-human BIIG2) and anti-mouse secondary antibody conjugated to FITC. Dotted line, control (no primary antibody); solid line, cells labeled with primary and secondary antibodies. (B) Short-term adhesion of WT cells to tissue culture plates coated with 0.32, 0.63, 1.25, 2.5, 5.0, and 10.0 μg/ml fibronectin by using standard protocols for coating cover slips and adhesion assay (see Materials and Methods). Adhesion was detected in the presence of AIIB2 (□), a function blocking antibody for β1 integrin; BIIG2 (▵), a function blocking antibody for α5 integrin; and TS2/16 (○), a noninhibitory antibody for b1 integrin. Control (⋄), no antibody. Results are means of triplicates in two independent repeats. Error bar, SEM. (C) β1 integrin expression in WT and DK cells treated with 100 ng/ml IGF-I for 0, 5, 15, 30, and 60 min. The mAb P4C10 was used for IP, and a polyclonal antibody to the C terminus of β1 integrin (cyto) was used for the WB.
Figure 3.
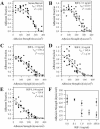
Adherent fraction profiles for MCF-7 cells treated with IGF-I. Cells were serum-starved overnight on fibronectin-coated coverslips and treated with IGF-I for 1 h before exposure to shear stress on a spinning disk device. τ50 is the shear stress at which 50% of the cells are removed from the coverslip. The adherent fraction is the number of cells remaining, normalized to the number at the center, where shear stress is negligible. Experiment (•); sigmoid fit (□); r2, regression coefficient, indicates how accurate the experimental data fit into a sigmoid model. (A) WT cells serum-starved. (B) IGF-I, 0.1 ng/ml. (C) IGF-I, 1.0 ng/ml. (D) IGF-I, 10 ng/ml. (E) IGF-I, 100 ng/ml. (F) τ50 for each treatment plotted as a function of IGF-I concentration. WT cells (•), DK cells (▪). p values < 0.05 by ANOVA are marked with an asterisk for any τ50 significantly different from concentration of IGF-I of 0.0 ng/ml. Results are presented as means of τ50± SEM.
Figure 4.
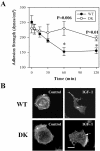
Adhesion strength and F-actin reorganization is dependent on the function of the IGF-IR kinase. (A) Adhesion strength as a function of time for the WT and DK MCF-7 cells treated with 100 ng/ml IGF-I over 2 h. Adhesion strength is measured as the shear stress at which 50% of cells on a spinning disk device remain. p values < 0.05 are marked with asterisks for any τ50 in WT cells that are significantly different from that in DK cells. Results are presented as means of τ50± SEM. (B) F-actin in cells starved in serum-free medium (SFM); starved and then treated with 100 ng/ml IGF-I for 1 h (IGF-I). Arrows point at peripheral stress fibers.
Figure 5.
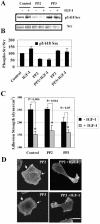
Effects of the PP2 Src kinase inhibitor on c-Src autophosphorylation, adhesion strength, and F-actin. (A) c-Src autophosphorylation at tyrosine 418 measured in the absence or presence of 100 ng/ml IGF-I. Serum-starved cells were pretreated with 1.0 μM PP2 or 1.0 μM PP3 for 1 h and then stimulated with IGF-I for 30 min. Drugs were omitted in the control experiments. Whole cell extracts were resolved by 8% PAGE. Blot was probed with antibody recognizing Src phosphorylated at tyrosine 418 (pY418 Src) and then with pan Src antibody. (B). Summary of three independent experiments. Bar graph shows mean value of relative phosphorylation of c-Src (phospho-Src/total Src). Error bar, SEM. (C) τ50 was measured in WT cells the absence (-IGF-I) or presence (+IGF-I) of IGF-I at 100 ng/ml. Serum-starved cells were treated with 1 μM PP2 or 1 μM PP3 alone for 2 h or pretreated with drug for 1 h and then exposed to IGF-I and drug for another hour. In the control experiments, drugs were omitted. Summary of four independent experiments. Error bar, SEM. Asterisks, significance of reduction in τ50 caused by IGF-I. (D) F-actin in cells treated with the drug alone for 2 h (PP2 and PP3) or pretreated with drug for 1 h and then exposed to IGF-I and drug for 1 h (PP2 + IGF-I, PP3 + IGF-I). Without IGF-I, cells assembled prominent stress fibers at periphery (arrows); cell shape is nearly circular. Exposure to IGF-I results in a loss of long actin filaments and development of an asymmetric cell shape. Bar, 10 μm.
Figure 6.
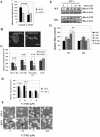
Effects of the PI-3K and ERK1/2 MAPK inhibitors on adhesion strength and F-actin. (A) τ50 was measured in WT cells the absence (-IGF-I) or presence (+IGF-I) of IGF-I at 100 ng/ml. Summary of three independent experiments in serum-starved cells (control) and in the cells pretreated with the PI-3K inhibitor or MEK1/2 inhibitor at 25 μM for 1 h (LY-294002 and UO-126, respectively) and then exposed or not to IGF-I and drug for 1 h. Error bar, SEM. Asterisk, significance of prevention in a decrease of τ50 caused by IGF-I. (B) Serum-starved cells (0.0), cells treated with 100 ng/ml IGF-I for 15 min after exposure to indicated concentrations of UO-126 for 1 h. Top, ERK1/2 phosphorylation on threonine 202 and tyrosine 204 detected with specific phospo-MAPK antibody (pERK1/2); bottom, the same blot stripped and reprobed with antibody recognizing total ERK1/2. (C) F-actin in serum-starved cells treated with LY-294002 and UO-126 at 25 μM for 2 h. One-half of the samples was pretreated with the same inhibitor for 1 h and then exposed to IGF-I and inhibitor for 1 h (LY-294002 + IGF-I, UO-126+ IGF-I). Cells treated with LY-294002 had a circular shape and a similar pattern of F-actin whether exposed or not to IGF-I. Bar, 10 μm.
Figure 7.
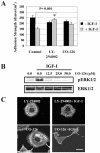
Effects of the ROCK inhibitor on adhesion strength and F-actin. (A) τ50 was measured in WT cells in the absence (-IGF-I) or presence (+IGF-I) of IGF-I at 100 ng/ml. Summary of three independent experiments in serum-starved (control) and in serum-starved cells pretreated with ROCK inhibitor at 10 μM (Y-27632) for 1 h and then exposed to IGF-I for an additional hour. Error bar, SEM. Asterisk, significance of reduction in τ50 caused by Y-27632. (B) F-actin in serum-starved treated with 10 μM Y-27632 for 2 h. Cells also were pretreated with 10 μM Y-27632 and 1 h later stimulated with IGF-I and inhibitor for another hour (Y-27632 + IGF-I). Cells exposed to Y-27632 lost noticeable actin filaments and retracted Individual cells remain spread, left image. Bar, 10 μm. (C) Effect of ROCK inhibitor on adhesion strength of MCF-7 DK, HT-1080, MDA-MB-231, and T47D cells. τ50 was measured in serum-starved cells (control) and in cells treated with 10 μM Y-27632 for 2 h. Summary of three independent experiments is shown in a bar graph. Error bar, SEM. Asterisk, significance of reduction in τ50 caused by Y-27632. (D) Effects of varying concentrations of Y-27632 on adhesion strength and cell morphology. τ50 was measured in WT cells in the absence (-IGF-I) or presence (+IGF-I) of 100 ng/ml IGF-I. Cells were treated with Y-27632 at concentrations of 0.3, 3.0, and 30.0 μM for 2 h, or pretreated with inhibitor for 1 h and then exposed to IGF-I and inhibitor for 1 h. Error bar, SEM. Asterisk, significance of reduction in τ50 caused by IGF-I. (E) Cells were prepared and treated as in D. Phase-contrast images were taken before the spinning assay. Thin black arrows, retracted and rounded cells; bold black arrows, lamellipodia with peripheral ruffles; white arrowheads, abnormally elongated protrusions. (F) Stimulatory effect of IGF-I on RhoA-GTP loading. Serum-starved WT and DK cells were treated with 100 ng/ml IGF-I for indicated times and then processed for RhoA activation. Top, representative blots of active GTP-bound RhoA; bottom, loading control, or total RhoA protein in the cellular extracts. (G) Summary of three to four independent RhoA pull-down assays in WT and DK cells. Error bar, SEM. * and ** denote p = 0.01 and p = 0.03 relative to control, respectively.
Figure 8.
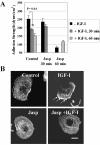
Effects of jasplakinolide on adhesion strength and actin. (A) τ50 was measured in WT cells the absence (-IGF-I) or presence of IGF-I (100 ng/ml) for 30 and 60 min (+IGF-I, 30 min; +IGF-I, 60 min). Serum-starved cells were exposed to jasplakinolide alone (-IGF-I, Jasp 30 min; -IGF-I, Jasp 60 min) or mixed with IGF-I (+IGF-I, Jasp 30 min; +IGF-I, Jasp 60 min). In the control experiments, the drug was omitted. Summary of two independent experiments with triplicate samples. Error bar, SEM. Asterisks, significance of reduction in τ50 caused by IGF-I. (B) Actin in cells serum-starved (control) or treated with 100 ng/ml IGF-I (IGF-I), 0.05 μM jasplakinolide, and a mix of these peptides (Jasp + IGF-I) for 30 min. Exposure to IGF-I results in development of an asymmetric cell shape and concentration of actin at the leading edge of motile lamellipodium (arrows); presence of the drug blocks these effects. Bar, 10 μm. Note, because jasplakinolide competes with phalloidin, actin was visualized by staining with a monoclonal anti-actin antibody that recognizes an epitope located on the C-terminal end in all actin isoforms (Materials and Methods).
Figure 9.
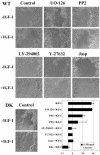
Migration of WT and DK cells in response to IGF-I. Images were acquired after scratching in serum-starved WT and DK cells (control) and WT cells pretreated with 25 μM UO-126 (UO-126), 1 μM PP2 and PP3 (shown for PP2), 25 μM LY-294002 (LY-2954002), 10 μM Y-27632 (Y-27632), 0.05 μM jasplakinolide (Jasp) before (-IGF-I) and after (+IGF-I) addition of 100 ng/ml IGF-I for 2 h. The mean distance from the center of the scratch and to the edge of the wound was determined by taking a similar number of measurements before and after exposure to IGF-I (example is shown in UO-126). The relative closure of the wound was calculated as D0 - D2h/D0 × 100%, where D is a distance from the center of the scratch to the edge of the wound before (D0) and after (D2h) exposure to IGF-I. Bar graph, summary of two independent experiments. Error bar, SEM.
Figure 10.
Model for regulation of α5β1 integrin adhesion strength in carcinoma cells. Black arrows indicate effects and white arrows indicate increased activity of signaling molecules. Bold arrows demonstrate prevailing pathways. Plus and minus symbols represent positive and negative effects, respectively. Left, in the absence of growth factor receptor signaling, basal activities of RhoA and ROCK keep actin cytoskeleton tension in a balance with a strong adhesion force mediated by integrins. Carcinoma cells strongly attach to the ECM and do not move. Right, growth factors, such as IGFs, trigger cell motility through the activation of the receptor tyrosine kinase, and subsequent increase in the activities of the PI-3K, Rho A, and ROCK. Apart from actin polymerization, activation of the PI3-K causes disassembly of F-actin and weakens the integrin-cytoskeleton linkage, leading to reduced adhesion strength via integrins. Once the cytoskeleton is reorganized by a PI-3K-dependent mechanism, ROCK is no longer able to support strong adhesion. ROCK generated cytoskeleton tension is involved in forwarding cell body.
Similar articles
- Insulin-like growth factor-1 regulates endogenous RUNX2 activity in endothelial cells through a phosphatidylinositol 3-kinase/ERK-dependent and Akt-independent signaling pathway.
Qiao M, Shapiro P, Kumar R, Passaniti A. Qiao M, et al. J Biol Chem. 2004 Oct 8;279(41):42709-18. doi: 10.1074/jbc.M404480200. Epub 2004 Aug 9. J Biol Chem. 2004. PMID: 15304489 - Functional role of alpha-actinin, PI 3-kinase and MEK1/2 in insulin-like growth factor I receptor kinase regulated motility of human breast carcinoma cells.
Guvakova MA, Adams JC, Boettiger D. Guvakova MA, et al. J Cell Sci. 2002 Nov 1;115(Pt 21):4149-65. doi: 10.1242/jcs.00104. J Cell Sci. 2002. PMID: 12356918 - To move or not: how a cell responds (Review).
Christopher RA, Guan JL. Christopher RA, et al. Int J Mol Med. 2000 Jun;5(6):575-81. doi: 10.3892/ijmm.5.6.575. Int J Mol Med. 2000. PMID: 10812004 Review. - Cell signaling and cancer.
Martin GS. Martin GS. Cancer Cell. 2003 Sep;4(3):167-74. doi: 10.1016/s1535-6108(03)00216-2. Cancer Cell. 2003. PMID: 14522250 Review.
Cited by
- Inhibition of the peritoneal metastasis of human gastric cancer cells by dextran sulphate in vivo and in vitro.
Xu Y, Huang Y, Wang H, Liu Y. Xu Y, et al. Oncol Lett. 2016 Apr;11(4):2384-2390. doi: 10.3892/ol.2016.4234. Epub 2016 Feb 17. Oncol Lett. 2016. PMID: 27073484 Free PMC article. - Interaction between serine phosphorylated IRS-1 and beta1-integrin affects the stability of neuronal processes.
Wang JY, Gualco E, Peruzzi F, Sawaya BE, Passiatore G, Marcinkiewicz C, Staniszewska I, Ferrante P, Amini S, Khalili K, Reiss K. Wang JY, et al. J Neurosci Res. 2007 Aug 15;85(11):2360-73. doi: 10.1002/jnr.21400. J Neurosci Res. 2007. PMID: 17593555 Free PMC article. - Phosphorylation of RACK1 on tyrosine 52 by c-Abl is required for insulin-like growth factor I-mediated regulation of focal adhesion kinase.
Kiely PA, Baillie GS, Barrett R, Buckley DA, Adams DR, Houslay MD, O'Connor R. Kiely PA, et al. J Biol Chem. 2009 Jul 24;284(30):20263-74. doi: 10.1074/jbc.M109.017640. Epub 2009 May 7. J Biol Chem. 2009. PMID: 19423701 Free PMC article. - Inhibition of peritoneal metastasis of human gastric cancer cells by dextran sulphate through the reduction in HIF-1α and ITGβ1 expression.
Xu Y, Jin X, Huang Y, Dong J, Wang H, Wang X, Cao X. Xu Y, et al. Oncol Rep. 2016 May;35(5):2624-34. doi: 10.3892/or.2016.4693. Epub 2016 Mar 18. Oncol Rep. 2016. PMID: 27004522 Free PMC article. - Guiding cell migration by tugging.
Plotnikov SV, Waterman CM. Plotnikov SV, et al. Curr Opin Cell Biol. 2013 Oct;25(5):619-26. doi: 10.1016/j.ceb.2013.06.003. Epub 2013 Jul 3. Curr Opin Cell Biol. 2013. PMID: 23830911 Free PMC article. Review.
References
- Amano, M., Chihara, K., Kimura, K., Fukata, Y., Nakamura, N., Matsuura, Y., and Kaibuchi, K. (1997). Formation of actin stress fibers and focal adhesions enhanced by Rho-kinase. Science 275, 1308-1311. - PubMed
- Amano, M., Fukata, Y., and Kaibuchi, K. (2000). Regulation and functions of Rho-associated kinase. Exp. Cell Res. 261, 44-51. - PubMed
- Birchmeier, C., Meyer, D., and Riethmacher, D. (1995). Factors controlling growth, motility, and morphogenesis of normal and malignant epithelial cells. Int. Rev. Cytol. 160, 221-266. - PubMed
Publication types
MeSH terms
Substances
LinkOut - more resources
Full Text Sources
Research Materials
Miscellaneous

