Dasatinib, a small-molecule protein tyrosine kinase inhibitor, inhibits T-cell activation and proliferation - PubMed (original) (raw)
Dasatinib, a small-molecule protein tyrosine kinase inhibitor, inhibits T-cell activation and proliferation
Andrew E Schade et al. Blood. 2008.
Abstract
Dasatinib is an oral small molecule inhibitor of Abl and Src family tyrosine kinases (SFK), including p56(Lck) (Lck). Given the central importance of Lck in transmitting signals from the T-cell receptor (TCR) signaling complex and the potent ability of dasatinib to inhibit Lck activity, we hypothesized this agent could provide a novel route of immunomodulation via targeted inhibition of antigen-induced signaling. Herein, we show that dasatinib inhibits TCR-mediated signal transduction, cellular proliferation, cytokine production, and in vivo T-cell responses. However, dasatinib-mediated inhibition does not induce apoptosis because the effect is reversible or may be overcome by signals bypassing the TCR, such as phorbol ester. Signal transduction and proliferative responses via IL-2 remain essentially unperturbed, suggesting that dasatinib displays specificity for TCR signaling. In addition, dasatinib combined with cyclosporine A or rapamycin led to a much more potent inhibition of T-cell activation, suggesting that targeted inhibition of Lck could be a useful adjunct for enhanced immunomodulation. In combination with currently available immunomodulatory agents, SFK inhibition could potentially increase immunomodulatory efficacy while minimizing toxicity of individual agents.
Figures
Figure 1
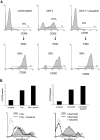
TCR complex signal transduction, but not IL-2, is inhibited by dasatinib. T cells were stimulated in the presence or absence of dasatinib for 2 or 10 minutes at 37°C, then immediately lysed. Proteins were separated by SDS-PAGE, transferred to nitrocellulose, and probed with (A) pan antiphosphotyrosine or (B) PathScan Multiplex Western Cocktail I (phospho-p90RSK, phospho-AKT, phospho-ERK, phospho-S6, and loading control eIF4E). Chemiluminescent detection was performed with a FluorChem SP CCD camera. (C) T cells were stimulated for 15 minutes with IL-2 and/or 5 minutes with OKT3, then fixed with formaldehyde at 37°C for 10 minutes. Cells were then permeabilized with methanol and stained for phospho-ERK or phospho-STAT5. Solid lines, stimulated T cells (10 μg/mL OKT3 alone or with 20 ng/mL IL-2 as indicated); dashed lines, stimulated T cells in the presence of 10 nM dasatinib; dotted lines, control. (D) T cells were stimulated with OKT3 or IL-2 for 30 minutes at 37°C, nuclear extracts were isolated, and DNA binding of STAT5 and NFκB was determined by EMSA.
Figure 2
Dasatinib inhibits TCR-mediated activation of primary human T cells. (A) PBMCs were cultured with OKT3 in the absence (top) or presence (bottom) of dasatinib for 4 hours (original magnification, ×400). (B,C) PBMCs were stimulated with OKT3 (100 ng/mL) or PHA (0.5%) in the presence or absence of dasatinib (10 nM). T cells were analyzed for CD69 expression after 20 hours (B) or CD38 after 72 hours (C) by flow cytometry. Solid gray, OKT3 or PHA stimulation; dashed lines, stimulated T cells in the presence of 10 nM dasatinib; dotted lines, control.
Figure 3
Stimulation bypassing the TCR complex can overcome the effects of SFK inhibition. (A) PBMCs were stimulated with OKT3 in the presence or absence of 10 nM dasatinib for 20 hours, and a portion were analyzed by flow cytometry for CD69 (top row). The same groups were then stimulated with PMA (50 ng/mL) for an additional 20 hours and T cells analyzed again for CD69 expression (bottom row). (B) PBMCs were stimulated with PHA or CD3/CD28 beads for 72 hours and then stained with SYTOX green and annexin V and analyzed by flow cytometry.
Figure 4
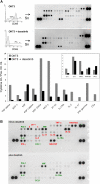
Proinflammatory cytokine production is inhibited by dasatinib. (A) PBMCs were stimulated with OKT3 (100 ng/mL) in the presence or absence of dasatinib (10 nM). After 24 hours, supernatants (Sn) were collected and T cells were analyzed for CD69 expression, as in Figure 3. Cytokines in the supernatants were detected by capture antibodies spotted in duplicate on nitrocellulose membranes (R&D Systems). Chemiluminescence signal was detected with a FluorChem SP CCD camera and intensity was quantitated using Quantity One 1-D Analysis Software (Bio-Rad, Hercules, CA). The high-intensity spots in the 3 corners are positive controls; the top left corners contain the negative controls. A graph of the relative intensity (compared with average of positive controls) is shown for selected cytokines. The inset graph is the same data, but on a larger scale for cytokines with higher expression levels. (B) PBTs were stimulated with 10 ng/mL OKT3 in the presence or absence of 10 nM dasatinib for 48 hours. Supernatants were collected for cytokine analysis as in Figure 4A, selected cytokines are labeled: red, cytokines that decreased by greater than 2-fold in the presence of dasatinib; green, cytokines that decreased by less than 2-fold or did not change in the presence of dasatinib.
Figure 5
T-cell proliferation induced by TCR engagement, but not IL-2, is markedly inhibited by dasatinib. (A) PBMCs were loaded with CFSE and then stimulated with OKT3 (100 ng/mL; top panels) or PHA (0.5%; bottom panels) in the presence or absence of dasatinib (10 nM). After 5 days, T lymphocytes were analyzed by flow cytometry for proliferation based on CFSE dilution using WinMDI 2.8 and ModFit LT. OKT3 or PHA stimulation alone is shown by the gray-shaded area, whereas OKT3 or PHA in the presence of dasatinib is indicated by the red line, which overlapped the untreated control. (B) PBT expanded in IL-2 for 7 days were rested overnight, loaded with CFSE, and then stimulated with IL-2 or IL-2 + OKT3 in the presence or absence of dasatinib (10 nM). After 5 days, T lymphocytes were analyzed by flow cytometry for proliferation. Gray, unstimulated; blue, IL-2 alone; green, IL-2 + OKT3; red, IL-2 + OKT3 + dasatinib. (C) PBMCs were loaded with CFSE and then stimulated with OKT3 (100 ng/mL). Dasatinib (10 nM) was added at time zero (ii), after 24 hours (iii), after 48 hours (iv), or after 72 hours (v) before analysis at 120 hours. The percentage of proliferating T cells is indicated in each panel. (D) PBMCs were stimulated with PHA or CD3/CD28 beads for 72 hours and then stained with propidium iodide. DNA content was then measured by flow cytometry.
Figure 6
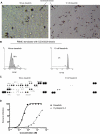
T-cell proliferation and cytokine production induced by TCR/CD3 engagement plus CD28 costimulation is potently inhibited by dasatinib. PBMCs were loaded with CFSE and then stimulated with anti-CD3/CD28 beads in the presence or absence of 10 nM dasatinib. (A) Microscopic analysis of PBMC cultures at 72 hours. (B) CFSE staining was analyzed by flow cytometry at 120 hours. Numbers on plots are the percentage of proliferating T cells. (C) Cytokine production was analyzed in supernatants at 120 hours. (D) Peripheral blood T cells were stimulated with plate-bound anti-CD3 plus soluble anti-CD28 antibody for 3 days in the presence of various concentrations of dasatinib or cyclosporin A, or in the presence of DMSO vehicle alone. T-cell proliferation was measured by [3H] thymidine incorporation. Assays were performed in triplicate, and the percentage inhibition relative to controls treated with DMSO vehicle was calculated.
Figure 7
Dasatinib inhibits in vivo T-cell proliferation and in combination with cyclosporine A or rapamycin leads to enhanced inhibition of T-cell proliferation in vitro. (A) PBMCs were loaded with CFSE and stimulated with OKT3 (100 ng/mL) in the presence or absence of dasatinib (1 nM), cyclosporine A (CsA; 10 ng/mL [8.3 nM]), or rapamycin (0.1 ng/mL [0.11 nM]). Proliferating T cells were analyzed after 120 hours. Data from 2 representative donors are shown to illustrate moderate interindividual differences in response to each drug. The percentage of proliferating T cells is indicated in each panel. (B) PBMCs were loaded with CFSE and stimulated with OKT3 (100 ng/mL) in the presence or absence of dasatinib (1 or 2 nM), or rapamycin (0.1 or 0.2 ng/mL). Proliferating T cells were analyzed after 120 hours. (C) Spleen and lymph nodes cell from C57BL/6 mice and loaded with CFSE and adoptively transferred by tail vein injection to lethally irradiated C3H/HeJ recipient mice (40 × 106 cells per recipient; n = 3 mice/group). Lethally irradiated C57BL/6 recipient mice were used as syngeneic controls. Compounds were administered by oral gavage once per day at the doses indicated in a vehicle consisting of 50% propylene glycol and 50% water. Lymphocytes were harvested from the spleens of recipient mice on day 3 after transfer and analyzed by flow cytometry for the CFSE content of the donor CD4+ lymphocytes. The response index relative to the syngeneic control group is indicated. Comparison of compound treated groups' response index to the vehicle-treated group was performed by Student t test (**P < .01). Error bars represent SEM.
Comment in
- Dasatinib suppresses in vitro natural killer cell cytotoxicity.
Blake SJ, Bruce Lyons A, Fraser CK, Hayball JD, Hughes TP. Blake SJ, et al. Blood. 2008 Apr 15;111(8):4415-6. doi: 10.1182/blood-2008-02-138701. Blood. 2008. PMID: 18398058 No abstract available.
Similar articles
- The Src/ABL kinase inhibitor dasatinib (BMS-354825) inhibits function of normal human T-lymphocytes in vitro.
Blake S, Hughes TP, Mayrhofer G, Lyons AB. Blake S, et al. Clin Immunol. 2008 Jun;127(3):330-9. doi: 10.1016/j.clim.2008.02.006. Epub 2008 Apr 18. Clin Immunol. 2008. PMID: 18395492 - Inhibition of Lck enhances glucocorticoid sensitivity and apoptosis in lymphoid cell lines and in chronic lymphocytic leukemia.
Harr MW, Caimi PF, McColl KS, Zhong F, Patel SN, Barr PM, Distelhorst CW. Harr MW, et al. Cell Death Differ. 2010 Sep;17(9):1381-91. doi: 10.1038/cdd.2010.25. Epub 2010 Mar 19. Cell Death Differ. 2010. PMID: 20300113 Free PMC article. - Subcellular distribution of Lck during CD4 T-cell maturation in the thymic medulla regulates the T-cell activation threshold.
Stephen TL, Wilson BS, Laufer TM. Stephen TL, et al. Proc Natl Acad Sci U S A. 2012 May 8;109(19):7415-20. doi: 10.1073/pnas.1119272109. Epub 2012 Apr 23. Proc Natl Acad Sci U S A. 2012. PMID: 22529380 Free PMC article. - Inhibition of SRC family kinases and receptor tyrosine kinases by dasatinib: possible combinations in solid tumors.
Montero JC, Seoane S, Ocaña A, Pandiella A. Montero JC, et al. Clin Cancer Res. 2011 Sep 1;17(17):5546-52. doi: 10.1158/1078-0432.CCR-10-2616. Epub 2011 Jun 13. Clin Cancer Res. 2011. PMID: 21670084 Review. - Two-step TCR zeta/CD3-CD4 and CD28 signaling in T cells: SH2/SH3 domains, protein-tyrosine and lipid kinases.
Rudd CE, Janssen O, Cai YC, da Silva AJ, Raab M, Prasad KV. Rudd CE, et al. Immunol Today. 1994 May;15(5):225-34. doi: 10.1016/0167-5699(94)90248-8. Immunol Today. 1994. PMID: 8024683 Review.
Cited by
- Principal component analysis uncovers cytomegalovirus-associated NK cell activation in Ph+ leukemia patients treated with dasatinib.
Ishiyama K, Kitawaki T, Sugimoto N, Sozu T, Anzai N, Okada M, Nohgawa M, Hatanaka K, Arima N, Ishikawa T, Tabata S, Onaka T, Oka S, Nakabo Y, Amakawa R, Matsui M, Moriguchi T, Takaori-Kondo A, Kadowaki N. Ishiyama K, et al. Leukemia. 2017 Jan;31(1):203-212. doi: 10.1038/leu.2016.174. Epub 2016 Jun 14. Leukemia. 2017. PMID: 27349810 - Sample preparation strategies for efficient correlation of 3D SIM and soft X-ray tomography data at cryogenic temperatures.
Okolo CA, Kounatidis I, Groen J, Nahas KL, Balint S, Fish TM, Koronfel MA, Cortajarena AL, Dobbie IM, Pereiro E, Harkiolaki M. Okolo CA, et al. Nat Protoc. 2021 Jun;16(6):2851-2885. doi: 10.1038/s41596-021-00522-4. Epub 2021 May 14. Nat Protoc. 2021. PMID: 33990802 - Systems-level conservation of the proximal TCR signaling network of mice and humans.
Nicolas P, Ollier J, Mori D, Voisinne G, Celis-Gutierrez J, Gregoire C, Perroteau J, Vivien R, Camus M, Burlet-Schiltz O, Gonzalez de Peredo A, Clémenceau B, Roncagalli R, Vié H, Malissen B. Nicolas P, et al. J Exp Med. 2022 Feb 7;219(2):e20211295. doi: 10.1084/jem.20211295. Epub 2022 Jan 21. J Exp Med. 2022. PMID: 35061003 Free PMC article. - Novel Treatment Strategies Utilizing Immune Reactions against Chronic Myelogenous Leukemia Stem Cells.
Matsushita M. Matsushita M. Cancers (Basel). 2021 Oct 29;13(21):5435. doi: 10.3390/cancers13215435. Cancers (Basel). 2021. PMID: 34771599 Free PMC article. Review. - Small Molecule Inhibitors of MERTK and FLT3 Induce Cell Cycle Arrest in Human CD8+ T Cells.
Powell RM, Peeters MJW, Rahbech A, Aehnlich P, Seremet T, Thor Straten P. Powell RM, et al. Vaccines (Basel). 2021 Nov 8;9(11):1294. doi: 10.3390/vaccines9111294. Vaccines (Basel). 2021. PMID: 34835225 Free PMC article.
References
- Germain RN, Stefanova I. The dynamics of T cell receptor signaling: complex orchestration and the key roles of tempo and cooperation. Annu Rev Immunol. 1999;17:467–522. - PubMed
- Qian D, Weiss A. T cell antigen receptor signal transduction. Curr Opin Cell Biol. 1997;9:205–212. - PubMed
- Cortes J, Rousselot P, Kim DW, et al. Dasatinib induces complete hematologic and cytogenetic responses in patients with imatinib-resistant or -intolerant chronic myeloid leukemia in blast crisis. Blood. 2007;109:3207–3213. - PubMed
- Guilhot F, Apperley J, Kim DW, et al. Dasatinib induces significant hematologic and cytogenetic responses in patients with imatinib-resistant or -intolerant chronic myeloid leukemia in accelerated phase. Blood. 2007;109:4143–4150. - PubMed
Publication types
MeSH terms
Substances
Grants and funding
- K24 HL077522/HL/NHLBI NIH HHS/United States
- R01 HL73429-01/HL/NHLBI NIH HHS/United States
- R01 CA113972/CA/NCI NIH HHS/United States
- R01 CA 113972-01/CA/NCI NIH HHS/United States
- K24 HL0077522-01/HL/NHLBI NIH HHS/United States
- R01 HL073429/HL/NHLBI NIH HHS/United States
LinkOut - more resources
Full Text Sources
Other Literature Sources
Research Materials
Miscellaneous


