Outside-in signal transmission by conformational changes in integrin Mac-1 - PubMed (original) (raw)
Outside-in signal transmission by conformational changes in integrin Mac-1
Craig T Lefort et al. J Immunol. 2009.
Abstract
Intracellular signals associated with or triggered by integrin ligation can control cell survival, differentiation, proliferation, and migration. Despite accumulating evidence that conformational changes regulate integrin affinity to its ligands, how integrin structure regulates signal transmission from the outside to the inside of the cell remains elusive. Using fluorescence resonance energy transfer, we addressed whether conformational changes in integrin Mac-1 are sufficient to transmit outside-in signals in human neutrophils. Mac-1 conformational activation induced by ligand occupancy or activating Ab binding, but not integrin clustering, triggered similar patterns of intracellular protein tyrosine phosphorylation, including Akt phosphorylation, and inhibited spontaneous neutrophil apoptosis, indicating that global conformational changes are critical for Mac-1-dependent outside-in signal transduction. In neutrophils and myeloid K562 cells, ligand ICAM-1 or activating Ab binding promoted switchblade-like extension of the Mac-1 extracellular domain and separation of the alpha(M) and beta(2) subunit cytoplasmic tails, two structural hallmarks of integrin activation. These data suggest the primacy of global conformational changes in the generation of Mac-1 outside-in signals.
Conflict of interest statement
Disclosures
The authors have no financial conflict of interest.
Figures
FIGURE 1
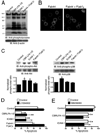
A and C, PMN were treated at 37°C for 15 min with 10 µg/ml CBR LFA-1/2 or ICAM-1, both in the presence of 1 mM MnCl2 or with anti-αM Fab (Fab44) and secondary F(ab′)2 to induce Mac-1 clustering. For cells treated with CBR LFA-1/2, anti-αM Fab fragments at a concentration of 50 µg/ml were used to block potential ligand binding. In A, immunoblots of whole-cell lysates were probed for the presence of tyrosine-phosphorylated proteins and for β-actin as a protein loading control. In C, immunoblots were probed for phosphorylated (phospho-p38; pThr180/pTyr182) and total p38, or for phosphorylated (phospho-Akt; pThr308) and total Akt. Western blot results from two experiments were quantified using ImageJ software and were normalized according to the control treatment. B, Unstimulated PMNs were incubated at 37°C for 15 min with FITC-conjugated anti-αM Fab44 (5 µg/ml) in the absence (left) or presence (right) of secondary F(ab′)2 (2.5 µg/ml) to induce Mac-1 clustering. D and E, PMN were treated with 1 mM MnCl2, 10 µg/ml CBR LFA-1/2 Fab and 10 µg/ml anti-αM Fab (Fab44), 1 mM MnCl2 and 200 µg/ml ICAM-1, or 5 µg/ml anti-αM Fab (Fab44) and 2.5 µg/ml secondary F(ab′)2 to induce Mac-1 clustering. Cells were pretreated for 15 min with or without 40 µM LY294002 or 2 µM SB239063. After incubation at 37°C for 16 h, cells were labeled with FITC-conjugated annexin V to detect apoptotic PMNs. Data are means ± SEM from three (D) or five (E) experiments performed in duplicate, and are expressed as percent of annexin V-positive cells. Significantly different from control (**, p < 0.01; or *, p < 0.05).
FIGURE 2
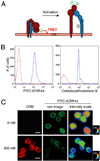
A, Schematic depicting the loss of FRET between FITC-conjugated mAbs and ORB membrane dye during extracellular domain extension. The Abs used were: 1, FITC-ICRF44; 2, FITC-CBRM1/5; and 3, CBR LFA-1/2. B, PMNs labeled with FITC-ICRF44 and ORB (blue trace) or IgG1 isotype control (red trace) were analyzed by flow cytometry. C, PMN labeled with FITC-ICRF44 and then incubated with or without 400 nM ORB were imaged by immunofluorescence microscopy. Far right, intensity of the FITC signal converted to a rainbow scale. Bar, 10 µm.
FIGURE 3
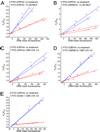
PMN were stimulated with or without 10 nM fMLP (A and B) or with 1 mM MnCl2 and 10 µg/ml CBR LFA-1/2 mAb (C–E) for 15 min. Unstimulated cells were labeled with FITC-ICRF44, and stimulated cells were labeled with FITC-ICRF44 (A and C), FITC-CBRM1/5 (B and D), or FITC-ICAM-1 (E). Cells were then incubated with 0, 75, 200, or 400 nM ORB and then analyzed by flow cytometry. Each plot consists of measurements from a single blood donor, with each condition being performed in duplicate (two curves per condition). Data are plotted as the fraction of the donor mean fluorescence intensity in the absence of acceptor fluorophores to that in the presence of the measured fluorescence acceptor (Equation 1).
FIGURE 4
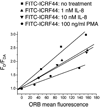
Untreated PMN or PMN treated with 1 or 10 nM IL-8 or 100 ng/ml PMA were labeled with FITC-ICRF44 mAb. Cells were incubated with ORB as described in Fig. 3 and then analyzed by flow cytometry. Data are plotted as described in Fig. 3.
FIGURE 5
Untreated PMN or PMN treated with 10 nM fMLP or 1 mM MnCl2 and 10 µg/ml CBR LFA-1/2 mAb and then labeled with FITC-VIM12 mAb. Cells were incubated with ORB as described in the legend to Fig. 3 and then analyzed by flow cytometry. Data are plotted as described in Fig. 3.
FIGURE 6
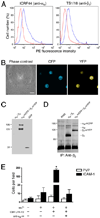
A, K562 cells expressing αM-mCFP and β2-mYFP were labeled with anti-αM ICRF44 mAb, anti-β2 TS1/18 mAb, or IgG1 isotype mAb (red trace), followed by PE-conjugated secondary Abs. Cells were analyzed by flow cytometry. B, K562 cells expressing αM-mCFP and β2-mYFP were visualized under phase contrast and immunofluorescence microscopy. C, Whole-cell lysates from K562 cells expressing αM-mCFP and β2-mYFP were analyzed by immunoblotting using an anti-GFP polyclonal Ab. D, Mac-1 was immunoprecipitated from K562 cells, K562 cells expressing wild-type αM and β2, and K562 cells expressing αM-mCFP and β2-mYFP using the anti-β2 CBR LFA-1/2 mAb. Proteins were separated on a 7.5% SDS-PAGE gel and then analyzed by silver staining. E, K562 cells expressing αM-mCFP and β2-mYFP were allowed to adhere to tissue culture plastic coated with ICAM-1 or PVP, as a control, in the presence or absence of 1 mM MnCl2, 10 µg/ml CBR LFA-1/2 mAb, and anti-αM clone 44 mAb. After a 30-min incubation, nonadherent cells were washed away, and the number of adherent cells per field was counted. Data are presented as mean ± SEM from one of three independent experiments. *, Significantly different from control (p < 0.01).
FIGURE 7
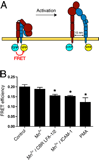
A, Schematic depicting the loss of FRET between αM-mCFP and β2-mYFP during Mac-1 cytoplasmic tail separation. B, K562 cells expressing αM-mCFP and β2-mYFP were treated with 1 mM MnCl2 in the absence or presence of 10 µg/ml CBR LFA-1/2 Fab or 200 µg/ml ICAM-1, or with 100 nM PMA. CFP and YFP images were captured of individual cells before and after photobleaching of the YFP signal. FRET efficiency was calculated as described in Materials and Methods. *, Significantly different from control (p < 0.05).
Similar articles
- Fundamentally different roles for LFA-1, Mac-1 and alpha4-integrin in neutrophil chemotaxis.
Heit B, Colarusso P, Kubes P. Heit B, et al. J Cell Sci. 2005 Nov 15;118(Pt 22):5205-20. doi: 10.1242/jcs.02632. Epub 2005 Oct 25. J Cell Sci. 2005. PMID: 16249234 - P-selectin cross-links PSGL-1 and enhances neutrophil adhesion to fibrinogen and ICAM-1 in a Src kinase-dependent, but GPCR-independent mechanism.
Xu T, Zhang L, Geng ZH, Wang HB, Wang JT, Chen M, Geng JG. Xu T, et al. Cell Adh Migr. 2007 Jul-Sep;1(3):115-23. doi: 10.4161/cam.1.3.4984. Epub 2007 Jul 5. Cell Adh Migr. 2007. PMID: 19262138 Free PMC article. - Blockade of focal clustering and active conformation in beta 2-integrin-mediated adhesion of eosinophils to intercellular adhesion molecule-1 caused by transduction of HIV TAT-dominant negative Ras.
Myou S, Zhu X, Boetticher E, Myo S, Meliton A, Lambertino A, Munoz NM, Leff AR. Myou S, et al. J Immunol. 2002 Sep 1;169(5):2670-6. doi: 10.4049/jimmunol.169.5.2670. J Immunol. 2002. PMID: 12193740 - Neutrophil cell surface receptors and their intracellular signal transduction pathways.
Futosi K, Fodor S, Mócsai A. Futosi K, et al. Int Immunopharmacol. 2013 Nov;17(3):638-50. doi: 10.1016/j.intimp.2013.06.034. Epub 2013 Aug 30. Int Immunopharmacol. 2013. PMID: 23994464 Free PMC article. Review. - Reprint of Neutrophil cell surface receptors and their intracellular signal transduction pathways.
Futosi K, Fodor S, Mócsai A. Futosi K, et al. Int Immunopharmacol. 2013 Dec;17(4):1185-97. doi: 10.1016/j.intimp.2013.11.010. Epub 2013 Nov 18. Int Immunopharmacol. 2013. PMID: 24263067 Review.
Cited by
- Natural Killer Cell Integrins and Their Functions in Tissue Residency.
Shannon MJ, Mace EM. Shannon MJ, et al. Front Immunol. 2021 Mar 10;12:647358. doi: 10.3389/fimmu.2021.647358. eCollection 2021. Front Immunol. 2021. PMID: 33777044 Free PMC article. Review. - β2 Integrin CD11d/CD18: From Expression to an Emerging Role in Staged Leukocyte Migration.
Blythe EN, Weaver LC, Brown A, Dekaban GA. Blythe EN, et al. Front Immunol. 2021 Nov 8;12:775447. doi: 10.3389/fimmu.2021.775447. eCollection 2021. Front Immunol. 2021. PMID: 34858434 Free PMC article. Review. - Focal adhesions are sites of integrin extension.
Askari JA, Tynan CJ, Webb SE, Martin-Fernandez ML, Ballestrem C, Humphries MJ. Askari JA, et al. J Cell Biol. 2010 Mar 22;188(6):891-903. doi: 10.1083/jcb.200907174. Epub 2010 Mar 15. J Cell Biol. 2010. PMID: 20231384 Free PMC article. - Functional Mapping of Adhesiveness on Live Cells Reveals How Guidance Phenotypes Can Emerge From Complex Spatiotemporal Integrin Regulation.
Robert P, Biarnes-Pelicot M, Garcia-Seyda N, Hatoum P, Touchard D, Brustlein S, Nicolas P, Malissen B, Valignat MP, Theodoly O. Robert P, et al. Front Bioeng Biotechnol. 2021 Apr 7;9:625366. doi: 10.3389/fbioe.2021.625366. eCollection 2021. Front Bioeng Biotechnol. 2021. PMID: 33898401 Free PMC article. - Coarse-Grained Simulation of Full-Length Integrin Activation.
Bidone TC, Polley A, Jin J, Driscoll T, Iwamoto DV, Calderwood DA, Schwartz MA, Voth GA. Bidone TC, et al. Biophys J. 2019 Mar 19;116(6):1000-1010. doi: 10.1016/j.bpj.2019.02.011. Epub 2019 Feb 22. Biophys J. 2019. PMID: 30851876 Free PMC article.
References
- Bunting M, Harris ES, McIntyre TM, Prescott SM, Zimmerman GA. Leukocyte adhesion deficiency syndromes: adhesion and tethering defects involving β2 integrins and selectin ligands. Curr. Opin. Hematol. 2002;9:30–35. - PubMed
- Anderson DC, Schmalsteig FC, Finegold MJ, Hughes BJ, Rothlein R, Miller LJ, Kohl S, Tosi MF, Jacobs RL, Waldrop TC, et al. The severe and moderate phenotypes of heritable Mac-1, LFA-1 deficiency: their quantitative definition and relation to leukocyte dysfunction and clinical features. J. Infect. Dis. 1985;152:668–689. - PubMed
- Anderson DC, Springer TA. Leukocyte adhesion deficiency: an inherited defect in the Mac-1, LFA-1, and p150,95 glycoproteins. Annu. Rev. Med. 1987;38:175–194. - PubMed
- Hynes RO. Integrins: bidirectional, allosteric signaling machines. Cell. 2002;110:673–687. - PubMed
Publication types
MeSH terms
Substances
Grants and funding
- HL087088/HL/NHLBI NIH HHS/United States
- R01 HL087088/HL/NHLBI NIH HHS/United States
- R21 HL094797/HL/NHLBI NIH HHS/United States
- HL18208/HL/NHLBI NIH HHS/United States
- P01 HL018208/HL/NHLBI NIH HHS/United States
LinkOut - more resources
Full Text Sources
Other Literature Sources
Research Materials
Miscellaneous
