A HORMA domain in Atg13 mediates PI 3-kinase recruitment in autophagy - PubMed (original) (raw)
A HORMA domain in Atg13 mediates PI 3-kinase recruitment in autophagy
Christine C Jao et al. Proc Natl Acad Sci U S A. 2013.
Abstract
Autophagy-related 13 (Atg13) is a key early-acting factor in autophagy and the major locus for nutrient-dependent regulation of autophagy by Tor. The 2.3-Å resolution crystal structure of the N-terminal domain of Atg13 reveals a previously unidentified HORMA (Hop1p, Rev1p and Mad2) domain similar to that of the spindle checkpoint protein Mad2. Mad2 has two different stable conformations, O-Mad2 and C-Mad2, and the Atg13 HORMA structure corresponds to the C-Mad2 state. The Atg13 HORMA domain is required for autophagy and for recruitment of the phosphatidylinositol (PI) 3-kinase subunit Atg14 but is not required for Atg1 interaction or Atg13 recruitment to the preautophagosomal structure. The Atg13 HORMA structure reveals a pair of conserved Arg residues that constitute a putative phosphate sensor. One of the Arg residues is in the region corresponding to the "safety belt" conformational switch of Mad2, suggesting conformational regulation of phosphate binding. These two Arg residues are essential for autophagy, suggesting that the Atg13 HORMA domain could function as a phosphoregulated conformational switch.
Conflict of interest statement
The authors declare no conflict of interest.
Figures
Fig. 1.
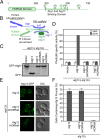
The HORMA Domain of Atg13 is required for autophagy but not for Atg13 localization. (A) Domain representation of S. cerevisiae Atg13. The HORMA domain is labeled and represented as a rounded rectangle. The unstructured region is represented as a straight line. Phosphorylation sites within the unstructured region are indicated. Amino acid numbers corresponding to the boundaries of the HORMA domain and the Atg1/Atg17 binding region are labeled. (B) Schematic of the organization of the Atg1 complex. This complex is a dimer of pentamers, with a single pentamer shown here. The loci of the previously identified PAS scaffolding and protein phosphorylation functions are indicated. The positioning of the HORMA domain identified in this study is highlighted and its PI 3-kinase recruitment activity annotated. (C) GFP-Atg8 processing assay as monitored by Western blot against GFP. The GFP-Atg8 and GFP bands are labeled. (D) Pho8Δ60 assay to monitor autophagy was performed in SMD (white) and SD-N (gray). Samples were normalized to the activity of Atg13 in starved cells. (E) Representative microscopy images of atg13Δ cells transformed with ATG13-GFP, ATG13 ΔHORMA -GFP, and ATG13 HORMA -GFP in the presence of rapamycin treatment. (F) Quantification of the Atg13 puncta from E. A total of three trials with 100 cells counted per trial. Error bars in D and F represent the SD of triplicate experiments.
Fig. 2.
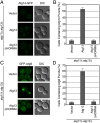
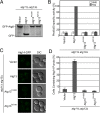
The HORMA domain of Atg13 is necessary for the recruitment of downstream factors in autophagy. (A) Representative microscopy images of atg11Δ atg13Δ ATG14-GFP cells transformed with vector, ATG13, and ATG13 ΔHORMA and treated with rapamycin. (B) Quantification of the Atg14 puncta from A using a brightness threshold of fourfold above the average background fluorescence. A total of three trials with 100 cells counted per trial were made. (C) Representative microscopy images of atg11Δ atg13Δ GFP-ATG8 cells transformed with vector, ATG13, and ATG13 ΔHORMA and treated with rapamycin. (D) Quantification of the Atg8 puncta from C. A total of three trials with 100 cells counted per trial. Error bars in B and D represent the SD of triplicate experiments.
Fig. 3.
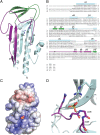
Crystal structure of the Atg13 HORMA domain. (A) Ribbon diagram of the Atg13 HORMA domain. Regions structurally related to MAD2 are colored in cyan except the safety belt region, which is highlighted in purple. β4’, β4’’, and β8’’ of the Atg13 HORMA domain, which are unique to Atg13, are colored in green. (B) Sequence alignment of the Atg13 HORMA domain with the secondary structure elements colored as in A. The two arginine residues located within the sulfate binding site are marked by dots. Species are abbreviated as follows: L. thermotolerans (Lt), Kluyveromyces lactis (Kl), S. cerevisiae (Sc), Schizosaccharomyces pombe (Sp), and Homo sapiens (Hs). (C) Surface representation of the HORMA domain colored according to electrostatic potential, with saturating blue and red at ±7.5 kT/e. The sulfate ion is represented as spheres. (D) Close-up view of the sulfate binding site. The sulfate is coordinated by the side chain of R118 and backbone NH of L208 and L209. Hydrogen bonds are represented as dashed lines. R205 contributes to the overall positive charge of the binding pocket but is not within hydrogen bonding distance.
Fig. 4.
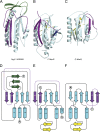
Unexpected structural homology between Atg13 and C-Mad2. (A) Ribbon diagram of the HORMA domain of Atg13 colored as is shown in Fig. 3_A_. (B) Ribbon diagram of the closed state of Mad2 oriented identical to Atg13 in A, with the Mad1 binding peptide shown in dark blue. Regions structurally related to the HORMA domain of Atg13 are colored in cyan except the safety belt region, which is highlighted in purple. Regions unique to Mad2 are colored in yellow. Coordinates taken from Protein Data Bank (PDB) ID 1GO4. (C) Ribbon diagram of the open state of Mad2 oriented identical to Atg13 in A and colored exactly as in B. Coordinates taken from PDB ID 2V64. (D–F) Topology diagrams for the Atg13 HORMA domain (D), closed state of Mad2 (E), and open state of Mad2 (F) colored exactly as in A–C.
Fig. 5.
The putative phosphate sensor of the Atg13 HORMA domain is required for autophagy and PI 3-kinase recruitment. (A) GFP-Atg8 processing assay of _atg11_Δ _atg13_Δ cells transformed with ATG13 wild type and mutants designed to disrupt the putative phosphate binding site. GFP-Atg8 processing was monitored by Western blot against GFP. The GFP-Atg8 and GFP bands are labeled. (B) Pho8Δ60 assay to monitor autophagy was performed in SMD (white) and SD-N (gray) using atg11_Δ_atg13_Δ cells transformed with the same ATG13 constructs as in A. Samples were normalized to the activity of Atg13 in starved cells. (C) Representative images of atg11Δ atg13Δ ATG14-GFP cells transformed with vector, and ATG13 (as shown also in Fig. 2_A) and mutant ATG13 alleles, and treated with rapamycin. (D) Quantification of the Atg14 puncta from C using the procedure described in Fig. 2. A total of three trials with 100 cells counted per trial. Error bars in B and C represent the SD of triplicate experiments.
Similar articles
- ATG13: just a companion, or an executor of the autophagic program?
Alers S, Wesselborg S, Stork B. Alers S, et al. Autophagy. 2014 Jun;10(6):944-56. doi: 10.4161/auto.28987. Autophagy. 2014. PMID: 24879146 Free PMC article. Review. - What the N-terminal domain of Atg13 looks like and what it does: a HORMA fold required for PtdIns 3-kinase recruitment.
Jao CC, Ragusa MJ, Stanley RE, Hurley JH. Jao CC, et al. Autophagy. 2013 Jul;9(7):1112-4. doi: 10.4161/auto.24896. Epub 2013 May 2. Autophagy. 2013. PMID: 23670046 Free PMC article. - Atg13 HORMA domain recruits Atg9 vesicles during autophagosome formation.
Suzuki SW, Yamamoto H, Oikawa Y, Kondo-Kakuta C, Kimura Y, Hirano H, Ohsumi Y. Suzuki SW, et al. Proc Natl Acad Sci U S A. 2015 Mar 17;112(11):3350-5. doi: 10.1073/pnas.1421092112. Epub 2015 Mar 3. Proc Natl Acad Sci U S A. 2015. PMID: 25737544 Free PMC article. - Structure of the Human Atg13-Atg101 HORMA Heterodimer: an Interaction Hub within the ULK1 Complex.
Qi S, Kim DJ, Stjepanovic G, Hurley JH. Qi S, et al. Structure. 2015 Oct 6;23(10):1848-1857. doi: 10.1016/j.str.2015.07.011. Epub 2015 Aug 20. Structure. 2015. PMID: 26299944 Free PMC article. - The HORMA domain: an evolutionarily conserved domain discovered in chromatin-associated proteins, has unanticipated diverse functions.
Muniyappa K, Kshirsagar R, Ghodke I. Muniyappa K, et al. Gene. 2014 Jul 25;545(2):194-7. doi: 10.1016/j.gene.2014.05.020. Epub 2014 May 9. Gene. 2014. PMID: 24814187 Review.
Cited by
- Mec1 regulates PAS recruitment of Atg13 via direct binding with Atg13 during glucose starvation-induced autophagy.
Yao W, Li Y, Chen Y, Chen Y, Zhao P, Zhang Y, Jiang Q, Feng Y, Yang F, Wu C, Zhong H, Zhou Y, Sun Q, Zhang L, Liu W, Yi C. Yao W, et al. Proc Natl Acad Sci U S A. 2023 Jan 3;120(1):e2215126120. doi: 10.1073/pnas.2215126120. Epub 2022 Dec 27. Proc Natl Acad Sci U S A. 2023. PMID: 36574691 Free PMC article. - The machinery of macroautophagy.
Feng Y, He D, Yao Z, Klionsky DJ. Feng Y, et al. Cell Res. 2014 Jan;24(1):24-41. doi: 10.1038/cr.2013.168. Epub 2013 Dec 24. Cell Res. 2014. PMID: 24366339 Free PMC article. Review. - ATG13: just a companion, or an executor of the autophagic program?
Alers S, Wesselborg S, Stork B. Alers S, et al. Autophagy. 2014 Jun;10(6):944-56. doi: 10.4161/auto.28987. Autophagy. 2014. PMID: 24879146 Free PMC article. Review. - Potential ER tubular lumen sensing by intrinsically disordered regions.
Yorimitsu T, Sato K. Yorimitsu T, et al. J Cell Sci. 2025 Mar 1;138(5):JCS263696. doi: 10.1242/jcs.263696. Epub 2025 Mar 12. J Cell Sci. 2025. PMID: 39925135 Free PMC article. - The carboxy terminus of yeast Atg13 binds phospholipid membrane via motifs that overlap with the Vac8-interacting domain.
Gatica D, Damasio A, Pascual C, Klionsky DJ, Ragusa MJ, Popelka H. Gatica D, et al. Autophagy. 2020 Jun;16(6):1007-1020. doi: 10.1080/15548627.2019.1648117. Epub 2019 Aug 2. Autophagy. 2020. PMID: 31352862 Free PMC article.
References
- Nakatogawa H, Suzuki K, Kamada Y, Ohsumi Y. Dynamics and diversity in autophagy mechanisms: Lessons from yeast. Nat Rev Mol Cell Biol. 2009;10(7):458–467. - PubMed
- Rubinsztein DC, Shpilka T, Elazar Z. Mechanisms of autophagosome biogenesis. Curr Biol. 2012;22(1):R29–R34. - PubMed
- Mizushima N, Yoshimori T, Ohsumi Y. The role of Atg proteins in autophagosome formation. Annu Rev Cell Dev Biol. 2011;27:107–132. - PubMed
Publication types
MeSH terms
Substances
LinkOut - more resources
Full Text Sources
Other Literature Sources
Molecular Biology Databases
Research Materials
Miscellaneous
