LIN28 Expression in malignant germ cell tumors downregulates let-7 and increases oncogene levels - PubMed (original) (raw)
. 2013 Aug 1;73(15):4872-84.
doi: 10.1158/0008-5472.CAN-12-2085. Epub 2013 Jun 17.
Harpreet K Saini, Charlotte A Siegler, Jennifer E Hanning, Emily M Barker, Stijn van Dongen, Dawn M Ward, Katie L Raby, Ian J Groves, Cinzia G Scarpini, Mark R Pett, Claire M Thornton, Anton J Enright, James C Nicholson, Nicholas Coleman; CCLG
Affiliations
- PMID: 23774216
- PMCID: PMC3732484
- DOI: 10.1158/0008-5472.CAN-12-2085
LIN28 Expression in malignant germ cell tumors downregulates let-7 and increases oncogene levels
Matthew J Murray et al. Cancer Res. 2013.
Abstract
Despite their clinicopathologic heterogeneity, malignant germ cell tumors (GCT) share molecular abnormalities that are likely to be functionally important. In this study, we investigated the potential significance of downregulation of the let-7 family of tumor suppressor microRNAs in malignant GCTs. Microarray results from pediatric and adult samples (n = 45) showed that LIN28, the negative regulator of let-7 biogenesis, was abundant in malignant GCTs, regardless of patient age, tumor site, or histologic subtype. Indeed, a strong negative correlation existed between LIN28 and let-7 levels in specimens with matched datasets. Low let-7 levels were biologically significant, as the sequence complementary to the 2 to 7 nt common let-7 seed "GAGGUA" was enriched in the 3' untranslated regions of mRNAs upregulated in pediatric and adult malignant GCTs, compared with normal gonads (a mixture of germ cells and somatic cells). We identified 27 mRNA targets of let-7 that were upregulated in malignant GCT cells, confirming significant negative correlations with let-7 levels. Among 16 mRNAs examined in a largely independent set of specimens by quantitative reverse transcription PCR, we defined negative-associations with let-7e levels for six oncogenes, including MYCN, AURKB, CCNF, RRM2, MKI67, and C12orf5 (when including normal control tissues). Importantly, LIN28 depletion in malignant GCT cells restored let-7 levels and repressed all of these oncogenic let-7 mRNA targets, with LIN28 levels correlating with cell proliferation and MYCN levels. Conversely, ectopic expression of let-7e was sufficient to reduce proliferation and downregulate MYCN, AURKB, and LIN28, the latter via a double-negative feedback loop. We conclude that the LIN28/let-7 pathway has a critical pathobiologic role in malignant GCTs and therefore offers a promising target for therapeutic intervention.
©2013 AACR.
Figures
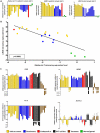
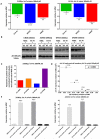
Figure-1. Let-7 and LIN28 expression in malignant-GCTs
A) The left and middle panels respectively show median levels of all nine let-7 family members and levels of LIN28 in the 20 samples from set-1 with matching microRNA and mRNA data. The right panel shows levels of LIN28 in sample set-2. B) Linear-regression analysis of median let-7 family levels versus LIN28 levels in the set-1 samples with matching data. In A) and B), all values are referenced to the mean of the normal gonadal samples. C) qRT-PCR validation in sample set-3, referenced to the pooled normal gonadal control sample. Error-bars= standard error of the mean (SEM). For one sample (asterisked) there was insufficient RNA for let-7e quantification. The color-code for all panels is shown in the key. For details of the normal gonadal controls, see Materials and Methods.
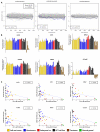
Figure-2. Significance of let-7 down-regulation in malignant-GCTs
A) Sylamer landscape plots for SCR words corresponding to the common seed of the nine let-7 microRNA family members in the combined analysis of pediatric (set-1) and adult (set-2) malignant-GCTs. Log10-transformed _p_-values for each SCR word are plotted on the _y_-axis, against the ranked gene list on the _x_-axis. A negative _y_-axis deflection on the right-hand side of the plot signifies SCR enrichment in up-regulated genes. The left-hand plot shows data for the hexamer complementary to the core 2-7nt component of the common seed-region, the central plot the two heptamers (1-7nt; 2-8nt), and the right-hand plot the octamer (1-8nt). The single summed significance score and _p_-value for all four SCR words is shown. B) Levels of the six selected let-7 mRNA targets in sample set-3, determined by qRT-PCR. Error-bars=SEM. C) Correlations between each mRNA and let-7e in set-3. _P_-values were determined by linear-regression.
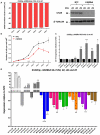
Figure-3. LIN28 depletion in 2102Ep malignant-GCT cells
A) Depletion of LIN28, measured by qRT-PCR over d1-d7 (left) and by Western blot over d3-d5 (right). NTC=non-targeting-control siRNA, kd=knockdown. B) Cell numbers following LIN28 depletion. C) Levels of let-7e over d1-d7 following LIN28 depletion. In A) to C), statistical comparisons are versus NTC-treated cells. d=day. D) Levels of let-7 family members (let-7b, let-7d and let-7e) and the six selected let-7 mRNA targets at d2, d4 and d7 following LIN28 depletion. Expression values are referenced to NTC-treated cells. Statistical comparisons are for _LIN28_kd cells at d4 and d7, versus _LIN28_kd cells at d2. Error-bars=SEM. In panels B, C and D, *=p<0.05;**=p<0.005;***=_p_≤0.0001.
Figure-4. Correlations between LIN28, MYCN and cell numbers following LIN28 depletion
The graphs show data for all four malignant-GCT cell-lines at d4 following LIN28 depletion, compared with NTC-treated cells. Panel A shows cell numbers versus the levels of LIN28 (red) and MYCN (blue), while panel B shows levels of MYCN versus LIN28. NTC=non-targeting-control siRNA, kd=knockdown. Correlation _p_-values were determined by linear-regression. Error-bars=SEM.
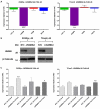
Figure-5. LIN28B depletion in malignant-GCT cells
A) Cell numbers and qRT-PCR expression levels of LIN28B, LIN28 and MYCN on d4 following LIN28B depletion in 2102Ep (left) and TCam2 (right). B) Western blots showing expression of LIN28B on d4 following LIN28B depletion in 2102Ep (left) and TCam2 (right), compared with NTC-treated cells. C) Levels of representative let-7 family members (let-7b, let-7d and let-7e) on d4 following LIN28B depletion in 2102Ep (left) and TCam2 (right). All values are referenced to NTC-treated cells. NTC=non-targeting-control siRNA, kd=knockdown, error-bars=SEM. *=p<0.05;**=p<0.005;***=_p_≤0.0001.
Figure-6. Effects of let-7e mimic in malignant-GCT cells
A) Cell numbers and expression levels of MYCN and LIN28 in 2102Ep (left) and 1411H (right), at d2 post-transfection of let-7e mimic, relative to cells treated with mimic-negative-control (MNC) RNA. B) Western blots showing expression of LIN28, AURKB, MYCN and LIN28B proteins at d2 and d3 following let-7e mimic transfection of 2102Ep cells, corresponding to Supplementary Figure-S9A. The lower row shows the beta-tubulin loading-control. C) The graph shows protein levels at d3, as determined by densitometry of the western blots shown in B), normalized to beta-tubulin and referenced to MNC-treated cells. D) Cell numbers versus let-7e levels at d2 in four different malignant-GCT cell-lines, compared to MNC-treated cells. The _p_-value was determined by linear-regression. E) Levels of other representative let-7 family members (let-7b and let-7d) and control miR-492, at d2 following let-7e transfection in 2102Ep (left) and 1411H (right), relative to MNC-treated cells.
Figure-7. Luciferase assay confirmation of let-7 targets in malignant-GCT cells
Luciferase assay data at d2 for 2102Ep cells transfected with a reporter containing the full-length 3′UTR for LIN28 (red), MYCN (blue) or AURKB (orange). Cells were also transfected with either let-7e or let-7e-mutant (let-7e-mut). Luminescence values were normalized to cells treated with non-targeting oligonucleotides (NT2), then referenced to cells containing a no 3′UTR control reporter and treated with let-7e/let-7e-mutant, as appropriate. Error-bars=SEM. All correlation _p_-values were determined by linear-regression. *=p<0.05;**=p<0.005;***=_p_≤0.0001.
Similar articles
- Biology of childhood germ cell tumours, focussing on the significance of microRNAs.
Murray MJ, Nicholson JC, Coleman N. Murray MJ, et al. Andrology. 2015 Jan;3(1):129-39. doi: 10.1111/andr.277. Epub 2014 Oct 9. Andrology. 2015. PMID: 25303610 Free PMC article. Review. - Malignant germ cell tumors display common microRNA profiles resulting in global changes in expression of messenger RNA targets.
Palmer RD, Murray MJ, Saini HK, van Dongen S, Abreu-Goodger C, Muralidhar B, Pett MR, Thornton CM, Nicholson JC, Enright AJ, Coleman N; Children's Cancer and Leukaemia Group. Palmer RD, et al. Cancer Res. 2010 Apr 1;70(7):2911-23. doi: 10.1158/0008-5472.CAN-09-3301. Epub 2010 Mar 23. Cancer Res. 2010. PMID: 20332240 Free PMC article. - A novel C19MC amplified cell line links Lin28/let-7 to mTOR signaling in embryonal tumor with multilayered rosettes.
Spence T, Perotti C, Sin-Chan P, Picard D, Wu W, Singh A, Anderson C, Blough MD, Cairncross JG, Lafay-Cousin L, Strother D, Hawkins C, Narendran A, Huang A, Chan JA. Spence T, et al. Neuro Oncol. 2014 Jan;16(1):62-71. doi: 10.1093/neuonc/not162. Epub 2013 Dec 4. Neuro Oncol. 2014. PMID: 24311633 Free PMC article. - The two most common histological subtypes of malignant germ cell tumour are distinguished by global microRNA profiles, associated with differential transcription factor expression.
Murray MJ, Saini HK, van Dongen S, Palmer RD, Muralidhar B, Pett MR, Piipari M, Thornton CM, Nicholson JC, Enright AJ, Coleman N. Murray MJ, et al. Mol Cancer. 2010 Nov 8;9:290. doi: 10.1186/1476-4598-9-290. Mol Cancer. 2010. PMID: 21059207 Free PMC article. - The LIN28/let-7 Pathway in Cancer.
Balzeau J, Menezes MR, Cao S, Hagan JP. Balzeau J, et al. Front Genet. 2017 Mar 28;8:31. doi: 10.3389/fgene.2017.00031. eCollection 2017. Front Genet. 2017. PMID: 28400788 Free PMC article. Review.
Cited by
- Development of miRNA-based PROTACs targeting Lin28 for breast cancer therapy.
Xu J, Zhao X, Liang X, Guo D, Wang J, Wang Q, Tang X. Xu J, et al. Sci Adv. 2024 Sep 20;10(38):eadp0334. doi: 10.1126/sciadv.adp0334. Epub 2024 Sep 18. Sci Adv. 2024. PMID: 39292784 Free PMC article. - RNA-binding proteins and exoribonucleases modulating miRNA in cancer: the enemy within.
Seo Y, Rhim J, Kim JH. Seo Y, et al. Exp Mol Med. 2024 May;56(5):1080-1106. doi: 10.1038/s12276-024-01224-z. Epub 2024 May 1. Exp Mol Med. 2024. PMID: 38689093 Free PMC article. Review. - Targeting oncogenic microRNAs from the miR-371~373 and miR-302/367 clusters in malignant germ cell tumours causes growth inhibition through cell cycle disruption.
Bailey S, Ferraresso M, Alonso-Crisostomo L, Ward D, Smith S, Nicholson JC, Saini H, Enright AJ, Scarpini CG, Coleman N, Murray MJ. Bailey S, et al. Br J Cancer. 2023 Oct;129(9):1451-1461. doi: 10.1038/s41416-023-02453-1. Epub 2023 Oct 3. Br J Cancer. 2023. PMID: 37789102 Free PMC article. - Lin28B overexpression decreases let-7b and let-7g levels and increases proliferation and estrogen secretion in Dolang sheep ovarian granulosa cells.
Sui Z, Zhang Y, Zhang Z, Wang C, Li X, Xing F. Sui Z, et al. Arch Anim Breed. 2023 Jul 28;66(3):217-224. doi: 10.5194/aab-66-217-2023. eCollection 2023. Arch Anim Breed. 2023. PMID: 37560354 Free PMC article. - Epigenetic Regulation of Driver Genes in Testicular Tumorigenesis.
von Eyben FE, Kristiansen K, Kapp DS, Hu R, Preda O, Nogales FF. von Eyben FE, et al. Int J Mol Sci. 2023 Feb 19;24(4):4148. doi: 10.3390/ijms24044148. Int J Mol Sci. 2023. PMID: 36835562 Free PMC article. Review.
References
- Murray MJ, Nicholson JC. Germ Cell Tumours in Children and Adolescents. Paediatrics and Child Health. 2010;20:109–16.
- Huyghe E, Matsuda T, Thonneau P. Increasing incidence of testicular cancer worldwide: a review. J Urol. 2003;170:5–11. - PubMed
- Lewis BP, Shih IH, Jones-Rhoades MW, Bartel DP, Burge CB. Prediction of mammalian microRNA targets. Cell. 2003;115:787–98. - PubMed
- Lewis BP, Burge CB, Bartel DP. Conserved seed pairing, often flanked by adenosines, indicates that thousands of human genes are microRNA targets. Cell. 2005;120:15–20. - PubMed
Publication types
MeSH terms
Substances
LinkOut - more resources
Full Text Sources
Other Literature Sources
Research Materials
Miscellaneous
