Spatial sequestration of misfolded proteins by a dynamic chaperone pathway enhances cellular fitness during stress - PubMed (original) (raw)
. 2013 Oct;15(10):1231-43.
doi: 10.1038/ncb2838. Epub 2013 Sep 15.
Affiliations
- PMID: 24036477
- PMCID: PMC4121856
- DOI: 10.1038/ncb2838
Spatial sequestration of misfolded proteins by a dynamic chaperone pathway enhances cellular fitness during stress
Stéphanie Escusa-Toret et al. Nat Cell Biol. 2013 Oct.
Abstract
The extensive links between proteotoxic stress, protein aggregation and pathologies ranging from ageing to neurodegeneration underscore the importance of understanding how cells manage protein misfolding. Using live-cell imaging, we determine the fate of stress-induced misfolded proteins from their initial appearance until their elimination. Upon denaturation, misfolded proteins are sequestered from the bulk cytoplasm into dynamic endoplasmic reticulum (ER)-associated puncta that move and coalesce into larger structures in an energy-dependent but cytoskeleton-independent manner. These puncta, which we name Q-bodies, concentrate different misfolded and stress-denatured proteins en route to degradation, but do not contain amyloid aggregates, which localize instead to the insoluble protein deposit compartment. Q-body formation and clearance depends on an intact cortical ER and a complex chaperone network that is affected by rapamycin and impaired during chronological ageing. Importantly, Q-body formation enhances cellular fitness during stress. We conclude that spatial sequestration of misfolded proteins in Q-bodies is an early quality control strategy occurring synchronously with degradation to clear the cytoplasm of potentially toxic species.
Figures
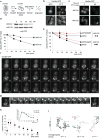
Figure 1. Misfolded proteins are sequestered in Q-bodies upon heat stress
(a) Ubc9ts-GFP fate upon heat stress. (b) Ubc9ts-GFP expressed in WT cells at 28°C was shifted for 15 min at 37°C. GFP (upper panel) and DIC (lower panel) are shown. Scale bars equal 1.5 μm. (c) pdr5Δ cells expressing Ubc9ts-GFP were grown at 28°C in galactose medium and shifted to 37°C in glucose medium with (+) or without (-) 100 μM MG132. Images show Ubc9ts-GFP at the shift (t=0) and after 60 min (t=60). Dotted lines highlight cell outlines. Scale bar equals 1μm. (d) As in c, Ubc9ts-GFP was immunoblotted with anti-GFP antibodies and quantified as the relative ratio to the initial amount for each condition. Results represent mean and Standard Deviation (SD) of three independent experiments. (e) _pdr5_Δ and _pdr5_Δ_atg8_Δ cells expressing Ubc9ts-GFP were grown as in c. Ubc9ts-GFP was immunoblotted with anti-GFP antibodies (Fig. S1b) and quantified relative to the initial amount for each condition. Results represent mean and SD of three independent experiments. (f) WT cells expressing Ubc9ts-GFP at 28°C in galactose medium were shifted at 37°C in glucose medium. Time series images show GFP signal in a cell 1 min (1′) to 30 min (30′) after the shift (video S1). Scale bar equals1 μm. (g) Inset in f, highlights the coalescence of Ubc9ts-GFP Q-bodies (arrows), from 10 to 13 min after the shift. (h) Number of puncta in the medial focal plane over time in WT (main panel; puncta assessed from a total population of n=63 cells over three independent experiments, 1 field counted per experiment) or in _pdr5_Δ cells (puncta assessed from a total population of n=36 cells over three independent experiments, 1 field counted per experiment) with or without MG132 (secondary panel). Results represent mean of puncta for n cells and SD. (**) p<0.005, compared to untreated cells for the same indicated time. (i) Trajectories of three Ubc9-GFP Q-bodies in WT cells. Positions of particles are represented from each frame of a movie (1 frame/15 sec) at the medial focal plane. Consecutive positions are connected by lines: black, before coalescence; grey, after coalescence. Green and red dots indicate the initial and final positions, respectively. Initial, final and coalescing times are indicated, and average speed (+/- SD) over the entire trajectory.
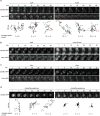
Figure 2. Energy dependence but cytoskeleton independence of Q-body dynamics
(a) WT cells expressing Ubc9ts-GFP or Abp1-GFP (lower panel) were grown at 28°C in galactose medium and treated with (right panel) or without (left panel) 200 μM Latrunculin A (LatA) for 10 min prior to a shift to 37°C in glucose medium. 5 min series of images show Ubc9ts-GFP or Abp1-GFP signal (video S2). Scale bars equal 1 μm. Trajectories of three Ubc9-GFP puncta in WT cells with or without LatA are represented (lower panel) as described in Fig. 1i. (b) WT cells expressing Ubc9ts-GFP and Abp1-GFP were grown as in a but treated with (right panel) or without (left panel) LatA for 2h prior to the shift. Scale bars equal 1 μm. (c) WT cells expressing Ubc9ts-GFP or Tub1-GFP were grown as in a but treated with (lower panel) or without (upper panel) 15 μg/ml Nocodazole (Noc) for 10 min prior to the shift. 5 min series of images show Ubc9ts-GFP or Tub1-GFP signal. Scale bars equal 1 μm. (d) WT cells expressing Ubc9ts-GFP were grown as in a but treated for 30 min with (right panel) or without (left panel) 10 mM azide and deoxyglucose prior to the shift. 5 min series of images show Ubc9ts-GFP signal (video S3). Scale bars equal 1 μm. Trajectories of three Ubc9-GFP puncta in cells with and without azide and deoxyglucose treatment are represented (lower panel) as described in Fig. 1i.
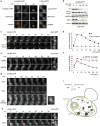
Figure 3. Q-body dynamics relies on an intact cortical ER
(a) Cells expressing Npl3-RFP and Ubc9ts-GFP were imaged after 10 min at 37°C. Two-color deconvolved images show Npl3-RFP signal (nucleus) in red and Ubc9ts-GFP signal in green. Scale bar equals 1 μm. (b) Cells expressing Hmg1-GFP (perinuclear ER, green) and Ubc9ts-CHFP (red) were imaged as in a. Arrow indicates Q-body in proximity to the ER. Scale bar equals 1 μm. (c) Cells expressing Rtn1-GFP and Ubc9ts-CHFP were imaged after 10 min at 37°C. Two-color images of three Z-focal plans (0.2 μm intervals) show Rtn1-GFP signal (cortical ER) in green and Ubc9ts-CHFP signal in red (video S4). Arrows indicate Q-bodies in proximity to the cortical ER. Scale bar equals1 μm. (d) Inset from c representing a series of 0.2 μm Z-section. Scale bar equals 1 μm. (e) Ubc9ts-GFP was expressed in WT and _rnt1_Δ_rtn2_Δ_yop1_Δ cells at 28°C in galactose medium and shifted at 37°C in glucose medium. 5 min series of images show Ubc9ts-GFP signal over 30 min. Scale bars equal 1 μm. (f) As in e, cells were harvested at indicated time from the shift and Ubc9ts-GFP was immunoblotted with anti-GFP antibodies. Ubc9ts-GFP was quantified as the relative ratio to the initial amount from one experiment representative of four independent experiments. (g) Schematic of ER-associated Q-body processing of misfolded Ubc9ts (red star). Green represents the ER network throughout the cell.
Figure 4. The maturation and degradation of Q-bodies rely on the Hsp70-Hsp90 system
(a) WT cells co-expressing GFP-Ssa1 and Ubc9ts-CHFP, or GFP-Ssa1 and Ubc9-CHFP, were grown at 28°C in galactose medium and shifted to 37°C in glucose medium. Two-color images show GFP-Ssa1 signal in green and Ubc9ts-CHFP signal in red at 0, 30 and 60 min after the shift. Scale bars equal 1.5 μm. (b) Cells expressing Ubc9ts-GFP at 28°C in galactose medium were shifted at 37°C (t=0) in glucose medium. Cells were harvested at indicated times and Ubc9ts-GFP immunoblotted using anti-GFP antibodies. (c) Ubc9ts-GFP was expressed in WT and _ssa1_Δ_ssa2_Δ cells at 28°C in galactose medium and shifted at 37°C in glucose medium. 5 min series of images show Ubc9ts-GFP signal over 30 min (i). Cells expressing Ubc9-GFP were similarly prepared and imaged 15 min after the shift (ii). Scale bars represent 1 μm. (d) Average number of puncta per cell in WT (black squares) and _ssa1_Δ_ssa2_Δ (blue diamonds) cells over time. Puncta assessed from a total population of n=35 cells over three independent experiments (1 field counted per experiment).(**) p<0.005 compared to WT for the same indicated time. (e) WT and hsp82ts cells expressing Ubc9ts-GFP or Ubc9-GFP were prepared and imaged as in c. Scale bars represent 1 μm. (f) Average number of puncta per cell in WT (black triangles) and hsp82ts (red diamonds) cells over time. Puncta assessed from a total population of n=25 cells over two independent experiments (1 field counted per experiment).(*) p<0.05 (**) p<0.005 compared to WT for the same indicated time. (g) _ydj1_Δ strains expressing Ubc9ts-GFP alone, and in combination with YDJ1, ydj1(C406S) or empty vector was prepared and imaged as in c. Shown an inset of a ydj1(C406S)-expressing cell. Scale bars represent 1 μm. (h) WTor_sse1_Δ cells expressing Ubc9ts-GFP or Ubc9-GFP were prepared and imaged as in c. Scale bars represent 1 μm. (i) Role of the Hsp70-Hsp90-Hsp110 system in Q-bodies pathway for misfolded Ubc9ts (red star). Green represents the ER network throughout the cell.
Figure 5. Balance between addition and dissolution activities controls Q-body dynamics
(a) Cells expressing Hsp104-GFP and Ubc9ts-CHFP or Ubc9-GFP were grown at 28°C in galactose medium and shifted at 37°C in glucose medium. 5 min series of a two-color movie show Hsp104-GFP signal in green and Ubc9ts-CHFP signal in red over 60 min (i). Cells expressing Hsp104-GFP and Ubc9-CHFP were imaged 15 min after the shift (ii). Scale bar equals 1 μm. (b) As in a, but cells were imaged 10 min after the shift. Two-color deconvolved images show Hsp104-GFP signal in green and Ubc9ts-CHFP or Ubc9-CHFP signal in red. Scale bars represent 1 μm. (c) Cells expressing Hsp42-GFP (green) and Ubc9ts-CHFP or Ubc9-CHFP (red) were imaged as in b. Scale bars equal 1 μm. (d) WT, _hsp104_Δ, _hsp42_Δ, and _hsp26_Δ cells expressing Ubc9ts-GFP (i) or Ubc9-GFP (ii) were prepared as in a. 5 min series of images show Ubc9ts-GFP signal over 30 min. Ubc9-GFP signal is shown 15 min after the shift. Scale bars represent 1 μm. (e) Average number of puncta per cell in the WT (black squares), _hsp104_Δ (orange diamonds), _hsp26_Δ (gray circles) strains over time. Puncta assessed from a total population of n=35 cells over three independent experiment (1 field counted per experiment). (*) p<0.05 (**) p<0.005 compared to WT for the same indicated time. (f) Indicated strains expressing Ubc9ts-GFP were grown as in a and harvested at indicated times from the shift (t=0). Ubc9ts-GFP was immunoblotted using anti-GFP antibodies. (g) WT and _hsp42_Δ_hsp104_Δ cells expressing Ubc9ts-GFP and Ubc9-GFP were prepared and imaged as in d. Scale bars represent 1 μm. (h) WT and the _hsp42_Δ_sse1_Δ cells expressing Ubc9ts-GFP and Ubc9-GFP were prepared and imaged as in d. Scale bars represent 1 μm. (i) Dissolution-addition balance between Hsp104 and Hsp42: Q-body coalescence results from an Hsp104-mediated process of dissolution followed by Hsp42 stimulated re-addition of the released misfolded protein into existing inclusions.
Figure 6. Different types of misfolded proteins, but not amyloids, are processed together through the Q-body pathway
(a) WT cells expressing Ubc9ts-GFP and CHFP-VHL was grown at 28°C in galactose medium and imaged at 37°C in glucose medium. 5 min series of images show Ubc9ts-GFP signal in green and CHFP-VHL signal in red (i). Cells expressing Ubc9-GFP and CHFP-VHL were similarly prepared and imaged 15 min after the shift (ii). Scale bar equals 1 μm. (b) 15 sec interval series of an inset from cell represented in a (top panel) and from a cell co-expressing Luc-GFP and Ubc9-CHFP (bottom panel, and Fig. S5a). Scale bars equal 1 μm (c). WT cells expressing Htt-Q97-CHFP (red) and Ubc9ts-GFP (green) were prepared and imaged as in a. Scale bar equals 1 μm. (d) 15 sec interval series of an inset from cell represented in c (bottom panel) and from a cell co-expressing GFP-VHL and Rnq1-CHFP (top panel, and Fig. S5c). Scale bars equal 1 μm. (e) Two-color Z-stack projection of cells expressing both Htt-Q97-GFP (in green) and Rnq1-CHFP (in red). Scale bar equals 1 μm. (f) GFP signal of WT, _ssa1_Δ_ssa2_Δ, _hsp42_Δ, _hsp104_Δ cells expressing Ubc9ts-GFP or Luc-GFP at 37°C; or Htt-Q97-GFP or Rnq1-GFP at 28°C. Scale bars equal 1 μm.(g-h) Percentages of cells with puncta from a population analyzed in f. Respective total population sizes for WT, ssa1ssa2, hsp42, and hsp104 cells are [ (g): orange n=(2418, 375, 3013, 591) cells; yellow n=(1035, 472, 442, 681) cells; (h): purple, n=(971, 519, 1047, 617) cells; green n=(1165, 410, 1235, 853) cells] over three independent experiments.(6 fields counted per experiment) (*) p<0.05 (**) p<0.005 compared to WT for the same indicated time.
Figure 7. The Q-body pathway responds to proteotoxic stress, chronologic aging and nutrient signaling
(a) Ubc9ts-GFP-expressing cells were grown at 28°C in galactose medium and Hsp104-GFP-expressing at 28°C in glucose medium. Cells were imaged at 28°C in glucose medium after a 10 min treatment with 10% ethanol (EtOH), 30 min treatment with 5 mg/mL AZC, or at 37°C with no treatment. GFP signal is shown in 5 min series movies over 30 min. Scale bars equal 1 μm. (b) Cells expressing Ubc9ts-GFP (i) or Hsp104-GFP (ii) were grown at 28°C for 5 hrs (young) or for 3 days (aged) and imaged at 37°C. GFP signal is shown in 5 min series movies. Scale bars equal 1 μm. (c) Ubc9ts-GFP-expressing cells were grown at 28°C in galactose medium and imaged at 37°C in glucose medium in the absence (-) or presence (+) of 0.2 μg/mL rapamycin 10 min prior the shift. GFP signal is shown in 5 min series movies over 30 min. Scale bars equal 1 μm. (d) Quantification of the average number of puncta per cell in untreated (-, circles) or rapamycin-treated (+, triangles) cells over time as presented in c. Puncta assessed from a total population of n=40 cells over three independent experiment (3 fields counted per experiment).(*) p<0.05 (**) p<0.005 compared to untreated cells for the same indicated time.
Figure 8. Fitness advantage of spatial sequestration of misfolded proteins in Q-bodies
(a) Schematic of competition assay; [KanS], kanamycin-sensitive phenotype; [KanR], kanamycin-resistant phenotype. (b) Percentage of KanR _hsp26_Δ colony-forming units (CFU) over KanS WT CFU was quantified at 0 and 5 days. (c-d) Percentage of KanR _hsp42_Δ CFU (c) or _hsp104_Δ CFU (d) over KanS WT CFU was quantified over time at 28°C (left panels) or 37°C (right panels). Data represent three independent experiments (n = 350 CFU for each day of the experiment).
Comment in
- Protein folding: Misfolded proteins join the Q.
Wrighton KH. Wrighton KH. Nat Rev Mol Cell Biol. 2013 Oct;14(10):608. doi: 10.1038/nrm3668. Nat Rev Mol Cell Biol. 2013. PMID: 24061221 No abstract available.
Similar articles
- Spatially organized aggregation of misfolded proteins as cellular stress defense strategy.
Miller SB, Mogk A, Bukau B. Miller SB, et al. J Mol Biol. 2015 Apr 10;427(7):1564-74. doi: 10.1016/j.jmb.2015.02.006. Epub 2015 Feb 11. J Mol Biol. 2015. PMID: 25681695 Review. - Endoplasmic reticulum associated protein degradation: a chaperone assisted journey to hell.
Stolz A, Wolf DH. Stolz A, et al. Biochim Biophys Acta. 2010 Jun;1803(6):694-705. doi: 10.1016/j.bbamcr.2010.02.005. Epub 2010 Feb 25. Biochim Biophys Acta. 2010. PMID: 20219571 Review. - Yeast derlin Dfm1 employs a chaperone-like function to resolve misfolded membrane protein stress.
Kandel R, Jung J, Syau D, Kuo T, Songster L, Horn C, Chapman C, Aguayo A, Duttke S, Benner C, Neal SE. Kandel R, et al. PLoS Biol. 2023 Jan 23;21(1):e3001950. doi: 10.1371/journal.pbio.3001950. eCollection 2023 Jan. PLoS Biol. 2023. PMID: 36689475 Free PMC article. - Spatial sequestration of misfolded proteins as an active chaperone-mediated process during heat stress.
Boronat S, Cabrera M, Hidalgo E. Boronat S, et al. Curr Genet. 2021 Apr;67(2):237-243. doi: 10.1007/s00294-020-01135-2. Epub 2021 Jan 1. Curr Genet. 2021. PMID: 33386485 Review. - Accumulation of misfolded protein aggregates leads to the formation of russell body-like dilated endoplasmic reticulum in yeast.
Umebayashi K, Hirata A, Fukuda R, Horiuchi H, Ohta A, Takagi M. Umebayashi K, et al. Yeast. 1997 Sep 15;13(11):1009-20. doi: 10.1002/(SICI)1097-0061(19970915)13:11<1009::AID-YEA157>3.0.CO;2-K. Yeast. 1997. PMID: 9290205
Cited by
- Wine Yeast Cells Acquire Resistance to Severe Ethanol Stress and Suppress Insoluble Protein Accumulation during Alcoholic Fermentation.
Yoshida M, Furutani N, Imai F, Miki T, Izawa S. Yoshida M, et al. Microbiol Spectr. 2022 Oct 26;10(5):e0090122. doi: 10.1128/spectrum.00901-22. Epub 2022 Aug 30. Microbiol Spectr. 2022. PMID: 36040149 Free PMC article. - Kinetics of Formation and Asymmetrical Distribution of Hsp104-Bound Protein Aggregates in Yeast.
Paoletti C, Quintin S, Matifas A, Charvin G. Paoletti C, et al. Biophys J. 2016 Apr 12;110(7):1605-1614. doi: 10.1016/j.bpj.2016.02.034. Biophys J. 2016. PMID: 27074685 Free PMC article. - Prion Aggregates Are Recruited to the Insoluble Protein Deposit (IPOD) via Myosin 2-Based Vesicular Transport.
Kumar R, Nawroth PP, Tyedmers J. Kumar R, et al. PLoS Genet. 2016 Sep 30;12(9):e1006324. doi: 10.1371/journal.pgen.1006324. eCollection 2016 Sep. PLoS Genet. 2016. PMID: 27689885 Free PMC article. - Localized Proteasomal Degradation: From the Nucleus to Cell Periphery.
Guo X. Guo X. Biomolecules. 2022 Jan 29;12(2):229. doi: 10.3390/biom12020229. Biomolecules. 2022. PMID: 35204730 Free PMC article. Review. - Sorting out the trash: the spatial nature of eukaryotic protein quality control.
Sontag EM, Vonk WIM, Frydman J. Sontag EM, et al. Curr Opin Cell Biol. 2014 Feb;26:139-146. doi: 10.1016/j.ceb.2013.12.006. Epub 2014 Jan 23. Curr Opin Cell Biol. 2014. PMID: 24463332 Free PMC article. Review.
References
- Balch WE, Morimoto RI, Dillin A, Kelly JW. Adapting proteostasis for disease intervention. Science. 2008;319:916–919. - PubMed
- Chiti F, Dobson CM. Protein misfolding, functional amyloid, and human disease. Annual Review of Biochemistry. 2006;75:333–366. - PubMed
Publication types
MeSH terms
Substances
LinkOut - more resources
Full Text Sources
Other Literature Sources
Molecular Biology Databases
Research Materials


