IL-10 Controls Early Microglial Phenotypes and Disease Onset in ALS Caused by Misfolded Superoxide Dismutase 1 - PubMed (original) (raw)
IL-10 Controls Early Microglial Phenotypes and Disease Onset in ALS Caused by Misfolded Superoxide Dismutase 1
Mathieu Gravel et al. J Neurosci. 2016.
Abstract
While reactive microgliosis is a hallmark of advanced stages of amyotrophic lateral sclerosis (ALS), the role of microglial cells in events initiating and/or precipitating disease onset is largely unknown. Here we provide novel in vivo evidence of a distinct adaptive shift in functional microglial phenotypes in preclinical stages of superoxide dismutase 1 (SOD1)-mutant-mediated disease. Using a mouse model for live imaging of microglial activation crossed with SOD1(G93A) and SOD1(G37R) mouse models, we discovered that the preonset phase of SOD1-mediated disease is characterized by development of distinct anti-inflammatory profile and attenuated innate immune/TLR2 responses to lipopolysaccharide (LPS) challenge. This microglial phenotype was associated with a 16-fold overexpression of anti-inflammatory cytokine IL-10 in baseline conditions followed by a 4.5-fold increase following LPS challenge. While infusion of IL-10R blocking antibody, initiated at day 60, caused a significant increase in markers of microglial activation and precipitated clinical onset of disease, a targeted overexpression of IL-10 in microglial cells, delivered via viral vectors expressed under CD11b promoter, significantly delayed disease onset and increased survival of SOD1(G93A) mice. We propose that the high IL-10 levels in resident microglia in early ALS represent a homeostatic and compensatory "adaptive immune escape" mechanism acting as a nonneuronal determinant of clinical onset of disease. Significance statement: We report here for the first time that changing the immune profile of brain microglia may significantly affect clinical onset and duration of disease in ALS models. We discovered that in presymptomatic disease microglial cells overexpress anti-inflammatory cytokine IL-10. Given that IL-10 is major homeostatic cytokine and its production becomes deregulated with aging, this may suggest that the capacity of microglia to adequately produce IL-10 may be compromised in ALS. We show that blocking IL-10 increased inflammation and precipitated clinical disease onset, whereas overexpression of IL-10 in microglia using a gene therapy approach significantly delayed disease onset and increased survival of ALS mice. Based on our results, we propose that targeted overexpression of IL-10 in microglia may have therapeutic potential in ALS.
Keywords: ALS; TLR2; biophotonics; innate immunity; microglia; transgenic mice.
Copyright © 2016 the authors 0270-6474/16/361031-18$15.00/0.
Figures
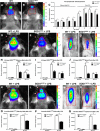
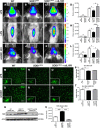
Figure 1.
In vivo biophotonic/bioluminescence imaging of TLR2-SOD1 mice. A, B, Representative real-time imaging of the TLR2 induction in TLR2-WT controls (A) and TLR2-SOD1G93A double-transgenic mice (B) at 20 weeks of age (color scales represent photons/second). C, The longitudinal quantitative analysis of the total photon emissions from olfactory bulb and brain ROIs at various time points shows a reduced TLR2 activation in presymptomatic SOD1G93A mice (n between 10 and 20 mice per group per time point; p < 0.05 for all time points). D–G, Real-time imaging of the TLR2 response following LPS stimulation in presymptomatic (60 d) SOD1G93A mice shows a significant reduction in TLR2 activation in the SOD1G93A mice compared to WT littermates. H–J, Photonic quantification from the olfactory bulb ROI 24 h after LPS stimulation (WT, n = 4; SOD1G93A, n = 8; p = 0.0006) and 48 h after LPS (WT, n = 5; SOD1G93A, n = 4; p = 0.0269; H), from the brain ROI 24 h after LPS (WT, n = 4; SOD1G93A, n = 8; p = 0.0065) and 48 h after LPS (WT, n = 4; SOD1G93A, n = 5; I), and from lumbar spinal cord ROI 24 h after LPS (WT, n = 5; SOD1G93A, n = 5; p = 0.0181) and 48 h after LPS (WT, n = 4; SOD1G93A, n = 5; J). K–N, Real-time imaging of the TLR2 response following LPS stimulation in presymptomatic (4 month) SOD1G37R mice show a similarly significant reduction of TLR2 activation. O–Q, Photonic quantification from the olfactory bulb ROI 24 h after LPS stimulation (WT, n = 4; SOD1G37R, n = 2; p = 0.0114; O), from the brain ROI 24 h after LPS (WT, n = 4; SOD1G37R, n = 4; p = 0.0347; P), and from the lumbar spinal cord ROI 24 h after LPS (WT; n = 4, SOD1G37R; n = 4; p = 0.0217; Q). Error bars indicate SEM.
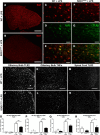
Figure 2.
Immunofluorescence and in situ hybridization analysis. A, B, Immunofluorescence of Iba1 staining in the olfactory bulb of WT littermates controls (A) and presymptomatic 60-d-old SOD1G93A mice (B) 24 h after an LPS stimulation. C–H, Higher magnification of Iba1 staining in the olfactory bulb of WT controls (C) and SOD1G93A mice (F), TLR2 staining (D, G), and a merge showing the colocalization of both stainings (E, H). K–N, Representative photomicrographs of the in situ hybridization of the TLR2 expression 24 h after LPS stimulation in the olfactory bulb of WT controls (I) and presymptomatic 60-d-old SOD1G93A mice (J), of TNFα expression in the olfactory bulb (K, L), and TLR2 expression in the lumbar spinal cord (M, N). O–R, Quantification of in situ labeled cells per tissue section of 60-d-old mice, from baseline and 24 h following LPS stimulation: TLR2-labeled cells in the olfactory bulb (WT, n = 5; SOD1G93A, n = 5; WT + LPS, n = 5; SOD1G93A + LPS, n = 5; p = 0.0052; O), TNFα-labeled cells in the olfactory bulb (WT, n = 5; SOD1G93A, n = 5; p = 0.0221, WT + LPS, n = 5; SOD1G93A + LPS, n = 5; p < 0.0001; P), TLR2-labeled cells in the lumbar spinal cord (WT, n = 5; SOD1G93A, n = 5; p = 0.0067, WT + LPS, n = 5; SOD1G93A + LPS, n = 5; p = 0.0043; Q), and TNFα-labeled cells in the lumbar spinal cord (WT, n = 5; SOD1G93A, n = 5; WT + LPS, n = 5; SOD1G93A + LPS, n = 5; p = 0.0376; R). Scale bars: A, B, 500 μm; C–H, 50 μm; K–N, 250 μm. Error bars indicate SEM.
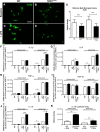
Figure 3.
IL-10 overexpression in in vitro adult microglia primary cultures. A–D, Baseline expression of TLR2 detected by immunofluorescent staining in adult primary cultures derived from the olfactory bulb of 60-d-old WT controls (A) and SOD1G93A mice (B) and TLR2 upregulation following in vitro LPS stimulation (C, D), Scale bar, 50 μm. E, Optical density quantification of TLR2 immunofluorescent stained cultures (WT, n = 6; SOD1G93A, n = 6; p < 0.0001; WT + LPS, n = 6; SOD1G93A + LPS, n = 6; p < 0.0001). F–J, RT-PCR analysis of the adult microglia primary cultures from olfactory bulb and spinal cord of WT and SOD1G93A mice, before and after LPS stimulation, looking at relative mRNA concentrations of IL-1β (spinal cord, WT vs SOD1G93A, p = 0.0319; WT + LPS vs SOD1G93A + LPS, p < 0.0001; F), IL-6 (olfactory bulb, WT + LPS vs SOD1G93A + LPS, p = 0.0388; spinal cord, WT vs SOD1G93A, p = 0.0346; G), TNFα (olfactory bulb, WT + LPS vs SOD1G93A + LPS, p = 0.0170; spinal cord, WT vs SOD1G93A, p = 0.0105; H), TGF-β1 (spinal cord, WT + LPS vs SOD1G93A + LPS, p = 0.0103; I), and IL-10 (olfactory bulb, WT + LPS vs SOD1G93A + LPS, p = 0.0002; spinal cord, WT vs SOD1G93A, p = 0.0479; WT + LPS vs SOD1G93A + LPS, p = 0.0206; J). All mRNA relative concentrations were normalized on the control gene HPRT1, and n = 2 for all RT-PRC analyses. K, Quantification of the IL-10 cytokine array from in vivo olfactory bulb 24 h after LPS stimulation (WT + LPS, n = 6; SOD1G93A + LPS, n = 6; p = 0.0054) and from in vivo lumbar spinal cord after LPS stimulation (WT + LPS, n = 6; SOD1G93A + LPS, n = 6; p = 0.0014). Error bars indicate SEM.
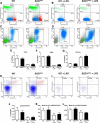
Figure 4.
Presymptomatic microglial phenotype is not mediated by peripheral immune cells. Blood samples from presymptomatic (60 d) and 24 h LPS stimulated WT and SOD1G93A mice were collected to assess the potential of immune cells in the periphery to modulate the repressed microglial response observed in the CNS of presymptomatic SOD1G93A mice. The blood samples were stained for CD45, CD4, CD8, and CD11b or for CD45, CD4, CD25, FoxP3, IL-4, and IL-10 and analyzed in flow cytometry. A–D, In 60-d-old mice, the CD4+ and CD8+ lymphocyte proportions were unchanged between WT and SOD1G93A (A, B), as were the monocyte/macrophage CD11b+ populations (C, D). CD4+, CD8+ lymphocytes and CD11b+ monocytes/macrophages of WT and SOD1G93A mice all showed equivalent response to LPS stimulation. E–G, Overall FACS counts suggest no deregulation in the CD4+, CD8+, or CD11b+ population in presymptomatic 60-d-old SOD1G93A mice. CD25+/FoxP3+ Tregs were also assessed for their production of IL-4 and IL-10. H, I, Both at baseline (H) and after LPS stimulation (I), WT and SOD1G93A mice had similar Tregs population ratios. J, Tregs counts suggest no deregulation between presymptomatic WT and SOD1G93A mice at 60 d. K, L, Levels of IL-10 (K) and IL-4 (L) were estimated as mean levels of fluorescence intensity among the Tregs cells. Again, no differences were observed between WT and SOD1G93A presymptomatic 60 d Tregs (n = 4–6 in each groups). Error bars indicate SEM.
Figure 5.
Modulating the microglial response by blocking the IL-10 pathway. A–C, E–G, Real-time imaging of TLR2 induction in the olfactory bulb and brain, 24 h after LPS stimulation, in WT controls (A), SOD1G93A mice (B), and SOD1G93A mice treated with αIL-10R antibodies (C) and the respective real-time imaging of the spinal cord (E–G) show a significant LPS-induced microglial activation increase in αIL-10R-treated SOD1G93A compared to untreated SOD1G93A mice. D, Quantitative analysis of the photonic emissions in the head (WT, n = 19; SOD1G93A, n = 24; p = 0.0047; WT + LPS, n = 24; SOD1G93A + LPS, n = 20; p = 0.0273; SOD1G93A + αIL-10R + LPS, n = 9; p = 0.0126). H, Quantitative analysis of the photonic emissions in the spinal cord (WT, n = 19; SOD1G93A, n = 22; p = 0.0119; WT + LPS, n = 16; SOD1G93A + LPS, n = 13; p = 0.0351; SOD1G93A + αIL-10R + LPS, n = 8; p = 0.0005). I–K, Real-time imaging of TLR2 induction in the olfactory bulb and brain, 48 h following intracerebroventricular injection of mSOD1, in WT controls (I), SOD1G93A mice (J), and SOD1G93A mice treated with αIL-10R antibodies (K) shows a significant mSOD1-induced microglial activation increase in the SOD1G93A αIL-10R-treated mice. L, Quantitative analysis of the photonic emissions in the head (WT, n = 19; SOD1G93A, n = 24; p = 0.0047; WT + LPS, n = 10; SOD1G93A + LPS, n = 6; p = 0.0221; SOD1G93A + αIL-10R + LPS, n = 7; p = 0.0490). M–P, Immunostaining of Iba1 after LPS stimulation in WT, SOD1G93A, and SOD_G93A_ +αIL-10R mice (M–O) and associated optical density quantification (P; WT + LPS, n = 5; SOD1G93A + LPS, n = 5; p = 0.0258; SOD1G93A + αIL-10R + LPS, n = 5). Q–T, Immunostaining of Iba1 after mSOD1 intracerebroventricular stimulation in WT, SOD1G93A, and SOD_G93A_ + αIL-10R mice (Q–S) and associated optical density quantification (T; WT + mSOD1, n = 5; SOD1G93A + mSOD1, n = 5; p = 0.0161; SOD1G93A + αIL-10R + mSOD1, n = 5). Scale bars: 100 μm. U, V, Western blots of Ym1 in WT, SOD1G93A, and SOD1G93A + αIL-10R brain extracts following mSOD1 intracerebroventricular stimulation (U) and optical density quantification (V) show a significant increase of Ym1 in the SOD1G93A + mSOD1 samples, but also a significant decrease of Ym1 levels in the SOD1G93A + αIL-10R + mSOD1 samples (WT + mSOD1, n = 3; SOD1G93A + mSOD1, n = 3; p = 0.0009; SOD1G93A + αIL-10R + mSOD1, n = 3; p < 0.0126). Error bars indicate SEM.
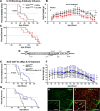
Figure 6.
Treatment with blocking IL-10R antibodies accelerates disease onset in SOD1G93A mice, whereas AAV-CD11b-cMyc-IL10 virus intrathecal injection delays onset and extends survival. Longitudinal analysis of SOD1G93A mice subjected to a 42 d intracerebroventricular infusion of saline (black curves) or αIL-10R antibodies (red curves) started at presymptomatic 60 d of age. A, Kaplan–Meier analysis of the extension reflex revealed a significant median onset 7 d earlier in the αIL-10R infused group (saline treated mean onset, 81 d; n = 9; αIL-10R treated mean onset, 74 d; n = 10; p = 0.0101). B, Animals receiving the αIL-10R antibodies failed to gain weight like the saline-treated controls and maintained an overall significant lower weight through their lifespan (linear regression analysis shows that the elevation between the two curves is significant; p < 0.0001). C, The presymptomatic αIL-10R treatment did not however affect the survival rate between the two groups. D, Diagram of the viral AAV construct expressing cMyc-IL-10 under the control of the human CD11b gene promoter. Longitudinal analysis of SOD1G93A mice subjected to an intrathecal AAV virus injection, with an empty plasmid control virus (black curves) or AAA-CD11b-cMyc-IL10 virus (blue curves) injected at presymptomatic 30–35 d of age. E, Kaplan–Meier analysis of the extension reflex revealed a significant 9 d delayed median onset in the AAV-CD11b-cMyc-IL10-infected group (control AAV mean onset, 90 d; n = 8; AAV-Cd11b-cMyc-IL10 mean onset, 99 d; n = 14; p = 0.0157). F, Animals receiving the AAV-CD11b-cMyc-IL10 virus maintained an overall significantly higher weight through their lifespan (linear regression analysis shows that the elevation between the two curves is significant; p = 0.0039). G, The presymptomatic AAV-CD11b-cMYC-IL10 intrathecal injection also significantly increased survival by 13 d (control AAV mean survival, 153 d; n = 7; AAV-Cd11b-cMyc-IL10 mean survival, 166 d; n = 14; p = 0.0166). H, I, Immunostaining of cMyc in the spinal cord of AAV-CD11b-cMyc-IL10-injected mice shows colocalization with Iba1, confirming a microglial expression of the viral construct. Scale bars: 100 μm; insets, 50 μm. Error bars indicate SEM.
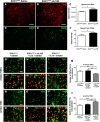
Figure 7.
Intracerebroventricular infusion of blocking IL-10R antibodies increases inflammation in the lumbar spinal cord, whereas IL-10 increases anti-inflammatory markers. A–C, Immunostaining of Iba1 in the lumbar spinal cord ventral horn of mice following 42 d of saline (A) or αIL-10R (B) intracerebroventricular infusion in SOD1G93A mice reveals, by optical density quantification of the fluorescent signal, an increased Iba1 immunoreactivity in the αIL-10R-treated mice (C; saline, n = 5; αIL-10R, n = 8; p = 0.0298). D–F, Immunostaining for Cd68, a marker of microglial activation (D, E), similarly shows, by optical density quantification, an increased CD68 expression in αIL-10R-infused SOD1G93A mice (F; saline, n = 6; αIl-10R, n = 6; p = 0.0128). G–M, TNFα immunostaining following in vitro mSOD1 stimulation on SOD1G93A, SOD1G93A + αIL10R + IL10, and SOD1G93A + IL10 primary cultures and relative numbers of TNFα/CD11b colocalization (M) show a significant decrease of TNFα cells in the IL10-treated group (SOD1G93A + mSOD1, n = 16; SOD1G93A + αIL-10R + IL10 + mSOD1, n = 16; SOD1G93A + IL10 + mSOD1, n = 16; p = 0.0041). N–T, Ym1 immunostaining following in vitro mSOD1 stimulation on SOD1G93A, SOD1G93A + αIL-10R + IL10, and SOD1G93A + IL10 cultures and relative numbers of YM1/CD11b colocalization (T) show a significant increase of YM1 positive cells following IL10 treatment (SOD1G93A +mSOD1, n = 16; SOD1G93A +αIL-10R +Il10 +mSOD1, n = 16; SOD1G93A + IL10 +mSOD1, n = 16, p = 0.0002). Scale bars: 50 μm. Error bars indicate SEM.
Similar articles
- Ablation of proliferating microglia does not affect motor neuron degeneration in amyotrophic lateral sclerosis caused by mutant superoxide dismutase.
Gowing G, Philips T, Van Wijmeersch B, Audet JN, Dewil M, Van Den Bosch L, Billiau AD, Robberecht W, Julien JP. Gowing G, et al. J Neurosci. 2008 Oct 8;28(41):10234-44. doi: 10.1523/JNEUROSCI.3494-08.2008. J Neurosci. 2008. PMID: 18842883 Free PMC article. - Spinal but not cortical microglia acquire an atypical phenotype with high VEGF, galectin-3 and osteopontin, and blunted inflammatory responses in ALS rats.
Nikodemova M, Small AL, Smith SM, Mitchell GS, Watters JJ. Nikodemova M, et al. Neurobiol Dis. 2014 Sep;69:43-53. doi: 10.1016/j.nbd.2013.11.009. Epub 2013 Nov 19. Neurobiol Dis. 2014. PMID: 24269728 Free PMC article. - Influence of methylene blue on microglia-induced inflammation and motor neuron degeneration in the SOD1(G93A) model for ALS.
Dibaj P, Zschüntzsch J, Steffens H, Scheffel J, Göricke B, Weishaupt JH, Le Meur K, Kirchhoff F, Hanisch UK, Schomburg ED, Neusch C. Dibaj P, et al. PLoS One. 2012;7(8):e43963. doi: 10.1371/journal.pone.0043963. Epub 2012 Aug 27. PLoS One. 2012. PMID: 22952827 Free PMC article. - [ALS and microglia--a player for non-cell-autonomous neuron death].
Yamanaka K, Yamashita H. Yamanaka K, et al. Brain Nerve. 2007 Oct;59(10):1163-70. Brain Nerve. 2007. PMID: 17969357 Review. Japanese. - Little Helpers or Mean Rogue-Role of Microglia in Animal Models of Amyotrophic Lateral Sclerosis.
Cihankaya H, Theiss C, Matschke V. Cihankaya H, et al. Int J Mol Sci. 2021 Jan 20;22(3):993. doi: 10.3390/ijms22030993. Int J Mol Sci. 2021. PMID: 33498186 Free PMC article. Review.
Cited by
- Plekhg5 controls the unconventional secretion of Sod1 by presynaptic secretory autophagy.
Hutchings AJ, Hambrecht B, Veh A, Giridhar NJ, Zare A, Angerer C, Ohnesorge T, Schenke M, Selvaraj BT, Chandran S, Sterneckert J, Petri S, Seeger B, Briese M, Stigloher C, Bischler T, Hermann A, Damme M, Sendtner M, Lüningschrör P. Hutchings AJ, et al. Nat Commun. 2024 Oct 4;15(1):8622. doi: 10.1038/s41467-024-52875-5. Nat Commun. 2024. PMID: 39366938 Free PMC article. - Microglia in neuroimmunopharmacology and drug addiction.
Li H, Watkins LR, Wang X. Li H, et al. Mol Psychiatry. 2024 Jun;29(6):1912-1924. doi: 10.1038/s41380-024-02443-6. Epub 2024 Feb 2. Mol Psychiatry. 2024. PMID: 38302560 Review. - Combined intramuscular and intraspinal transplant of bone marrow cells improves neuromuscular function in the SOD1G93A mice.
Martínez-Muriana A, Pastor D, Mancuso R, Rando A, Osta R, Martínez S, López-Vales R, Navarro X. Martínez-Muriana A, et al. Stem Cell Res Ther. 2020 Feb 7;11(1):53. doi: 10.1186/s13287-020-1573-6. Stem Cell Res Ther. 2020. PMID: 32033585 Free PMC article. - The role of immune-mediated alterations and disorders in ALS disease.
Rodrigues Lima-Junior J, Sulzer D, Lindestam Arlehamn CS, Sette A. Rodrigues Lima-Junior J, et al. Hum Immunol. 2021 Mar;82(3):155-161. doi: 10.1016/j.humimm.2021.01.017. Epub 2021 Feb 12. Hum Immunol. 2021. PMID: 33583639 Free PMC article. Review. - Role of miRNAs shuttled by mesenchymal stem cell-derived small extracellular vesicles in modulating neuroinflammation.
Giunti D, Marini C, Parodi B, Usai C, Milanese M, Bonanno G, Kerlero de Rosbo N, Uccelli A. Giunti D, et al. Sci Rep. 2021 Jan 18;11(1):1740. doi: 10.1038/s41598-021-81039-4. Sci Rep. 2021. PMID: 33462263 Free PMC article.
References
- Ayers JI, Fromholt S, Sinyavskaya O, Siemienski Z, Rosario AM, Li A, Crosby KW, Cruz PE, DiNunno NM, Janus C, Ceballos-Diaz C, Borchelt DR, Golde TE, Chakrabarty P, Levites Y. Widespread and efficient transduction of spinal cord and brain following neonatal AAV injection and potential disease modifying effect in ALS mice. Mol Ther. 2015;23:53–62. doi: 10.1038/mt.2014.180. - DOI - PMC - PubMed
- Beach TG, White CL, 3rd, Hladik CL, Sabbagh MN, Connor DJ, Shill HA, Sue LI, Sasse J, Bachalakuri J, Henry-Watson J, Akiyama H, Adler CH, Arizona Parkinson's Disease C. Olfactory bulb alpha-synucleinopathy has high specificity and sensitivity for Lewy body disorders. Acta Neuropathol. 2009;117:169–174. doi: 10.1007/s00401-008-0450-7. - DOI - PMC - PubMed
- Beers DR, Henkel JS, Zhao W, Wang J, Huang A, Wen S, Liao B, Appel SH. Endogenous regulatory T lymphocytes ameliorate amyotrophic lateral sclerosis in mice and correlate with disease progression in patients with amyotrophic lateral sclerosis. Brain. 2011;134:1293–1314. doi: 10.1093/brain/awr074. - DOI - PMC - PubMed
Publication types
MeSH terms
Substances
LinkOut - more resources
Full Text Sources
Other Literature Sources
Medical
Molecular Biology Databases
Research Materials
Miscellaneous
