Hippo/Mst signalling couples metabolic state and immune function of CD8α+ dendritic cells - PubMed (original) (raw)
. 2018 Jun;558(7708):141-145.
doi: 10.1038/s41586-018-0177-0. Epub 2018 May 30.
Jing Wen 1, Yanyan Wang 1, Peer W F Karmaus 1, Alireza Khatamian 2, Haiyan Tan 3 4, Yuxin Li 3 4, Cliff Guy 1, Thanh-Long M Nguyen 1, Yogesh Dhungana 1, Geoffrey Neale 5, Junmin Peng 3 4, Jiyang Yu 6, Hongbo Chi 7
Affiliations
- PMID: 29849151
- PMCID: PMC6292204
- DOI: 10.1038/s41586-018-0177-0
Hippo/Mst signalling couples metabolic state and immune function of CD8α+ dendritic cells
Xingrong Du et al. Nature. 2018 Jun.
Abstract
Dendritic cells orchestrate the crosstalk between innate and adaptive immunity. CD8α+ dendritic cells present antigens to CD8+ T cells and elicit cytotoxic T cell responses to viruses, bacteria and tumours 1 . Although lineage-specific transcriptional regulators of CD8α+ dendritic cell development have been identified 2 , the molecular pathways that selectively orchestrate CD8α+ dendritic cell function remain elusive. Moreover, metabolic reprogramming is important for dendritic cell development and activation3,4, but metabolic dependence and regulation of dendritic cell subsets are largely uncharacterized. Here we use a data-driven systems biology algorithm (NetBID) to identify a role of the Hippo pathway kinases Mst1 and Mst2 (Mst1/2) in selectively programming CD8α+ dendritic cell function and metabolism. Our NetBID analysis reveals a marked enrichment of the activities of Hippo pathway kinases in CD8α+ dendritic cells relative to CD8α- dendritic cells. Dendritic cell-specific deletion of Mst1/2-but not Lats1 and Lats2 (Lats1/2) or Yap and Taz (Yap/Taz), which mediate canonical Hippo signalling-disrupts homeostasis and function of CD8+ T cells and anti-tumour immunity. Mst1/2-deficient CD8α+ dendritic cells are impaired in presentation of extracellular proteins and cognate peptides to prime CD8+ T cells, while CD8α- dendritic cells that lack Mst1/2 have largely normal function. Mechanistically, compared to CD8α- dendritic cells, CD8α+ dendritic cells exhibit much stronger oxidative metabolism and critically depend on Mst1/2 signalling to maintain bioenergetic activities and mitochondrial dynamics for their functional capacities. Further, selective expression of IL-12 by CD8α+ dendritic cells depends on Mst1/2 and the crosstalk with non-canonical NF-κB signalling. Our findings identify Mst1/2 as selective drivers of CD8α+ dendritic cell function by integrating metabolic activity and cytokine signalling, and highlight that the interplay between immune signalling and metabolic reprogramming underlies the unique functions of dendritic cell subsets.
Figures
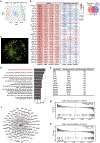
Extended Data Figure 1.. NetBID analysis for the reconstruction of DC signaling interactome (DCI), network and enrichment analyses of top kinase drivers, and identification and validation of Stk4 (Mst1) regulons.
a, PCA plot of baseline microarray gene expression profiles of total DCs (blue, n = 15; used for de novo DCI reconstruction), CD8α+ and CD8α− DCs (green and red, respectively, n = 4 each; used for differential expression analysis) after removal of batch effects. b, Top 36 hub kinases that are differentially activated in CD8α+ relative to CD8α− DCs inferred by NetBID. Left, the NetBID panel indicates the significance level (color coded by z score; labeled values are P values) of the driver network in integrated analysis, transcriptomics (mRNA), whole proteomics (wProtein) and phosphoproteomics (pProtein) data, respectively. Right, differential expression of the drivers (color coded by z score; labeled values are signed fold changes). The Venn diagram shows the enrichment of Hippo pathway kinases in the top putative kinase drivers. c, Network interactions of top 36 kinase drivers of CD8α+ DCs. d, Top signaling pathways enriched by 36 NetBID-inferred kinase drivers (P < 0.01, number of overlapped genes > 2). e, Known kinases in Hippo signaling (Meng Z et al, Genes Dev. 30:1–17, 2016) and analysis by NetBID. f, _Stk4_-mediated gene network (n = 140) from DCI computationally inferred from baseline gene expression profiles of total DCs by NetBID. The width of an edge is proportional to the pairwise mutual information of connected nodes. g, h, Enrichment of predicted Mst1 signaling regulons (f) in differentially expressed genes between Mst1/2-deficient (Mst1/2ΔDC) and Wild-type CD8α+ DCs (g) or CD8α− DCs (h). Pval.GSEA indicates the P value of GSEA; Pval.Stk4 and FC.Stk4 indicate the P value and signed fold change of Stk4 expression (insert).
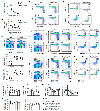
Extended Data Figure 2.. T-cell homeostasis in mice with DC-specific deletion of Hippo pathway genes.
a, b, Total cellularity (a) or T-cell numbers (TCRβ+CD8+ and TCRβ+CD4+) (b) of the spleen, peripheral lymph nodes (PLN) and mesenteric lymph nodes (MLN) of WT and Mst1/2ΔDC mice (n = 5 mice per genotype). c, Flow cytometry analysis of splenic CD4+ and CD8+ T-cell populations (upper) and frequencies of total CD4+ and CD8+ T cells in spleen, PLN and MLN (lower) of WT and Mst1/2ΔDC mice (n = 8 mice per genotype). d, CD44 and CD62L expression on splenic CD4+ and CD8+ T cells of WT and Mst1/2ΔDC mice. e, CD44 and IFN-γ expression in splenic CD4+ and CD8+ T cells. f–k, Flow cytometry analysis of CD4+ and CD8+ populations, expression of CD44 and CD62L, or CD44 and IFN-γ in CD4+ and CD8+ T cells from spleen of WT and Lats1/2ΔDC (f–h) or Yap/TazΔDC mice (i–k). l–n, Frequencies of CD44hlghCD62Llow effector/memory cells (l) and CD44+IFN-γ+ cells (m) in splenic CD4+ and CD8+ T cells and frequencies of splenic CD4+ and CD8+ T cells (n) of WT (n = 9), Cd11c_Cre_Stk4_fl/fl_Stk3+/+ (n = 5), Cd11c_Cre_Stk4+/+_Stk3_fl/fl (n = 4), _Cd11c_Cre_Stk4_fl/+_Stk3_fl/fl (n = 5) and _Cd11c_Cre_Stk4_fl/fl_Stk3_fl/+ (n = 4) mice. Numbers in quadrants or gates indicate percentage of cells. Error bar indicates SEM. NS, not significant; *P < 0.05; **P < 0.01; two-tailed unpaired Student’s _t_-test in a–c; one-way ANOVA in l–n. Data summarize two (i–k), three (f–h), four (a, b, d, e), six (c) or eight (l–n) Independent experiments.
Extended Data Figure 3.. Analysis of Mst1 and Mst2 deletion in DCs and lymphocytes from Mst1/2ΔDC mice and T-cell homeostatic status in mixed bone marrow (BM) chimeras.
a, Realtime PCR (upper and middle) and immunoblot (lower) analyses of Stk4 and Stk3 mRNA and protein expression in CD4+ T cells, CD8+ T cells and B cells from WT and Mst1/2ΔDC mice (n = 3 mice per genotype). b, Real-time PCR analysis of_Mst1_ and Mst2 expression in splenic CD8α+ and CD8α− DCs from WT and Mst1/2ΔDC mice (n = 3 for accessing Mst2 expression in Mst1/2-deficient CD8α+ DCs, n = 4 for others). c, d, BM cells from WT or Mst1/2ΔDC CD45.2.2+ mice were mixed with cells from CD45.1.2+ (spike) mice at a 1:1 ratio and transferred into lethally irradiated CD45.1.1+ mice. After 6-8 weeks, BM chimeras were analyzed for the expression of CD44, CD62L and IFN-γ (c) and frequencies of CD44highCD62Llow effector/memory cells and CD44+IFN-γ+ cells (d) in splenic CD8+ T cells derived from WT or Mst1/2ΔDC donor BM cells (CD45.2.2+) or spike cells CD45.1.2+ (n = 5 mice per genotype). Numbers in quadrants indicate percentage of cells. Error bar indicates SEM. **P < 0.01; two-tailed unpaired Student’s _t_-test in a, b, d. Data summarize two (a, b) or three (c, d) independent experiments.
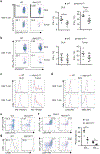
Extended Data Figure 4.. In vivo T-cell responses in WT and Mst1/2ΔDC mice challenged with tumor, pathogen or cognate antigen.
a, b, Flow cytometry analysis of IFN-γ expression (left) and frequencies of IFN-γ+ cells (right) in CD8+ (a) and CD4+ (b) T cells from draining lymph node (DLN) and tumor tissues of WT and Mst1/2ΔDC mice challenged with MC38 tumor cells (n = 7 for WT, n = 5 for Mst1/2ΔDC for DLN; n = 4 for WT, n = 8 for Mst1/2ΔDC for tumor tissues). c, Flow cytometry analysis of PD-1 expression on CD8+ (upper) and CD4+ (lower) T cells from DLN and tumor tissues of WT and Mst1/2ΔDC mice challenged with MC38 tumor cells. d, Flow cytometry analysis of LAG3 and TIM3 expression of CD8+ (upper) and CD4+ (lower) T cells from DLN of WT and Mst1/2ΔDC mice challenged with MC38 tumor cells. e, Flow cytometry of H-2Kb-OVA+ CD8+ T cells in the blood from WT and Mst1/2ΔDC mice infected with LM-OVA. f, Flow cytometry (left) and frequencies (right) of IFN-γ+ and TNF-α+ cells of PMA and ionomycin-stimulated CD8+ T cells in the blood from WT and Mst1/2ΔDC mice infected with LM-OVA (n = 5 for WT, n = 4 for Mst1/2ΔDC). Numbers in quadrants or gates indicate percentage of cells. g, CFSE dilution of donor OT-I T cells in OVA-immunized mice. Numbers in quadrants or gates indicate percentage of cells. Error bar indicates SEM. *P < 0.05; **P < 0.01; two-tailed unpaired Student’s _t_-test in a, b, f. Data summarize two (a–e, g) independent experiments.
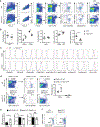
Extended Data Figure 5.. Altered homeostasis of Mst1/2-deficient DCs.
A, Detailed gating strategy for flow cytometry of splenic conventional DCs (cDC), CD8α+ cDC (CD8α+CD11b−), CD8α− cDC (CD8α−CD11b+) and pDC populations in WT and Mst1/2ΔDC mice. MHC-II, MHC class II. B, Frequencies and cell numbers of splenic DC populations in WT and Mst1/2ΔDC mice as gated in a (n = 5 mice per genotype). C, Flow cytometry analysis of CD40, CD70, CD80, CD86, H-2Kb, MHC-II, 4-1BBL, OX40L and PD-L1 expression on splenic CD8α+ and CD8α− DCs as gated in a. d, Flow cytometry (left) of CD45.1.2+ BM cell-derived and CD45.2.2+ WT or Mst1/2ΔDC donor BM cell-derived splenic cDC, CD8α+ cDC, CD8α− cDC and pDC populations in mixed chimeras and frequencies (right) of CD8α+ cDCs in total cDCs and pDCs in spleen derived from WT or Mst1/2ΔDC donor BM cells in mixed chimeras (n = 5 mice per genotype). E, Normalized chimerism for the indicated DC subsets in mixed BM chimeras. The percentage of indicated DC subsets was normalized by that of B cells from same mice. The chimerism of WT was set as 1 (n = 5 mice per genotype). F, Flow cytometry analysis of donor (WT or Mst1/2ΔDC, CD45.2.2+) and spike (CD45.1.2+) BM cell percentages in the BM mixture before transfer. Numbers in gates indicate percentage of cells. Error bar indicates SEM. *P < 0.05; **P < 0.01; two-tailed unpaired Student’s _t_-test in b, d, e. Data summarize four (a–c) or three (d, e) independent experiments.
Extended Data Figure 6.. Homeostasis of DCs after deletion of Hippo pathway genes.
A, Frequencies of splenic cDC, CD8α+ cDC, and pDC populations in WT (n = 9), Cd11c_Cre_Stk4_fl/fl_Stk3+/+ (n = 5), Cd11c_Cre_Stk4+/+_Stk3_fl/fl (n = 4), _Cd11c_Cre_Stk4_fl/+_Stk3_fl/fl (n = 5) and _Cd11c_Cre_Stk4_fl/fl_Stk3_fl/+ (n = 4) mice. b, c, Flow cytometry of splenic cDC, CD8α+ cDC, CD8α− cDC and pDC populations in WT and Lats1/2ΔDC (b), or Yap/TazΔDC (c) mice. Numbers in gates indicate percentage of cells. Data summarize two (b), three (c) or eight (a) independent experiments.
Extended Data Figure 7.. Role of Mst1/2 in selectively programming functions of CD8α+ DCs and CD24hi FLT3L-BMDCs to prime CD8 T cells.
a, Frequency of CFSElow cells of donor OT-I T cells in WT (n = 5), Mst1/2ΔDC (n = 5), _Batf3_−/−: WT (n = 5) or _Batf3_−/−:Mst1/2ΔDC (n = 6) mixed chimeras immunized with OVA. b, CFSE-labeled OT-I T cells (CD45.1+) were transferred to _B2m_−/− mice followed by immunization one day later with OVA-pulsed CD8α+ or CD8α− splenic DCs isolated from WT or Mst1/2ΔDC mice (following DC expansion by FLT3L), and CFSE dilution of OT-I cells was examined 3 days after DC immunization. Shown are representative flow cytometry histogram of CFSE dilution and frequency of CFSElow cells in donor OT-I T cells (gated on CD45.1+CD45.2−) from spleen of _B2m_−/− mice (n = 4 for Mst1/2-deficient CD8α− DC, n = 3 for all others). c, d, CD8α+ (c) or CD8α− DCs (d) from WT and Mst1/2ΔDC mice were fed with 0 or 50 μg/ml soluble OVA conjugated with FITC for 1 h at 37°C or 4°C. Cells were then collected and OVA uptake was evaluated by flow cytometry. Numbers in graphs indicate the mean fluorescence intensity of OVA-FITC. e, Flow cytometry (upper) and quantification (lower, n = 4 per genotype) of apoptotic CD8α+ or CD8α− DCs examined by Annexin V (left) and active caspase 3 (right) staining in freshly isolated splenocytes from WT and Mst1/2ΔDC mice. f, CD8α+ (upper) or CD8α− DCs (lower) from WT and Mst1/2ΔDC mice were cultured overnight for analysis of cell viability by 7-AAD staining. Quantification of the percentage of 7-AAD negative live cells is shown (n = 3 per genotype). g, Thymidine incorporation of OT-II T cells cultured with OVA protein- or OVA(323-339) peptide-pulsed CD8α+ or CD8α− DCs (n = 13 derived from 5 mice for Mst1/2-deficient CD8α+ DC/OVA(323-339) group, n = 15 derived from 5 mice for all other groups). h–j, Thymidine incorporation of OT-I (left) or OT-II (right) T cells cultured with OVA protein-pulsed CD24high FLT3L-BMDCs (h), CD24low FLT3L-BMDCs (i), or GM-CSF-derived BMDCs (j) from WT and Mst1/2ΔDC mice for 72 h (n = 14 from 5 mice for Mst1/2-deficient GM-CSF-BMDC/OT-I group, n = 15 from 5 mice for all other groups). k, Relative thymidine incorporation of OT-I T cells cultured with OVA protein- or OVA(257-264) peptide-pulsed splenic CD8α+ DCs pretreated with vehicle or Mst1/2 inhibitor (XMU-MP-1) for 4 h. Thymidine incorporation of OT-I T cells cultured with vehicle-treated DCs in each group was set as 1 (n = 3 per group). l, Relative thymidine incorporation of OT-I T cells cultured with OVA protein- or OVA(257-264) peptide-pulsed CD8α+ DCs from WT and Lats1/2ΔDC mice (n = 14 derived from 5 mice for WT, n = 15 derived from 5 mice for Lats1/2ΔDC). Thymidine incorporation of OT-I T cells cultured with WT DCs in each group was set as 1. m, Relative thymidine incorporation of OT-I T cells cultured with OVA protein-pulsed WT or Yap/TazΔDC splenic CD8α+ DCs that were pre-treated with vehicle or Mst1/2 inhibitor (n = 3 derived from two mice per genotype). Thymidine incorporation of OT-I T cells cultured with vehicle-treated DCs was set as 1. Numbers in gates indicate percentage of cells. Error bar indicates SEM. *P < 0.05; **P < 0.01; two-tailed unpaired Student’s _t_-test in a, b, e–l; two-way ANOVA in m. Data summarize two (a–d, g–j), three (e, f, k, 1) or four (e) independent experiments.
Extended Data Figure 8.. Analysis of mitochondrial profiles of Mst1/2-, Lats1/2- and mTOR-deficient DCs.
a, Functional annotations of upregulated metabolic pathways according to KEGG and Hallmark databases in CD8α+ DCs (compared to CD8α− DCs) profiled by proteomics. b, ECAR of splenic CD8α+ and CD8α− DCs (Oligo, oligomycin; FCCP, carbonyl cyanide p-trifluoromethoxyphenylhydrazone). c, Flow cytometry analysis of mitochondrial mass and membrane potential of WT splenic CD8α+ and CD8α− DCs by Mitotracker and TMRM (Tetramethylrhodamine, methyl ester) staining, respectively. Numbers in graph indicate the mean fluorescence intensity. d, Relative thymidine incorporation of OT-I T cells cultured with OVA protein- or OVA(257-264) peptide-pulsed CD8α+ and CD8α− DCs pre-treated with vehicle or metabolic inhibitors. Values after culture with vehicle-treated DCs were set as 1. e, Thymidine incorporation of OT-I T cells cultured with OVA protein- or OVA(257-264) peptide-pulsed splenic CD8α+ DCs from WT and mTORΔDC mice for 72 h (n = 12 from 4 mice per genotype). f, Flow cytometry analysis of mitochondrial mass and mitochondrial membrane potential of WT and Mst1/2ΔDC splenic CD8α+ and CD8α− DCs by Mitotracker and TMRM staining, respectively. Numbers in graph indicate the mean fluorescence intensity. g, Transmission electron microscopy analysis of mitochondria of splenic CD8α− DCs from WT or Mst1/2ΔDC mice. Arrows indicate mitochondria. h, Immunoblot analysis of expression of NDUFB8 (complex I), SDHB (complex II), UQCRC2 (complex III), MT-CO1 (complex IV) and ATP5A (complex V) in CD8α+ and CD8α− DCs. i, Flow cytometry analysis of mitochondrial mass and mitochondrial membrane potential of WT and Lats1/2ΔDC splenic CD8α+ and CD8α− DCs by Mitotracker and TMRM staining, respectively. Numbers in graph indicate the mean fluorescence intensity. j, Immunoblot analysis of p-S6 and c-Myc protein in CD8α+ and CD8α− DCs of WT and Mst1/2ΔDC mice. k, Immunoblot analysis of NDUFB8 (complex I), SDHB (complex II), UQCRC2 (complex III), MT-CO1 (complex IV) and ATP5A (complex V) protein in CD8α+ and CD8α− DCs of WT and mTORΔDC mice. Error bar indicates SEM. *P < 0.05; **P < 0.01; one-way ANOVA in d; two-tailed unpaired Student’s _t_-test in e. Data summarize two (e, f, h–k), three (b, d) or four (c) independent experiments.
Extended Data Figure 9.. Selective regulation of IL-12 signaling and expression by Mst1/2 in CD8α+ DCs.
a, Venn diagram showing the overlap of top 28 upregulated (Mst1/2ΔDC vs WT) pathways by GSEA between CD8α+ and CD8α− DCs. Briefly, transcriptional profiles of Mst1/2-deficient CD8α+ and CD8α− DCs were compared to their respective WT counterparts by GSEA, and then upregulated pathways (FDR < 0.05) were identified in CD8α+ DCs (Mst1/2ΔDC vs WT) and CD8α− DCs (Mst1/2ΔDC vs WT) and used to generate Venn diagram. The top 28 upregulated pathways in Mst1/2-deficient CD8α+ and CD8α− DCs (compared to their respective WT counterparts) were largely shared (24/28) between the two DC subsets. b, List of the significantly upregulated (FDR < 0.05) 24 pathways (out of 28) shared by Mst1/2-deficient CD8α+ and CD8α− DCs (compared to their respective WT counterparts), as revealed by GSEA. c, List of the significantly downregulated (FDR < 0.05) pathways determined by GSEA (arranged in the order by their FDR values) in Mst1/2-deficient CD8α+ DCs (vs WT cells). NES, normalized enrichment score. d, Il12b expression in WT CD8α+ and CD8α− DCs. e, Relative IL-12 p40 cytokine concentration in the supernatant of LPS-treated CD8α+ and CD8α− DCs from WT and Mst1/2ΔDC mice (n = 4 per genotype for CD8α+ DCs, n = 3 per genotype for CD8α− DCs). IL-12 p40 cytokine concentration of WT DCs was set as 1. f, Real-time PCR analysis of Il12b mRNA expression in WT splenic CD8α+ and CD8α− DCs treated with vehicle or Mst1/2 inhibitor (XMU-MP-1) (n = 4 per treatment). g, Il12b expression in FLT3L-BMDCs (n = 4 for WT CD24high BMDCs, n = 5 for other groups). h, i, Real-time PCR analysis of Il1a, Il1b, Il6, Il10 and Ifnb1 mRNA expression in splenic CD8α+ (h) and CD8α− DCs (i) from WT and Mst1/2ΔDC mice (n = 4 mice per genotype). j, k, Frequencies of CD44highCD62Llow (j) and CD44+IFN-γ+ cells (k) in splenic CD4+ and CD8+ T cells from WT (n = 5), Mst1/2ΔDC (n = 5), _Il12a_−/− (n = 6) and Mst1/2ΔDC_Il12a_−/− (n = 6) mice. WT and Mst1/2ΔDC groups were the same as those shown in Fig. 1d, e. Error bar indicates SEM. *P < 0.05; **P < 0.01; unpaired Student’s _t_-test in d, f–i; two-tailed paired Student’s _t_-test in e; one-way ANOVA in j, k. Data summarize two (d, g), three (e), four (j, k) or five (f) independent experiments.
Extended Data Figure 10.. Mst/Hippo signaling integrates mitochondrial metabolism and non-canonical NF-KB/IL-12 signaling in CD8α+ DCs.
a, Relative thymidine incorporation of OT-I T cells cultured with OVA protein- or OVA(257-264) peptide-pulsed splenic CD8α+ DCs (left) or CD8α− DCs (right) from WT and _Il12a_−/− mice (n = 9 derived from 3 mice for WT, n = 12 derived from 4 mice for _Il12a_−/−). Thymidine incorporation of OT-I T cells cultured with WT DCs in each group was set as 1. b, Real-time PCR analysis of NF-κB2 (left) or RelB (right) mRNA expression in splenic CD8α+ DCs from WT and Mst1/2ΔDC mice (n = 3 mice per population). c, NF-κB2 and RelB expression in control- or NIKΔ78-84-transduced WT CD11c+B220− FLT3L-BMDCs. d, Flow cytometry analysis of mitochondrial membrane potential of WT or Mst1/2-deficient CD24hi FLT3L-BMDCs transduced with control (left) or NIK(Δ78-84) (right) virus. Numbers in graph indicate the mean fluorescence intensity. e, Thymidine incorporation of OT-I T cells cultured with OVA protein-pulsed WT or Mst1/2-deficient CD24high FLT3L-BMDCs transduced with control or NIK(Δ78-84) virus (n = 6 derived from 3 mice for WT/control group, n = 8 derived from 3 mice for Mst1/2ΔDC/control group, n = 4 derived from 3 mice per genotype for NIK(Δ78-84) group). f, FLT3L-expanded splenic CD8α+ DC lysate was immunoprecipitated with anti-Mst1 antibody and blotted with anti-Traf3. Mst1 blot was from the same experiment as Fig. 3f. g, Immunoblot analysis of Traf3 protein in splenic CD8α+ and CD8α− DCs from WT and Mst1/2ΔDC mice. h, Real-time PCR analysis of Il12b expression in WT CD8α+ DCs treated with vehicle, metformin or oligomycin as indicated in figures (n = 3 per group). Il12b expression of vehicle-treated DCs was set as 1. i, Flow cytometry analysis of mitochondrial membrane potential (upper) and mitochondrial mass (lower) of different concentrations of IL-12-treated WT splenic CD8α+ DCs by TMRM and Mitotracker staining. Numbers in graph indicate the mean fluorescence intensity. j, Flow cytometry analysis of mitochondrial membrane potential and mitochondrial mass of WT and _Il12a_−/− splenic CD8α+ DCs by TMRM (Tetramethylrhodamine, methyl ester) and Mitotracker staining. k, Flow cytometry analysis of mitochondrial membrane potential and mitochondrial mass of WT and NIK-deficient (_Map3k14_−/−) splenic CD8α+ DCs by TMRM and Mitotracker staining. l, Immunoblot analysis of p-Lats1/2, p-Yap and p-Mst1/2 proteins in WT splenic CD8α+ DCs treated with FLT3L for the indicated times. m, CD8α+ DC number from spleen of WT and Mst1/2ΔDC mice treated with or without FLT3L for 10 days. n, Flow cytometry analysis of mitochondrial mass of human CD141+ DCs treated with vehicle or Mst1/2 inhibitor (XMU-MP-1) by Mitotracker staining. o, Real-time PCR analysis of Il12b mRNA expression in human CD141+ (equivalent to mouse CD8α+ DCs) and CD1c+ DCs (equivalent to mouse CD8α− DCs) treated with vehicle or Mst1/2 inhibitor (XMU-MP-1) (n = 5 per for CD141+ DC, n = 4 for CD1c+ DC). Error bar indicates SEM. *P < 0.05; **P < 0.01; two-tailed unpaired Student’s _t_-test in a, b, m, o; two-way ANOVA in e. Data summarize two (a, d–g, i, j, 1, n, o) or three (h, k, m) independent experiments. p, Brief schematics of non-canonical Hippo signaling in orchestrating CD8α+ DC function. Mst/Hippo signaling integrates metabolic and IL-12 cytokine signaling in CD8α+ DCs through controlling mitochondrial dynamics and non-canonical NF-κB signaling. This regulation is independent of canonical Hippo signaling in organ size control and tumor suppression.
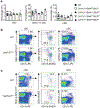
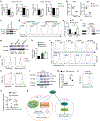
Figure 1.. NetBID identifies Hippo signaling kinases as drivers of CD8α+ DCs, and deletion of Mst1/2 in DCs leads to selective CD8+ T-cell homeostatic and functional defects.
a, Overview of NetBID. b, Immunoblot of splenic CD8α+ and CD8α− DCs. c, Enrichment of predicted Mst1 signaling regulons in differentially expressed genes between Mst1/2-deficient (Mst1/2ΔDC) and wild-type (WT) DCs. FC.Stk4, signed fold change of Stk4 expression. d, Frequencies of CD44highCD62Llow effector/memory cells in T cells from spleen, peripheral lymph nodes (PLN) and mesenteric lymph nodes (MLN) (n = 5 per genotype). e, Frequencies of cytokine-producing cells (n = 5 per genotype). f, MC38 tumor growth (n = 10 for WT, n = 6 for Mst1/2ΔDC). g, Frequency of blood H-2Kb-OVA+ CD8+ T cells from LM-OVA-infected mice (n = 5 for WT, n = 4 for Mst1/2ΔDC). h, Frequency of CFSElow proliferated cells of donor OT-I T cells in OVA-immunized mice (n = 5 per genotype). Error bar indicates SEM. *P < 0.05; **P < 0.01; two-tailed unpaired Student’s _t_-test in d–h. Data summarize two (f, g, h), three (b) or four (d, e) independent experiments.
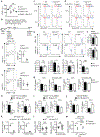
Figure 2.. Mst1/2 are selectively required in CD8α+ DCs to orchestrate CD8+ T-cell homeostasis and function.
a, b, Frequencies of CD44highCD62Llow (a) and CD44+IFN-γ+ cells (b) in splenic T cells from WT (n = 5), Mst1/2ΔDC (n = 3), _Batf3_−/− (n = 4) and Mst1/2ΔDC_Batf3_−/− (n = 4) mice. c, CFSE dilution of donor OT-I T cells in WT, Mst1/2ΔDC, _Batf3_−/−:WT or _Batf3_−/−:Mst1/2ΔDC mixed chimeras immunized with OVA. d, Frequency and number of IFN-γ+ cells among H-2Kb-OVA+ CD8+ T cells after immunization with OVA-loaded irradiated _B2m_−/− splenocytes (n = 4 per genotype). e, Thymidine incorporation of OT-I T cells cultured with OVA protein- or OVA(257-264) peptide-pulsed CD8α+ or CD8α− DCs (n = 8 per genotype). f, IL-2 from co-cultures in e (n = 6 per genotype for CD8α+ DCs, and n = 8 per genotype for CD8α− DCs). Error bar indicates SEM. NS, not significant; *P < 0.05; **P < 0.01; one-way ANOVA in a, b; two-tailed unpaired Student’s _t_-test in d–f. Data summarize two (f, c), three (d, e) or four (a, b) independent experiments.
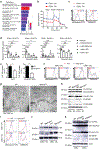
Figure 3.. Unique metabolic state of CD8α+ DCs supports their immune priming function in an Mst1/2-dependent manner.
a, OCR of splenic CD8α+ and CD8α− DCs (Oligo, oligomycin; FCCP, carbonyl cyanide p-trifluoromethoxyphenylhydrazone). b, OCR bioenergetics profile, basal and maximal OCR (n = 6 for WT CD8α+ DCs, n = 3 for Mst1/2-deficient CD8α+ DCs, n = 6 per genotype for CD8α− DCs), and basal ECAR (n = 9 per genotype for CD8α+ DCs, n = 18 for WT CD8α− DCs, n = 12 for Mst1/2-deficient CD8α− DCs). c, Stochastic optical reconstruction microscopy (STORM) analysis of mitochondrial marker Tom20. Right, quantified maximal mitochondrial diameter. d, Transmission electron microscopy analysis of mitochondria (arrows) in CD8α+ DCs. e, Immunoblot of CD8α+ DCs. f, CD8α+ DC lysate was immunoprecipitated with anti-Mst1 and blotted with anti-PKA Cα/β. g, Thymidine incorporation of OT-I T cells cultured with OVA protein-pulsed WT (n = 13 from 4 mice) or Mst1/2ΔDC (n = 11 from 4 mice) CD8α+ DCs pre-treated with vehicle or M1+Mdivi-1. Error bar indicates SEM. **P < 0.01; two-tailed unpaired Student’s _t_-test in b, c, g. Data summarize two (b, c, e–g) or four (a) independent experiments.
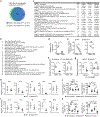
Figure 4.. Mst1/2 orchestrate selective expression of IL-12 in CD8α+ DCs via crosstalk with non-canonical NF-κB signaling.
a, Venn diagram showing the overlap of significantly upregulated or downregulated pathways by GSEA analysis between CD8α+ and CD8α− DCs. b, Underrepresentation of IL-12 pathway in Mst1/2-deficient CD8α+ DCs. NES, normalized enrichment score. c, Il12b expression in CD8α+ DCs from WT and Mst1/2ΔDC mice (n = 4 per genotype). d, Thymidine incorporation of OT-I T cells cultured with OVA protein- or OVA(257-264) peptide-pulsed CD8α+ DCs with or without IL-12 (left, n = 8 from 3 WT mice, n = 9 from 3 Mst1/2ΔDC mice; right, n = 7 from 3 WT mice, n = 9 from 3 Mst1/2ΔDC mice). The numbers above the graph are the relative ratios of WT vs Mst1/2ΔDC DC groups. e, CFSE dilution (left) and CD62L/CD44 expression (right) of transferred OT-I T cells in OVA-immunized mice. f, NF-κB2 (p100) and RelB expression in DCs. g, Relative Il12b expression in WT or Mst1/2-deficient CD24high FLT3L-BMDCs transduced with control or NIK(Δ78-84) (n = 4 mice per group). Error bar indicates SEM. *P < 0.05; **P < 0.01; two-tailed unpaired Student’s _t_-test in c, g. Data summarize two (c–f) or three (g) independent experiments.
Similar articles
- The Hippo kinases control inflammatory Hippo signaling and restrict bacterial infection in phagocytes.
St Louis BM, Quagliato SM, Su Y-T, Dyson G, Lee P-C. St Louis BM, et al. mBio. 2024 May 8;15(5):e0342923. doi: 10.1128/mbio.03429-23. Epub 2024 Apr 16. mBio. 2024. PMID: 38624208 Free PMC article. - Hippo kinases Mst1 and Mst2 maintain NK cell homeostasis by orchestrating metabolic state and transcriptional activity.
Feng P, Luo L, Yang Q, Meng W, Guan Z, Li Z, Sun G, Dong Z, Yang M. Feng P, et al. Cell Death Dis. 2024 Jun 19;15(6):430. doi: 10.1038/s41419-024-06828-x. Cell Death Dis. 2024. PMID: 38898027 Free PMC article. - NFIL3/E4BP4 is a key transcription factor for CD8α⁺ dendritic cell development.
Kashiwada M, Pham NL, Pewe LL, Harty JT, Rothman PB. Kashiwada M, et al. Blood. 2011 Jun 9;117(23):6193-7. doi: 10.1182/blood-2010-07-295873. Epub 2011 Apr 7. Blood. 2011. PMID: 21474667 Free PMC article. - The bloodline of CD8α(+) dendritic cells.
Kang SJ. Kang SJ. Mol Cells. 2012 Sep;34(3):219-29. doi: 10.1007/s10059-012-0058-6. Epub 2012 Jul 4. Mol Cells. 2012. PMID: 22767247 Free PMC article. Review. - The emerging role of Hippo signaling pathway in regulating osteoclast formation.
Yang W, Han W, Qin A, Wang Z, Xu J, Qian Y. Yang W, et al. J Cell Physiol. 2018 Jun;233(6):4606-4617. doi: 10.1002/jcp.26372. Epub 2018 Jan 15. J Cell Physiol. 2018. PMID: 29219182 Review.
Cited by
- Metabolic rewiring and communication in cancer immunity.
Chapman NM, Chi H. Chapman NM, et al. Cell Chem Biol. 2024 May 16;31(5):862-883. doi: 10.1016/j.chembiol.2024.02.001. Epub 2024 Feb 29. Cell Chem Biol. 2024. PMID: 38428418 Free PMC article. Review. - scMINER: a mutual information-based framework for identifying hidden drivers from single-cell omics data.
Ding L, Shi H, Qian C, Burdyshaw C, Veloso JP, Khatamian A, Pan Q, Dhungana Y, Xie Z, Risch I, Yang X, Huang X, Yan L, Rusch M, Brewer M, Yan KK, Chi H, Yu J. Ding L, et al. bioRxiv [Preprint]. 2023 Jan 27:2023.01.26.523391. doi: 10.1101/2023.01.26.523391. bioRxiv. 2023. PMID: 36747870 Free PMC article. Updated. Preprint. - Metabolic heterogeneity underlies reciprocal fates of TH17 cell stemness and plasticity.
Karmaus PWF, Chen X, Lim SA, Herrada AA, Nguyen TM, Xu B, Dhungana Y, Rankin S, Chen W, Rosencrance C, Yang K, Fan Y, Cheng Y, Easton J, Neale G, Vogel P, Chi H. Karmaus PWF, et al. Nature. 2019 Jan;565(7737):101-105. doi: 10.1038/s41586-018-0806-7. Epub 2018 Dec 19. Nature. 2019. PMID: 30568299 Free PMC article. - scMINER: a mutual information-based framework for identifying hidden drivers from single-cell omics data.
Ding L, Shi H, Qian C, Burdyshaw C, Veloso JP, Khatamian A, Pan Q, Dhungana Y, Xie Z, Risch I, Yang X, Huang X, Yan L, Rusch M, Brewer M, Yan KK, Chi H, Yu J. Ding L, et al. Res Sq [Preprint]. 2023 Jan 27:rs.3.rs-2476875. doi: 10.21203/rs.3.rs-2476875/v1. Res Sq. 2023. PMID: 36747874 Free PMC article. Updated. Preprint. - Emerging role of Hippo pathway in the regulation of hematopoiesis.
Kim I, Park T, Noh JY, Kim W. Kim I, et al. BMB Rep. 2023 Aug;56(8):417-425. doi: 10.5483/BMBRep.2023-0094. BMB Rep. 2023. PMID: 37574808 Free PMC article. Review.
References
- Dudziak D et al. Differential antigen processing by dendritic cell subsets in vivo. Science 315, 107–111 (2007). - PubMed
Publication types
MeSH terms
Substances
Grants and funding
- CA221290/NH/NIH HHS/United States
- NS064599/NH/NIH HHS/United States
- R01 AG053987/AG/NIA NIH HHS/United States
- P30 CA021765/CA/NCI NIH HHS/United States
- R01 AI105887/AI/NIAID NIH HHS/United States
- AI105887/NH/NIH HHS/United States
- R01 CA176624/CA/NCI NIH HHS/United States
- R01 CA221290/CA/NCI NIH HHS/United States
- R01 AG047928/AG/NIA NIH HHS/United States
- AG047928/NH/NIH HHS/United States
- AI101407/NH/NIH HHS/United States
- R01 NS064599/NS/NINDS NIH HHS/United States
- R37 AI105887/AI/NIAID NIH HHS/United States
- CA176624/NH/NIH HHS/United States
- R01 AI101407/AI/NIAID NIH HHS/United States
LinkOut - more resources
Full Text Sources
Other Literature Sources
Molecular Biology Databases
Research Materials
Miscellaneous
