A comprehensive evaluation of Hippo pathway silencing in sarcomas - PubMed (original) (raw)
A comprehensive evaluation of Hippo pathway silencing in sarcomas
Nicole M Merritt et al. Oncotarget. 2018.
Abstract
TAZ and YAP are transcriptional coactivators negatively regulated by the Hippo pathway that have emerged as key oncoproteins in several cancers including sarcomas. We hypothesized that loss of expression of the Hippo kinases might be a mechanism of activating TAZ and YAP. By immunohistochemistry, TAZ/YAP activated clinical sarcoma samples demonstrated loss of MST1 (47%), MST2 (26%), LATS1 (19%), and LATS2 (27%). Western blot similarly demonstrated loss of MST1 (58%), MST2 (25%), and LATS2 (17%). Treatment with MG132 demonstrated an accumulation of MST2 in 25% of sarcoma cell lines, indicating that proteosomal degradation regulates MST2 expression. qRT-PCR in sarcoma cell lines demonstrated loss of expression of the Hippo kinases at the RNA level, most pronounced in MST1 (42%) and MST2 (25%). 5-azacytidine treatment in sarcoma cell lines modestly reversed expression of predominantly MST1 (8%) and MST2 (17%), indicating CpG island hypermethylation can silence expression of MST1 and MST2. Trichostatin A treatment reversed expression of MST1 (58%) and MST2 (67%), indicating histone deacetylation also plays a role in silencing expression of MST1 and MST2. Loss of expression of the Hippo kinases is frequent in sarcomas and is due to a variety of mechanisms including regulation at the post-translational level and epigenetic silencing.
Keywords: Hippo pathway; TAZ; YAP; epigenetics; sarcoma.
Conflict of interest statement
CONFLICTS OF INTEREST The authors do not have any conflicts of interest to report.
Figures
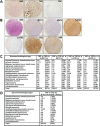
Figure 1. Expression of the Hippo kinases in clinical samples
Immunohistochemical evaluation of MST1, MST2, LATS1, and LATS2 in a sarcoma tissue microarray. (A) Myxofibrosarcoma demonstrating diffuse and strong expression and nuclear localization (activation) of TAZ, and a lack of expression of YAP. (B) Synovial sarcoma demonstrating a lack of expression of MST1, MST2, and LATS2 in a sarcoma with activated TAZ and YAP. LATS1 expression is maintained. (C) Table demonstrating range of Hippo kinase loss in YAP or TAZ activated sarcomas. Loss of expression ranged from 19% (LATS1) to 47% (MST1). (D) Table demonstrating the frequency of loss of at least one Hippo kinase as a function of sarcoma histological type in sarcomas demonstrating activated TAZ or YAP.
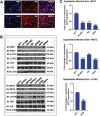
Figure 2. Expression of the Hippo kinases in vitro
(A) Immunofluorescence demonstrating constitutive nuclear localization of TAZ and YAP in A204 cells grown to confluence. (B) Western blot demonstrating a loss of expression of Hippo kinases relative to GCT (giant cell tumor) cell line. (C) Quantitative western blot for MST1, MST2 and LATS2 (the most commonly lost kinases) in the SKLMS1, RD, and A204 cell lines and compared to GCT. The SKLMS1, RD, and A204 cell lines showed a stastically significant decrease in expression in MST1 and MST2 as compared to GCT. Of these three lines, only A204 demonstrated a significant decrease in expression of LATS2. Statistical significance determined by two-tailed _t_-test. * indicates p < 0.05; ** indicates p < 0.01; *** indicates p < 0.001.
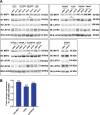
Figure 3. Evaluation of proteosomal degradation of the Hippo kinases in vitro
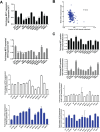
Cell lines were treated with 10 μM MG132 for 12 hrs. A 1.5-fold or greater accumulation of protein was considered indicative of proteosomal degradation. (A) Western blot demonstrates accumulation of MST2, but not MST1, LATS1, or LATS2 with treatment with 10 μM MG132. This was validated quantitatively in 3 cell lines (SKLMS1, A204, and SJCRH30) in part (B). These three lines are indicated by an asterisk in part (A). Statistical significance determined by two-tailed _t_-test. * indicates p < 0.05; ** indicates p < 0.01; *** indicates p < 0.001.
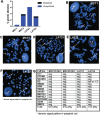
Figure 4. The Hippo kinases are rarely deleted in sarcomas
(A) Evaluation of The Cancer Genome Atlas data set revealed less than 1% of sarcomas demonstrate deletions of MST2 and LATS2. (B–D) Fluorescence in situ hybridization (FISH) utilizing fluorescent labeled BAC probes hybridizing to metaphase chromosomes and interphase nuclei (inset). (B) FISH probes for MST1 (20q13) demonstrating two signals in metaphase chromosomes and two signals in the interphase nucleus in the A204 cell line, indicating no deletions of the MST1 gene region are present. (C) FISH probes for MST2 (8q22) demonstrating polyploidy, but no deletions of the MST2 gene region. (D) FISH probes for LATS1 (6q25) demonstrate polyploidy, but no deletions of the LATS1 gene region (E) FISH probes for LATS2 (13q12) demonstrate a normal disomic pattern in both the metaphase chromosomes and the interphase nucleus in the A204 cell line, indicating no deletions of the LATS2 gene region (F) FISH for LATS2 in the RD cell line, demonstrating disomic signal pattern in a polyploid cell. Although a deletion or loss of chromosome 13 is present, two copies of LATS2 are still present. (G) Table summarizing FISH results. No deletions were observed in MST1, MST2, or LATS1. A deletion was noted in RD, however the cell line is polyploid, and two copies of LATS2 were still present.
Figure 5. Loss of expression of the Hippo kinases at the RNA level and reconstitution with 5-azacytidine in sarcoma cell lines evaluated by quantitative RT-PCR
Loss of expression was defined as a two-fold or greater decrease of expression of the Hippo kinases (0.5 fold decrease in expression as compared to GCT). Increase in expression was defined as a two-fold or greater increase in expression after treatment with 10 μM 5-azacytidine. (A) MST1 expression is decreased at the RNA level in 5 of 12 sarcoma cell lines (42%). MST2 expression is decreased in 3 of 12 sarcoma cell lines (25%). LATS1 expression is decreased in 1 of 12 sarcoma cell lines (8%). No decrease in LATS2 expression is detected (0%). (B) TCGA data demonstrating that MST2 expression is inversely proportional to CpG island methylation (Spearman's correlation coefficient r = −0.4). (C) MST1 expression is increased after treatment with 5-azacytidine in 1 of 12 cell lines (8%). MST2 expression is increased after treatment in 2 of 12 cell lines (17%). Neither LATS1 nor LATS2 expression is increased in any (0%) of the cell lines after treatment with 5-azacytidine. Statistical analysis is shown for cell lines demonstrating a two-fold or greater decrease in expression. Statistical significance determined by two-tailed _t_-test. * indicates p < 0.05; ** indicates p < 0.01; *** indicates p < 0.001.
Figure 6. Increase in expression of the Hippo kinases after treatment with trichostatin-A (0.5 μM), 5-azacytidine (5 μM), and trichostatin-A (0.5 μM) plus 5-azacytidine (5 μM) unless indicated by asterisk
SJCRH30* cell line was treated with 0.125 μM trichostatin-A, SNF02.2* was treated with 0.25 μM trichostatin-A. HT1080*, SKLMS1*, and SW982* cell lines were treated with 1 μM 5-azacytidine. Increase in expression after treatment with trichostatin-A and/or 5-azacytidine is defined as a two-fold or greater increase in expression after treatment. (A) Trichostatin-A (TSA) stimulated an increase in expression of MST1 in 7 of 12 sarcoma cell lines (58%). 5-azacytidine (AZA) at 5 μM did not cause an increase in expression of MST1. TSA and AZA had a statistically significant additive effect in the HT1080 cell line only. (B) Trichostatin-A (TSA) stimulated an increase in expression of MST2 in 8 of 12 sarcoma cell lines (67%). At 5 μM 5-azacytidine, there is no increase in expression of MST2. No additive effect of adding 5-azacytidine and trichostatin-A was identified in the sarcoma cell lines. (C) No increase in expression in LATS1 was identified with TSA, AZA, or TSA plus AZA. (D)TSA drove an increase in expression of LATS2 in 1 of 12 sarcoma cell lines (8%). AZA caused an increase in expression of LATS2 in the HT1080 cell line. A statistically significant additive effect was seen in the HT1080 and RD cell lines with simultaneous treatment with trichostatin A and 5-azacytidine. Statistical analysis is shown for cell lines/conditions demonstrating a two-fold or greater decrease in expression with TSA or AZA treatment alone. Stastistical analysis is also shown for cell lines demonstrating an additive effect with treatment with TSA and AZA. Statistical significance determined by two-tailed _t_-test. * indicates p < 0.05; ** indicates p < 0.01; *** indicates p < 0.001.
Figure 7
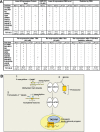
(A) Summary of cell lines diagram. Expression of the Hippo kinases was lost at the protein level in 0% (LATS1) to 58% (MST1) of the sarcoma cell lines, indicated by (+). Accumulation of the Hippo kinases with treatment with MG132, indicated by (+), was noted only for MST2, indicating that proteosomal degradation is an important mechanism by which MST2 expression is lost. Loss of expression at the RNA level was identified for MST1 (42%) and MST2 (25%) of sarcoma cell lines. Loss of expression at the RNA level for LATS1 and LATS2 was negligible. Deletions of the Hippo kinases were essentially absent from the sarcoma cell lines with the exception of LATS2, where 1 of the 12 sarcoma cell lines (8%) demonstrated a deletion. Treatment with 10 μM 5-azacytidine resulted in a modest increase in expression in 8–17% of the sarcoma cell lines. Treatment with 0.5 μM TSA resulted in a reversal of expression in a higher percentage of cell lines, predominantly with MST1 and MST2. Treatment with TSA and 5-azacytidine showed an additive effect with regards to re-expressing the Hippo kinases in some cell lines. (B) Expression of the Hippo kinases is regulated by at least three different mechanisms shown in this model, potentially targetable by different therapeutic interventions. Promoter (CpG island) hypermethylation is one mechanism that appears to modestly regulate the expression of predominantly MST1 and MST2. Histone deacetylation can also promote silencing the expression of the Hippo kinases, again particularly MST1 and MST2, and to a lesser degree LATS2. Proteosomal degradation plays a role in in regulating the expression of MST2 and could be targeted as well.
Similar articles
- Tubule-Specific Mst1/2 Deficiency Induces CKD via YAP and Non-YAP Mechanisms.
Xu C, Wang L, Zhang Y, Li W, Li J, Wang Y, Meng C, Qin J, Zheng ZH, Lan HY, Mak KK, Huang Y, Xia Y. Xu C, et al. J Am Soc Nephrol. 2020 May;31(5):946-961. doi: 10.1681/ASN.2019101052. Epub 2020 Apr 6. J Am Soc Nephrol. 2020. PMID: 32253273 Free PMC article. - Frequent hypermethylation of MST1 and MST2 in soft tissue sarcoma.
Seidel C, Schagdarsurengin U, Blümke K, Würl P, Pfeifer GP, Hauptmann S, Taubert H, Dammann R. Seidel C, et al. Mol Carcinog. 2007 Oct;46(10):865-71. doi: 10.1002/mc.20317. Mol Carcinog. 2007. PMID: 17538946 - H-ras Inhibits the Hippo Pathway by Promoting Mst1/Mst2 Heterodimerization.
Rawat SJ, Araiza-Olivera D, Arias-Romero LE, Villamar-Cruz O, Prudnikova TY, Roder H, Chernoff J. Rawat SJ, et al. Curr Biol. 2016 Jun 20;26(12):1556-1563. doi: 10.1016/j.cub.2016.04.027. Epub 2016 May 26. Curr Biol. 2016. PMID: 27238285 Free PMC article. - Protein kinases of the Hippo pathway: regulation and substrates.
Avruch J, Zhou D, Fitamant J, Bardeesy N, Mou F, Barrufet LR. Avruch J, et al. Semin Cell Dev Biol. 2012 Sep;23(7):770-84. doi: 10.1016/j.semcdb.2012.07.002. Epub 2012 Aug 9. Semin Cell Dev Biol. 2012. PMID: 22898666 Free PMC article. Review. - MST1/MST2 Protein Kinases: Regulation and Physiologic Roles.
Galan JA, Avruch J. Galan JA, et al. Biochemistry. 2016 Oct 4;55(39):5507-5519. doi: 10.1021/acs.biochem.6b00763. Epub 2016 Sep 26. Biochemistry. 2016. PMID: 27618557 Free PMC article. Review.
Cited by
- Extracellular matrix stiffness regulates degradation of MST2 via SCF βTrCP.
Fiore APZP, Rodrigues AM, Ribeiro-Filho HV, Manucci AC, de Freitas Ribeiro P, Botelho MCS, Vogel C, Lopes-de-Oliveira PS, Pagano M, Bruni-Cardoso A. Fiore APZP, et al. Biochim Biophys Acta Gen Subj. 2022 Dec;1866(12):130238. doi: 10.1016/j.bbagen.2022.130238. Epub 2022 Aug 28. Biochim Biophys Acta Gen Subj. 2022. PMID: 36044955 Free PMC article. - Discoidin Domain Receptors, DDR1b and DDR2, Promote Tumour Growth within Collagen but DDR1b Suppresses Experimental Lung Metastasis in HT1080 Xenografts.
Wasinski B, Sohail A, Bonfil RD, Kim S, Saliganan A, Polin L, Bouhamdan M, Kim HC, Prunotto M, Fridman R. Wasinski B, et al. Sci Rep. 2020 Feb 11;10(1):2309. doi: 10.1038/s41598-020-59028-w. Sci Rep. 2020. PMID: 32047176 Free PMC article. - Sequential targeting of YAP1 and p21 enhances the elimination of senescent cells induced by the BET inhibitor JQ1.
Zhang HT, Gui T, Liu RX, Tong KL, Wu CJ, Li Z, Huang X, Xu QT, Yang J, Tang W, Sang Y, Liu W, Liu N, Ross RD, He QY, Zha ZG. Zhang HT, et al. Cell Death Dis. 2021 Jan 25;12(1):121. doi: 10.1038/s41419-021-03416-1. Cell Death Dis. 2021. PMID: 33495462 Free PMC article. - Comparative oncology reveals DNMT3B as a molecular vulnerability in undifferentiated pleomorphic sarcoma.
Fuller AM, DeVine A, Murazzi I, Mason NJ, Weber K, Eisinger-Mathason TSK. Fuller AM, et al. Cell Oncol (Dordr). 2022 Dec;45(6):1277-1295. doi: 10.1007/s13402-022-00717-1. Epub 2022 Oct 1. Cell Oncol (Dordr). 2022. PMID: 36181640 Free PMC article. - Molecular dynamics simulations of a multicellular model with cell-cell interactions and Hippo signaling pathway.
Umegaki T, Moriizumi H, Ogushi F, Takekawa M, Suzuki T. Umegaki T, et al. PLoS Comput Biol. 2024 Nov 11;20(11):e1012536. doi: 10.1371/journal.pcbi.1012536. eCollection 2024 Nov. PLoS Comput Biol. 2024. PMID: 39527559 Free PMC article.
References
- Chan SW, Lim CJ, Guo K, Ng CP, Lee I, Hunziker W, Zeng Q, Hong W. A role for TAZ in migration, invasion, and tumorigenesis of breast cancer cells. Cancer Res. 2008;68:2592–2598. - PubMed
- Zhao D, Zhi X, Zhou Z, Chen C. TAZ antagonizes the WWP1-mediated KLF5 degradation and promotes breast cell proliferation and tumorigenesis. Carcinogenesis. 2012;33:59–67. - PubMed
LinkOut - more resources
Full Text Sources
Other Literature Sources
Research Materials
Miscellaneous
