YouTube Data Scraping, Preprocessing and Analysis using Python (original) (raw)
Last Updated : 14 Jan, 2026
YouTube is one of the largest video-sharing platforms, hosting millions of videos across diverse categories and audiences. Analyzing YouTube data helps uncover valuable insights about content performance, viewer engagement and emerging trends. In this article, we will use real YouTube channel data to extract meaningful patterns and visualise key metrics effectively using Python.
Web Scraping
Web scraping is the process of automatically extracting data from websites. Here we focus on scraping YouTube video data using Python tools like requests and BeautifulSoup, which allows us to collect information such as video titles, views and upload dates for analysis or research purposes.
1. Installing Required Libraries
Here we install requests, beautifulsoup4 and xlsxwriter
Python `
!pip install requests beautifulsoup4 xlsxwriter --quiet
`
2. Importing Libraries
Libraries for sending HTTP requests, parsing HTML content, handling JSON data and writing Excel files are imported to support the scraping pipeline.
Python `
import requests from bs4 import BeautifulSoup import json import xlsxwriter
`
3. Sending HTTP Request to YouTube Page
An HTTP request is sent to the YouTube channel’s videos page. A User-Agent header is included to mimic a real browser and avoid request blocking.
Here we will be using: **https://www.youtube.com/c/GeeksforGeeksVideos/videos
Python `
url = "https://www.youtube.com/c/GeeksforGeeksVideos/videos" headers = {"User-Agent": "Mozilla/5.0"} response = requests.get(url, headers=headers) html = response.text
`
4. Creating the BeautifulSoup Object
The HTML response obtained from the request is parsed using BeautifulSoup. This allows structured navigation through the page and easy extraction of required elements.
Python `
soup = BeautifulSoup(html, "html.parser")
`
YouTube loads video data dynamically using JavaScript. The embedded ytInitialData JSON is extracted from the page source to access structured video information.
Python `
script_tag = soup.find("script", text=lambda t: t and "var ytInitialData = " in t) json_text = script_tag.string.strip()[len("var ytInitialData = "):-1] data = json.loads(json_text)
`
6. Navigating to Video Metadata
The nested JSON structure is traversed to locate the section containing individual video metadata. This includes information such as video title, view count and duration.
Python `
videos_data = data['contents']['twoColumnBrowseResultsRenderer']['tabs'][1]
['tabRenderer']['content']['richGridRenderer']['contents']
`
7. Extracting Titles, Views and Durations
Each video entry is processed in a loop to extract relevant fields safely. The extraction is limited to the most recent 30 videos to keep the dataset manageable.
Python `
titles, views, durations = [], [], [] count = 0
for item in videos_data: try: video = item['richItemRenderer']['content']['videoRenderer'] titles.append(video['title']['runs'][0]['text']) views.append(video.get('viewCountText', {}).get('simpleText', 'N/A')) durations.append(video.get('lengthText', {}).get('simpleText', 'N/A')) count += 1 if count >= 30: break except: continue
`
8. Creating the Excel File
An Excel workbook and worksheet are created using XLSXWriter. Column headers are added to clearly represent each extracted data attribute.
Python `
workbook = xlsxwriter.Workbook("youtube_videos.xlsx") sheet = workbook.add_worksheet()
sheet.write(0, 0, "Title") sheet.write(0, 1, "Views") sheet.write(0, 2, "Duration")
`
9. Writing Data to Excel Sheet
The extracted video data is written row-by-row into the Excel sheet. This ensures that each video details are stored in a structured tabular format.
Python `
for i in range(len(titles)): sheet.write(i+1, 0, titles[i]) sheet.write(i+1, 1, views[i]) sheet.write(i+1, 2, durations[i])
`
10. Saving the File
The workbook is closed to save the Excel file properly. This completes the web scraping process and stores the data for further analysis.
Python `
workbook.close() print("Scraped latest 30 videos successfully! Saved as youtube_videos.xlsx")
`
**Output:
Scraped latest 30 videos successfully! Saved as youtube_videos.xlsx
Data Preprocessing
Scraped data often contains text-based values and inconsistencies. Data preprocessing cleans and standardizes the data to make it suitable for analysis and visualization.
1. Importing the Data
The scraped Excel file is loaded into a pandas DataFrame. This allows efficient data manipulation and preprocessing operations.
Python `
import pandas as pd
data = pd.read_excel("youtube_videos.xlsx") data.head()
`
**Output:
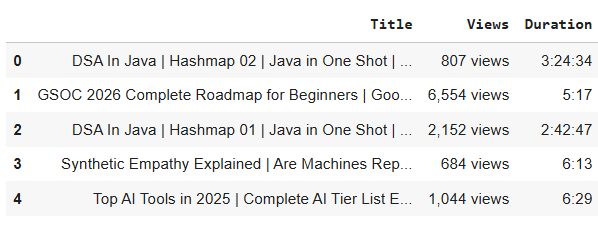
Top 4 rows
**2. Cleaning the Views Column
The Views column contains textual information. First the views suffix is removed. Then views are converted to numeric values:
- Removing the views suffix.
- Converting values ending with K to numeric by multiplying by 1000.
- Converting plain numeric strings to floats.
- Setting any inconsistent or missing entries to None Python `
data['Views'] = data['Views'].str.replace(" views", "", regex=False).str.strip()
cleaned_views = []
for i in data['Views']:
if pd.isna(i):
cleaned_views.append(None)
continue
i = str(i).replace(",", "")

if i.endswith('K') or i.endswith('k'):
    i = i.replace('K', '').replace('k', '')
    try:
        cleaned_views.append(float(i) * 1000)
    except:
        cleaned_views.append(None)
else:
    try:
        cleaned_views.append(float(i))
    except:
        cleaned_views.append(None)
data['Views'] = cleaned_views
`
3. Cleaning the Duration Column
Here we:
- Removes newline characters.
- Converts durations to total seconds.
- Sets invalid or missing entries to None. Python `
data['Duration'] = data['Duration'].str.replace("\n", "", regex=False) def duration_to_seconds(duration_str): if pd.isna(duration_str) or duration_str in ['SHORTS', 'N/A']: return None parts = str(duration_str).split(':') if len(parts) == 3: h, m, s = map(int, parts) return h * 3600 + m * 60 + s elif len(parts) == 2: m, s = map(int, parts) return m * 60 + s return None
data['Duration'] = data['Duration'].apply(duration_to_seconds)
`
4. Categorizing Videos by Duration
Videos are grouped into categories based on their duration. This simplifies analysis and helps compare different types of content.
Python `
for i in data.index: val = data.loc[i, 'Duration']
if val is None:
    continue
elif val < 900:
    data.loc[i, 'Duration'] = 'Mini-Videos'
elif val < 3600:
    data.loc[i, 'Duration'] = 'Long-Videos'
else:
    data.loc[i, 'Duration'] = 'Very-Long-Videos'
data.head()
`
**Output:
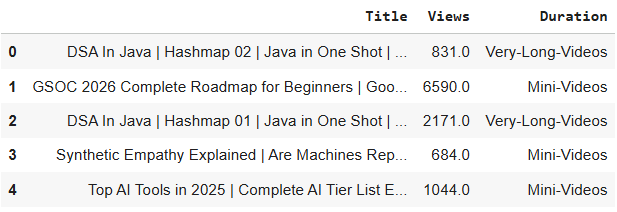
Top 4 rows after data Preprocessing
Text Preprocessing
This is an important step in preparing textual data such as video titles, for tasks like text analysis, sentiment analysis or machine learning models. Preprocessing ensures that the text is normalized, clean and meaningful reducing noise and irrelevant information.
1. Importing Required Libraries
Libraries like regular expressions and nltk are imported. These tools help clean and process textual data efficiently.
Python `
import re from tqdm import tqdm import nltk
nltk.download('punkt') nltk.download('stopwords') nltk.download('punkt_tab')
from nltk.corpus import stopwords from nltk.tokenize import word_tokenize from nltk.stem.porter import PorterStemmer
`
2. Initializing Stopwords and Stemmer
Stopwords are removed to eliminate commonly used but insignificant words. Stemming is applied to reduce words to their base form.
Python `
stop_words = set(stopwords.words('english')) stemmer = PorterStemmer()
`
3. Defining the Text Preprocessing Function
The preprocess_text() function performs the following steps for each title:
- **Lowercasing: converts all text to lowercase for uniformity.
- **Removing URLs: strips out links that do not contribute to analysis.
- **Removing non-alphabetic characters: keeps only letters and spaces.
- **Tokenization: splits text into individual words.
- **Stopword Removal and Stemming: filters out irrelevant words and reduces words to their root form.
- **Joining tokens: combines the processed tokens back into a clean sentence. Python `
def preprocess_text(text_data): preprocessed_text = []
for sentence in tqdm(text_data):
    sentence = str(sentence).lower()

    sentence = re.sub(r'http\S+|www\S+|https\S+', '', sentence)

    sentence = re.sub(r'[^a-z\s]', '', sentence)

    tokens = word_tokenize(sentence)

    tokens = [stemmer.stem(word) for word in tokens if word not in stop_words]

    preprocessed_text.append(" ".join(tokens))

return preprocessed_text
`
4. Applying Text Preprocessing on Video Titles
The preprocessing function is applied to all video titles. The cleaned text is stored back in the DataFrame for further analysis.
Python `
data['Title'] = preprocess_text(data['Title'].values) data.head()
`
**Output:
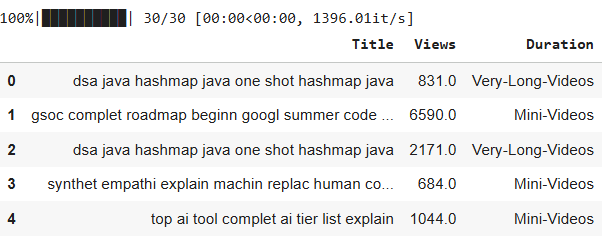
Output
Data Visualization
Data visualization helps convert processed data into graphical form. It makes patterns, trends and insights easier to understand.
1. Word Cloud of Video Titles
A Word Cloud provides a visual representation of the most frequent words in video titles. Larger words indicate higher frequency, helping identify trending topics or common keywords in the channel’s content.
Python `
from wordcloud import WordCloud import matplotlib.pyplot as plt import seaborn as sns
sns.set(style="whitegrid")
consolidated = ' '.join(word for word in data['Title'].astype(str))
wordCloud = WordCloud( width=1600, height=800, random_state=21, max_font_size=110, collocations=False, background_color='white' )
plt.figure(figsize=(15, 10)) plt.imshow(wordCloud.generate(consolidated), interpolation='bilinear') plt.axis('off') plt.title("WordCloud of Video Titles", fontsize=20) plt.show()
`
**Output:
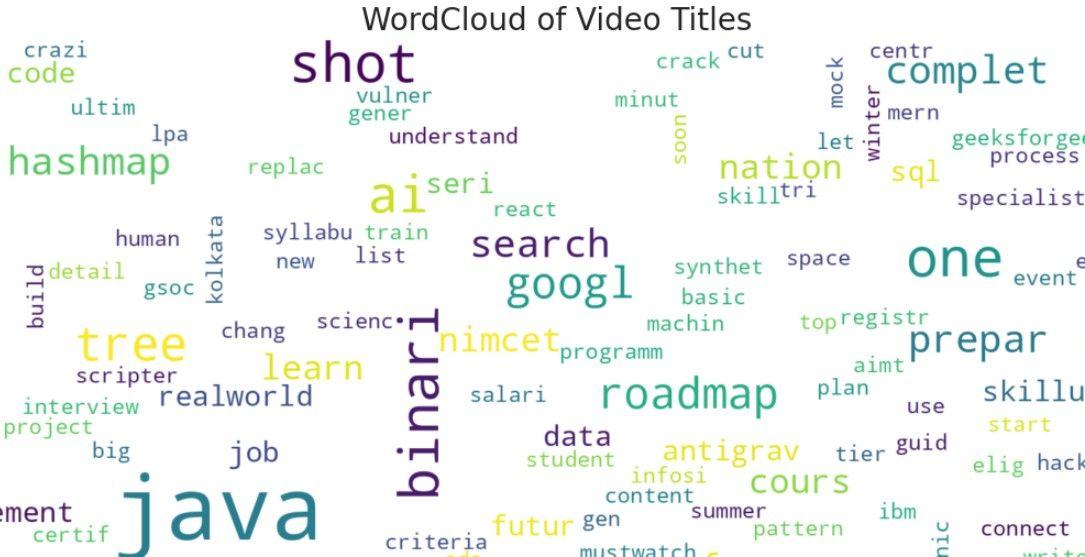
WordCloud
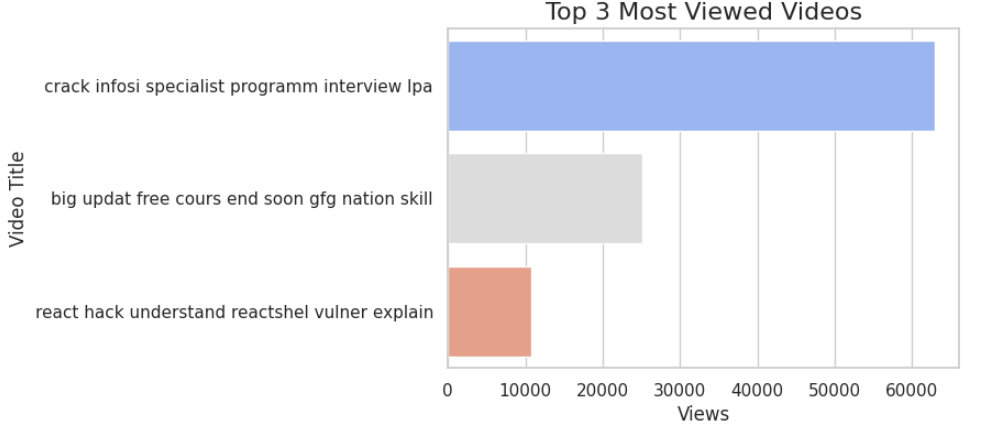
2. Top 3 Most Viewed Videos
A bar plot is used to display the top-performing videos based on view count. This visualization clearly shows which videos attract the most audience engagement.
Python `
top_videos = data.sort_values(by='Views', ascending=False).head(3)
plt.figure(figsize=(12, 6)) sns.barplot( x='Views', y='Title', data=top_videos, palette='coolwarm' ) plt.title("Top 3 Most Viewed Videos", fontsize=16) plt.xlabel("Views") plt.ylabel("Video Title") plt.show()
`
**Output:
Output
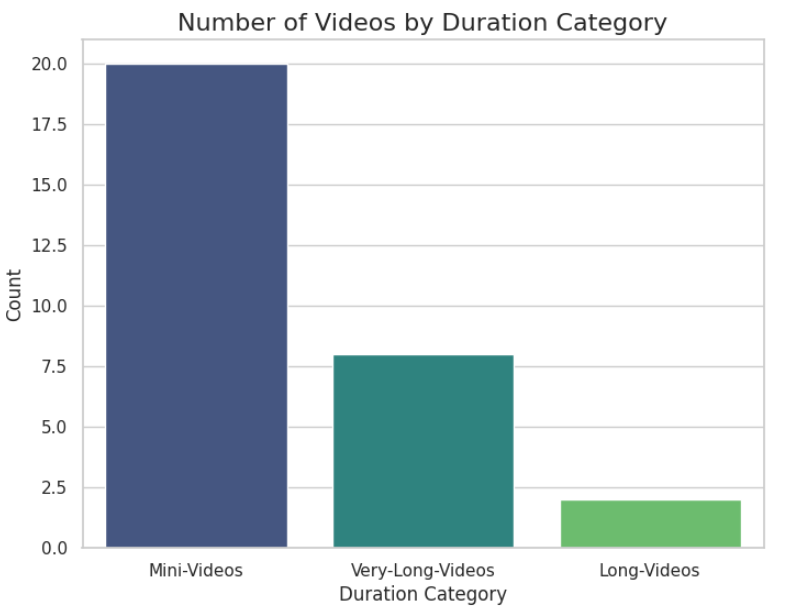
3. Video Count by Duration Category
A count plot visualizes the distribution of videos across different duration categories such as Mini-Videos, Long-Videos and Very-Long-Videos. This helps understand the type of content the channel focuses on.
Python `
plt.figure(figsize=(8, 6)) sns.countplot( x='Duration', data=data, palette='viridis', order=data['Duration'].value_counts().index ) plt.title("Number of Videos by Duration Category", fontsize=16) plt.ylabel("Count") plt.xlabel("Duration Category") plt.show()
`
**Output:
View count
You can download full code from here