Nominal Data (original) (raw)
Last Updated : 25 May, 2026
Nominal data is a type of categorical data used to label or classify items into different groups without any order or ranking. The categories are distinct, mutually exclusive, and represent qualities or names rather than numerical values. Since there is no meaningful order among the categories, arithmetic operations cannot be performed on nominal data.
Characteristics of Nominal Data
The following characteristics help in understanding the nature and properties of nominal data.
- Nominal data is qualitative in nature and describes categories or labels.
- The categories are distinct and mutually exclusive, meaning an item can belong to only one category at a time.
- Nominal data does not have any fixed order or ranking among its categories.
- Arithmetic operations such as addition, subtraction, multiplication, and division cannot be performed on nominal data.
- The mode can be calculated for nominal data, but the mean and median cannot be determined.
Methods of Collecting Nominal Data
Nominal data is collected by classifying information into different categories or labels. Some common methods used to collect nominal data are given below:
- **Surveys and Questionnaires: Surveys use multiple-choice questions where respondents select one option from a set of categories.
Example: Favourite cuisine – Italian, Chinese, Mexican, or Indian. - **Interviews: Interviews are conducted to gather categorical information from individuals through direct questions.
Example: Asking a person about their marital status or occupation. - **Observation Method: Data is collected by observing and recording categories based on visible characteristics.
Example: Recording the types of vehicles in a parking area. - **Administrative or Official Records: Existing records and databases are used to collect category-based information.
Example: Hospital records containing patients’ blood groups. - **Online Forms and Registration Sheets: Online forms use dropdown menus, radio buttons, or checkboxes to collect categorical responses.
Example: A registration form asking users to select their gender
Visualisation Techniques for Nominal Data
Some common techniques for visualisation for nominal data are:
Frequency Tables
Frequency tables list the categories along with their corresponding frequencies or counts. They provide a simple and organised way to summarise nominal data.
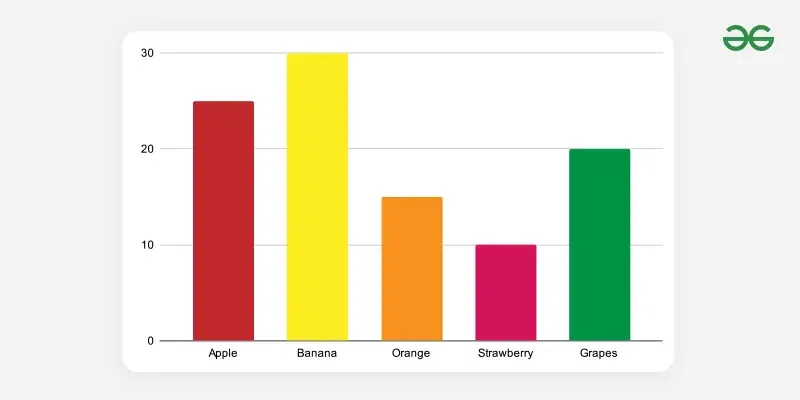
For example, suppose a questionnaire asks 100 people about their favourite fruit from the categories “Apple,” “Banana,” “Orange,” “Strawberry,” and “Grapes.” The frequency table for this data is shown below:
| Fruit | Number of People |
|---|---|
| Apple | 25 |
| Banana | 30 |
| Orange | 15 |
| Strawberry | 10 |
| Grapes | 20 |
Bar Charts
Bar charts are one of the most straightforward ways to visualise nominal data. Each category is represented by a bar, and the length or height of the bar corresponds to the frequency or count of that category. This method allows for easy comparison between categories.
Bar Chart for the above-mentioned data is as follows:
Pie Charts
Pie charts display data in a circular format, where each slice represents a category's proportion relative to the whole dataset. This visualisation is useful for showing the parts of a whole.
For the data discussed above,w e can represent the same data as
| Fruit | Number of People | Calculation | Percentage |
|---|---|---|---|
| Apple | 25 | (25/100)×100 | 25% |
| Banana | 30 | (30/100)×100 | 30% |
| Orange | 15 | (15/100)×100 | 15% |
| Strawberry | 10 | (10/100)×100 | 10% |
| Grapes | 20 | (20/100)×100 | 20%The pie |
The chart for this data is:

**Related Articles