Range in Statistics (original) (raw)
Last Updated : 5 Dec, 2025
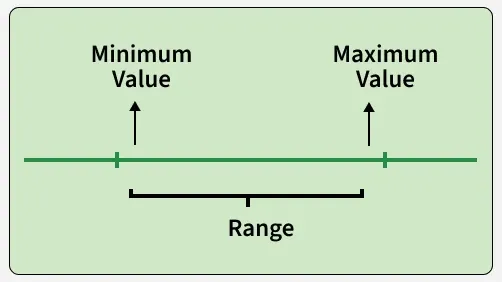
In statistics, the range is the difference between the highest and lowest values in a dataset. It offers a simple way to understand the spread or variability of the data. While it's easy to calculate but it only considers the extreme values and does not reflect how the other values are distributed across the dataset.
Range
Range Formula
Below is the range formula of statistics.
Range = Maximum Value - Minimum Value
How to Calculate Range?
- Identify the maximum value (the largest value) in your dataset.
- Identify the minimum value (the smallest value) in your dataset.
- Subtract the minimum value from the maximum value to find the range.
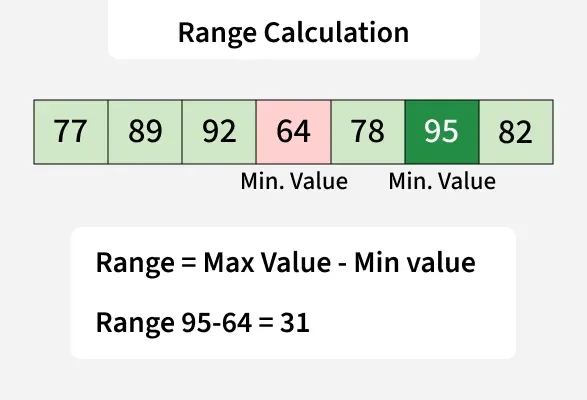
**Example: Consider the following dataset of exam scores for a class tenth: 77, 89, 92, 64, 78, 95, 82.
Find the Range of the above data
**Solution:
Now To Calculate the range
Here, Select The Largest Score as Maximum Value and Smallest score as Minimum Value:
Range Calculation
Maximum value = 95
Minimum value = 64
**Range = 95 - 64 = 31So, the range of the exam scores in this dataset is 31.
Range in Dataset
The range of a dataset is quite simple to understand. It is the difference between the highest (maximum) and lowest (minimum) values in that dataset. This simple formula provides a quick way to quantify the spread of data.
Range for Grouped Data
In Grouped data where the datasets are arranged in Class Intervals, the Range is find by subtracting the lower limit of the first class interval and the upper limit of the last class interval.
| Class Interval | Frequency |
|---|---|
| 0-10 | 12 |
| 10-20 | 10 |
| 20-30 | 15 |
| 30-40 | 13 |
| 40-50 | 11 |
Range = Upper Limit of the Last Class Interval - Lower Limit of First Class Interval = 50-0 = 50
Range Applications
The applications of range are mentioned below:
- Range has got its application in various fields, such as mathematics, science, economics and social sciences.
- Range is basically used to analyze the variation and dispersion of a dataset.
- Range is used in educational assessments to understand the variation in scores of Students
- In clinical trials and medical research, the range of outcomes for a particular treatment or medication is studied to determine its effectiveness and potential side effects.
- In sports, range can be applied to analyze player's performance.
Solved Examples on Range
**Example 1: You are given a dataset of the ages of students in a classroom: 18, 19, 20, 21, 22, 35, 18, 23?
**Solution:
Maximum Value = 35
Minimum Value = 18
Range = 35 - 18 = 17
The range of ages among the students is 17 years.
**Example 2: You are given a dataset of the heights of students in a classroom(in cm): 150, 155, 160, 165, 170, 175. Find Range.
**Solution:
Maximum Value = 175 cm
Minimum Value = 150 cm
Range = 175 - 150 = 25 cm
The range of heights of students is 25 cm
**Example 3: Consider a dataset of exam scores for a class: Scores: 85, 92, 78, 96, 64, 89, 75, find the range?
**Solution:
Maximum Value = 96
Minimum Value = 64
Range = 96 - 64 = 32
So, the range of the exam scores is 32.
**Example 4: Consider a dataset of daily temperature of a city( in °F): 68°F, 72°F, 75°F, 70°F, 74°F. Find temperature range.
**Solution:
Maximum Value = 75°F
Minimum Value = 68°F
Range = 75 - 68 = 7°F
Hence the temperature range is 7°F
**Example 5: Imagine a dataset of monthly rainfall (in millimeters) for a city for the past year:
Rainfall: 50, 48, 52, 58, 45, 70, 65, 80, 40, 42, 75, 90, find the range of monthly rainfall for the city?
**Solution:
Maximum Value = 90
Minimum Value = 40
Range = 90 - 40 = 50
The range of monthly rainfall for the city is 50 mm
**Example 6: Consider the following dataset representing the ages of participants in a survey: 22, 28, 34, 31, 25, 30, 29, 33, 27, 24
Calculate the range of the ages in this dataset.
**Solution:
Identify the Maximum Value: The highest age in the dataset is 34.
Identify the Minimum Value: The lowest age in the dataset is 22.
Calculate the Range:
Range = Maximum value − Minimum value
Range = Maximum value−Minimum value = 34−22 = 12
Answer: The range of the ages in this dataset is 12 years.
**Example 7: Compare and contrast the range with other measures of variability such as variance and standard deviation.
**Solution:
- Range: Measures the difference between the maximum and minimum values; it is simple but sensitive to outliers.
- Variance: Measures the average squared deviation of each data point from the mean, providing a more comprehensive understanding of variability, but is more complex to calculate.
- Standard Deviation: The square root of variance, it is also a measure of spread but is in the same units as the data, making it easier to interpret than variance.
Practice Questions On Range In Statistics
**Q.1. You have the following test scores of 5 students: 85, 90, 78, 92, 88. Determine the range of the test scores.
**Q.2. A researcher records the temperatures (in °C) of 6 cities on a particular day: 12, 15, 14, 19, 21, 16. Find the range of temperatures.
**Q.3. Consider the following data for the number of books read by students in a year: 4, 9, 15, 7, 12, 6. Find the range of the dataset.
**Q.4. A dataset of temperatures in degrees Celsius for a week is given as follows: 18, 22, 20, 25, 19, 28, 17. Find the range?
**Q.5. Calculate the range of the following dataset: 17, 24, 32, 28, 41, 35, 30.
**Q.6. Calculate the range for the following dataset: 12, 15, 20, 25, 30, 35, 40, 45?
**Q7. You have a dataset of the heights (in inches) of a group of individuals: 62, 67, 71, 68, 70, 75, 61, 66, 69, 70. Determine the range of heights?
**Q.8. A survey of 10 people recorded their ages as follows: 25, 32, 28, 45, 34, 50, 29, 41, 33, 36. Calculate the range of the ages.
**Q.9. Given the following grouped data, calculate the range:
| Class Interval | Frequency |
|---|---|
| 0-20 | 8 |
| 20-40 | 12 |
| 40-60 | 15 |
| 60-80 | 10 |
**Q.10. For the grouped data below, determine the range:
| Class Interval | Frequency |
|---|---|
| 5-15 | 14 |
| 15-25 | 9 |
| 25-35 | 11 |
| 35-45 | 6 |