Variance and Standard Deviation (original) (raw)
Last Updated : 5 Dec, 2025
Variance and Standard Deviation are the important measures used in Mathematics and statistics to find meaning from a large set of data. The different formulas for Variance and Standard Deviation are highly used in mathematics to determine the trends of various values in mathematics. Variance is the measure of how the data points vary according to the mean, while standard deviation is the measure of the central tendency of the distribution of the data.

Variance and Standard Deviation
The major difference between variance and standard deviation is in their units of measurement. Standard deviation is measured in a unit similar to the units of the mean of data, whereas the variance is measured in squared units.
Variance
Variance is defined as "The measure of how far the set of data is dispersed from their mean value". Variance is represented with the symbol σ2. In other words, we can also say that the variance is the average of the squared difference from the mean.
Properties of Variance
Various properties of the Variance of the group of data are,
- As each term in the variance formula is firstly squared and then their mean is found, it is always a non-negative value, i.e. mean can be either positive or can be zero, but it can never be negative.
- Variance is always measured in squared units. For example, if we have to find the variance of the height of the students in a class and if the height of the student is given in cm, then the variance is calculated in cm2.
Variance Formula
There are two formulas for Variance, that are:
- Population Variance
- Sample Variance
Formula for Population Variance
The mathematical formula to find the variance of the given data is,
\bold{\sigma^2 = \sum_{i=1}^n{\frac{(x_i - \bar{x})^2}{n}}}
Where,
- **σ 2 is the Variance of the Population,
- **N is the Number of Observation in the Population,
- **X i is the ith observation in the Population and
- **x̄ is the mean of the Population.
This formula is also called the Population variance formula as it is used for finding the variation in the population data.
Formula for Sample Variance
Also, The other formula for finding the variance is the sample variance formula, which is discussed in the image.
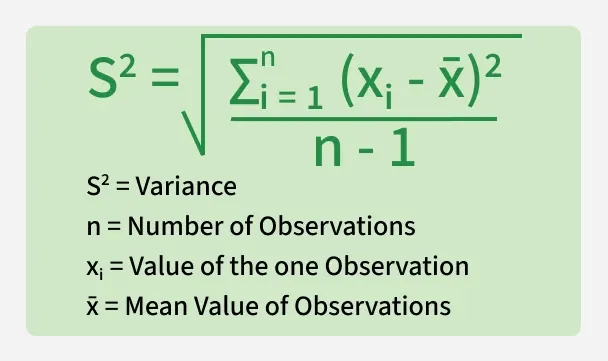
Formula for Sample Variance
Standard Deviation
How far our given set of data varies from. the mean of the data is measured in standard deviation. Thus, we define standard deviation as the "spread of the statistical data from the mean or average position". We denote the standard deviation of the data using the symbol σ.
We can also define the standard deviation as the square root of the variance.
Properties of Standard Deviation
Various properties of the Variance of the group of data are,
- Standard Deviation is the square root of the variance of the given data set. It is also called root mean square deviation.
- Standard Deviation is a non-negative quantity i.e., it always has positive values or zero values.
- If all the values in a data set are similar then the Standard Deviation has a value close to zero. Whereas if the values in a data set are very different from each other,****,** then standard deviation has a high positive value.
Standard Deviation Formula
There are two formulas for the standard deviation listed as follows:
- Population Standard Deviation
- Sample Standard Deviation
Formula for Population Standard Deviation
The mathematical formula to find the standard deviation of the given data is,
s = \sqrt{\frac{\sum_{i=1}^n (x_i - x̄)^2}{n}}
Where,
- **σis the Standard Deviation of the Population,
- **N is the Number of Observation in the Population,
- **X i is the ith observation in the Population and
- **X̄ is the mean of the Population
This formula is also called the Population standard deviation formula as it is used for finding the standard deviation in the population data.
Formula for Sample Standard Deviation
Sample variance formula is discussed in the image below,
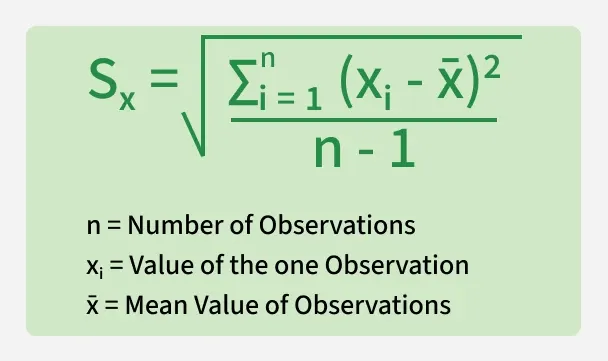
Formula for Sample Standard Deviation
**Learn more about, **Standard Deviation Formula
Relation between Standard Deviation and Variance
Variance and Standard deviation are the most common measure of the given set of data. They are used to find the deviation of the values from their mean value or the spread of all the values of the data set.
- Variance is defined as the average degree through which all the values of a given data set deviate from the mean value.
- Standard Deviation is the degree to which the values in a data set are spread out concerning****,** the mean value.
The relationship between Variance and Standard Deviation is discussed below.
Variance = (Standard Deviation)2
OR
√(Variance) = Standard Deviation
Variance vs Standard deviation
The differences between Standard Deviation and Variance are discussed in the table below.
| Standard Deviation | Variance |
|---|---|
| Standard Deviation is defined as the square root of the variance. | Variance is defined as the average of the squared differences from the mean. |
| Standard deviation provides a measure of the typical distance between data points and the mean. | Variance provides a measure of the average squared distance between data points and the mean. |
| It is represented by the Greek symbol σ. | It is represented by a square of the Greek symbol sigma. i.e. σ2. |
| It has the same unit as the data set. | Its unit is the square of the unit of the data set. |
| It represents the volatility in the market or given data set. | It represents the degree to which the average return varies according to the long-term change in the market. |
Solved Questions on Variance and Standard Deviation
**Question 1: Find the variance and standard deviation of all the possibilities of rolling a die.
**Solution:
All possible outcomes of rolling a die are {1; 2; 3; 4; 5; 6}.
This data set has six values (n) = 6
Before finding the variance, we need to find the mean of the data set.
Mean, x̅ = (1+2+3+4+5+6)/6 = 3.5
We can put the value of data and mean in the formula to get;
σ2 = Σ (xi – x̅)2/n
⇒ σ2 = [(1-3.5)2 + (2-3.5)2 + (3-3.5)2 + (4-3.5)2 + (5-3.5)2 + (6-3.5)2]/6
⇒ σ2 = (6.25+2.25+0.25+0.25+2.25+6.25)/6Variance (σ2) = 2.917
Now,
Standard Deviation (σ) = √ (σ2)
⇒ Standard Deviation (σ) = √(2.917)
⇒ Standard Deviation (σ) = 1.708
**Question 2: Find the variance and standard deviation of all the even numbers less than 10. , Find the variance and standard deviation of all the even numbers less than 10.
Even Numbers less than 10 are {2, 4, 6, 8}
This data set has five values (n) = 4
Before finding the variance, we need to find the mean of the data set.
Mean, x̅ = (2+4+6+8)/4= 5
We can put the value of data and mean in the formula to get;
σ2 = Σ (xi – x̅)2/n
⇒ σ2 = [(2-5)2 + (4-5)2 + (6-5)2 + (8-5)2]/4
⇒ σ2 = (9 + 1 + 1 + 9 )/5 = 20/4Variance (σ2) = 5
Now, Standard Deviation (σ) = √ (σ2)
⇒ Standard Deviation (σ) = √(5)
⇒ Standard Deviation (σ) = 2.238
Practice Problems - Variance and Standard Deviation
Try solving the given question to grab the idea of what we just learned :
**Question 1: Find the variance and standard deviation of the following data
| 5 | 8 | 3 | 4 | 7 | 12 | 5 | 2 |
|---|
**Question 2: Find the standard deviation of the following data:
| X | 5 | 10 | 15 | 20 | 25 | 30 |
|---|---|---|---|---|---|---|
| f(x) | 6 | 7 | 3 | 2 | 1 | 1 |
**Question 3: Find the variance of the first 69 natural numbers.
**Answer 1 : Mean x̄ = 6
- Population Variance = 8.5
- Standard Deviation = √(8.5) = 2.91
**Answer 2 : Mean x̄ = 12
- Population Variance = 48.5
- Thus, Standard Deviation = √48.5 = 6.96
**Answer 3 : Variance = 396.67