How to Add Graphs to Flask apps (original) (raw)
Flask, being a lightweight web framework, does not have built-in support for graphing. However, it can easily integrate with powerful visualization libraries to generate dynamic and interactive charts because graphs and visualizations are an essential part of any web application that deals with data representation.
There are multiple ways to add graphs to Flask applications, but the two most common approaches that we are going to discuss in this article are:
- **Using Chart.js – A **JavaScript-based charting library that allows embedding graphs in HTML pages while passing data from Flask.
- **Using Bokeh – A **Python-based visualization library that enables interactive graphs without needing JavaScript coding.
Installation and Setup
To create a basic flask app, refer to- Create Flask App
After creating and activating a virtual environment install Flask and other libraries required in this project using this command-
pip install bokeh
Let's discuss both ways of adding graphs one by one.
Using Chart.js
**Chart.js is a popular **JavaScript library for creating interactive charts. It works well with Flask by passing data from the **backend to the **frontend using Jinja2 templating. This approach is simple, lightweight, and ideal for real-time data visualization in Flask applications.
Chart.js Integration in HTML
Create a chartjs-example.html file in the templates folder and in that file we include chart.js **CDN link in the HTML template and define a ****** element to render the graph.
**chartjs-example.html code:
HTML `
Chart.js Example<!-- Store Flask data as a JavaScript variable -->
<script>
const labels = JSON.parse('{{ labels | tojson | safe }}');
const chartData = JSON.parse('{{ data | tojson | safe }}');
const data = {
labels: labels,
datasets: [{
label: 'Sales',
backgroundColor: 'rgb(255, 99, 132)',
borderColor: 'rgb(255, 99, 132)',
data: chartData,
}]
};
const config = {
type: 'line',
data: data,
options: { maintainAspectRatio: false }
};
const myChart = new Chart(
document.getElementById('myChart'),
config
);
</script>`
**Code Explanation:
- Includes **Chart.js using the ****
- Once the components are generated and the script is included, the Bokeh plot can be displayed within a Flask app.
Syntax
components(models: Model | Sequence[Model] | dict[str, Model], wrap_script: bool = True, wrap_plot_info: bool = True, theme: ThemeLike = None)
**Parameters:
- **models (Model|list|dict|tuple: A single Model, a list/tuple of Models, or a dictionary of keys and Models.
- **wrap_script (boolean, optional): If True, the returned javascript is wrapped in a script tag. (default: True)
- **wrap_plot_info (boolean, optional) : If True, returns strings. Otherwise, return RenderRoot objects that can be used to build your own divs. (default: True)
- **theme: constitute the full set of roots of a document, applies the theme of that document to the components. Otherwise applies the default theme.
Let's create an app to demonstrate adding graph to flask app using bokeh.
HTML File
Unlike Chart.js, Bokeh requires a JavaScript script to be included for rendering graphs. We use the following script in the HTML file to load Bokeh’s JavaScript resources:
**index.html
HTML `
Bokeh Chart ExampleRandom Scatter Plot
<!-- Embedding Bokeh components -->
{{ div | safe }}
{{ script | safe }}
`
**Explanation:
- ****** - Loads the Bokeh JavaScript library.
- ****{{ div | safe }}** - Inserts the div component containing the Bokeh chart.
- ****{{ script | safe }}** - Embeds the necessary JavaScript to render the Bokeh visualization.
**Note: Ensure the **BokehJS script version matches your **installed Bokeh version. Check your version using "**python show bokeh" command and update the script tag accordingly: . Replace **X.X.X with your **installed version to avoid rendering issues.
**app.py (for bokeh)
Now, let’s write the Flask backend that generates a Bokeh scatter plot and passes it to the HTML template.
Python `
from flask import Flask, render_template from bokeh.plotting import figure from bokeh.embed import components import random
app = Flask(name)
@app.route('/') def homepage(): # Create Bokeh figure p = figure( title="Random Scatter Plot", height=350, sizing_mode="stretch_width" )
# Scatter plot with random values
x_values = list(range(10))
y_values = [random.randint(1, 50) for _ in range(10)]

p.circle(x_values, y_values, size=15, color="navy", alpha=0.5)

# Extract script and div components
script, div = components(p)

# Debugging: Print script and div to check if they are generated
print("Generated Script:", script[:200])  # Print first 200 characters
print("Generated Div:", div[:200])        # Print first 200 characters

# Render an HTML template with the components
return render_template('bokeh-example.html', script=script, div=div)
if name == 'main': app.run()
`
**Explanation:
- **figure() - Creates a responsive figure with adjustable width.
- **p.circle() - Generates a scatter plot with random Y-axis values.
- **components(p) - Extracts JavaScript (script) and HTML (div) components for embedding.
- **render_template("bokeh-example.html", script=script, div=div) - Passes the components to the HTML file for rendering.
Run the above Flask code using the following command in terminal and visit the development URL.
python app.py
**Output:
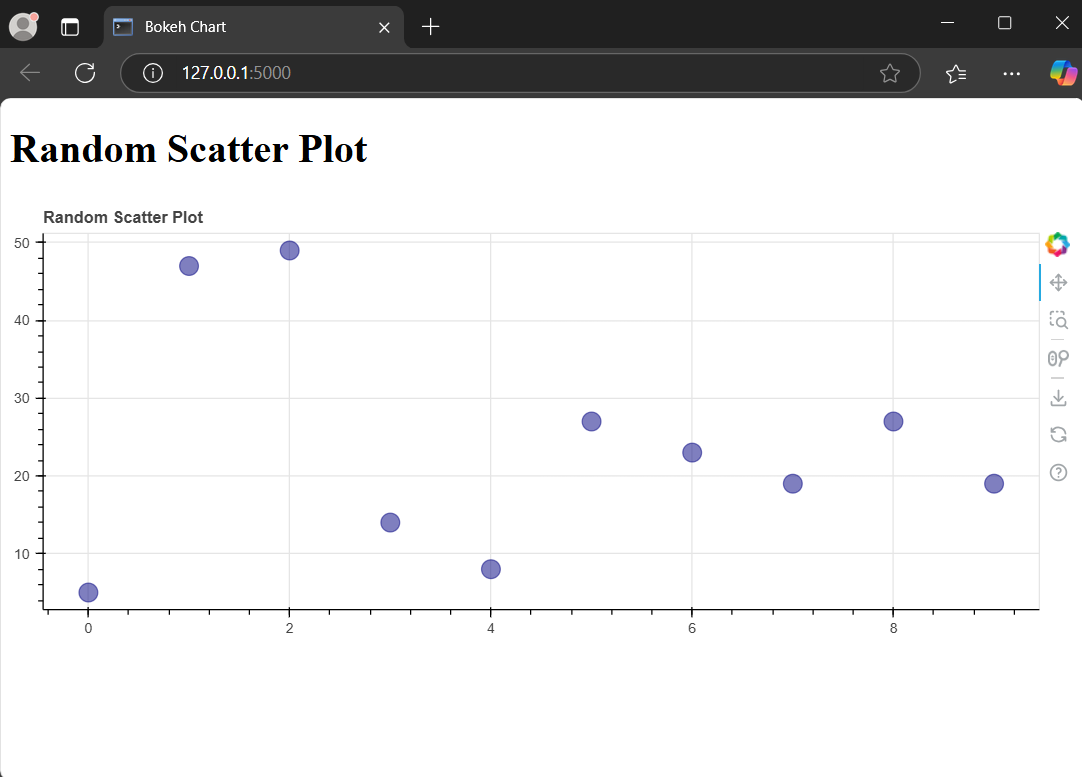
Graph using bokeh